
Chapter 8. Focusing on Interaction Links: Communication Diagrams
The main purpose of sequence diagrams is to show the order of events between the parts of your system that are involved in a particular interaction. Communication diagrams add another perspective to an interaction by focusing on the links between the participants .
Communication diagrams are especially good at showing which links are needed between participants to pass an interaction’s messages. With a quick glance at a communication diagram, you can tell which participants need to be connected for an interaction can take place.
On a sequence diagram, the links between participants are implied by the fact that a message is passed between them. Communication diagrams provide an intuitive way to show the links between participants that are required for the events that make up an interaction. On a communication diagram, the order of the events involved in an interaction is almost a secondary piece of information.
Tip
Sequence and communication diagrams are so similar that most UML tools can automatically convert from one diagram type to the other. The difference between the two approaches is largely personal preference. If you’re happier looking at interactions from a link perspective, then communication diagrams are likely to be for you; however, if you prefer to see the order of the interactions as clearly as possible, then you’re likely to be in the sequence diagram camp.
Participants, Links, and Messages
A communication diagram is made up of three things: participants, the communication links between those participants, and the messages that can be passed along those communication links, as shown in Figure 8-1.

Participants on a communication diagram are represented by a rectangle. The participant’s name and class are then placed in the middle of the rectangle. A participant’s name is formatted as <name> : <class>, similar to participants on a sequence diagram.
You need to specify either the participant’s name or class (or both). If, for some reason, you do not have both the name and class information—sometimes a participant is anonymous and does not have a name—then either the class or the name can be left out.
A communication link is shown with a single line that connects two participants. A link’s purpose is to allow messages to be passed between the different participants; without a link, the two participants cannot interact with each other. A communication link is shown in Figure 8-2.

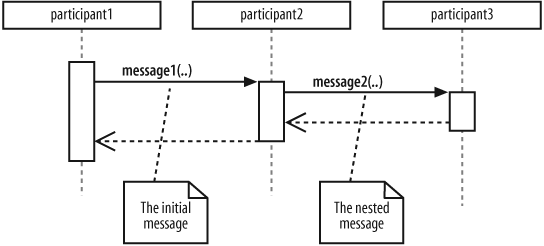
A message on a communication diagram is shown using a filled arrow from the message sender to the message receiver. Similar to messages on a sequence diagram, a message’s signature is made up of the message name and a list of parameters. However, unlike sequence diagrams, the message signature alone is not enough for a communication diagram—you also need to show the order in which the messages are invoked during the interaction.
Communication diagrams do not necessarily flow down the page like sequence diagrams; therefore, message order on a communication diagram is shown using a number before each message. Each message number indicates the order in which that message is invoked, starting at 1 and increasing until all of the messages on the diagram are accounted for. Following this rule, in Figure 8-2, 1. messageA( ) is invoked first and then 2. messageB( ).
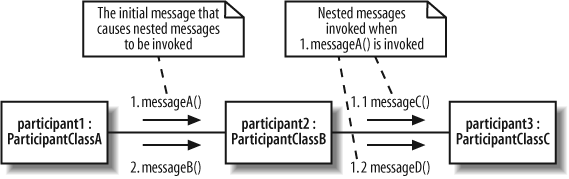
Things get more complicated when a message sent to a participant directly causes that participant to invoke another message. When a message causes another message to be invoked, the second message is said to be nested inside the original message, as shown on Figure 8-3.
Communication diagrams use their message numbering scheme to show the order of nested messages. If we say that the initial message is numbered 1., then any messages nested within the initial message begin with 1., adding a number after the decimal point for the ordering of the nested messages. If an initial message’s number was 1., then the first nested message’s number would be 1.1. An example of this nested message ordering is shown in Figure 8-4.
Messages Occurring at the Same Time
Communication diagrams have a simple answer to the problem of messages being invoked at the same time. Although sequence diagrams need complicated constructs, such as par fragments, communication diagrams take advantage of their number-based message ordering by adding a number-and-letter notation to indicate that a message happens at the same time as another message, shown in Figure 8-5.

Invoking a Message Multiple Times
When describing the messages on a communication diagram, you likely will want to show that a message is invoked a number of times. This is similar to showing that your messages will be invoked in a for(..) loop if you are mapping your communication diagram’s participants to software.
Although UML does not actually dictate how a communication diagram can show that a message is invoked a number of times, it does state that an asterisk should be used before a looping constraint is applied. This rather complicated statement means that the following example is a safe way to specify that something is going to happen 10 times:
*[i = 0 .. 9]
|
In the above looping constraint, i represents a counter that will count up from 0 to 9, doing whatever task is associated with it 10 times. Figure 8-6 shows how this looping constraint can be applied to a message on a communication diagram.
Sending a Message Based on a Condition
Sometimes a message should be invoked only if a particular condition is evaluated to be true. For example, your system might have a message that should be invoked only if the previous message has executed correctly. Just as with sequence diagram fragments, communication diagram messages can have guards set to describe the conditions that need to be evaluated before a message is invoked.

A guard condition is made up of a logical Boolean statement. When the guard condition evaluates to true, the associated message will be invoked—otherwise, the message is skipped.
Figure 8-7 shows how a guard condition can be applied to one of three concurrently executing messages.

When a Participant Sends a Message to Itself
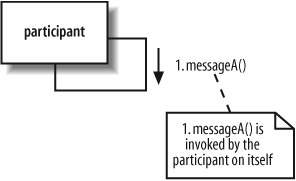
A participant talking to itself may sound strange at first, but if you think in terms of a software object making a call to one of its own methods, you might start to see why this form of communication is needed (and even common). Just as on sequence diagrams, a participant on a communication diagram can send a message to itself. All that is needed is a link from the participant to itself to enable the message to be invoked, as shown in Figure 8-8.
Fleshing out an Interaction with a Communication Diagram
With the new communication diagram notation out of the way, it’s now time to look at a practical example. We’re going to take one of the sequence diagrams from Chapter 7 and show how its interactions can also be modeled on a communication diagram (see Figure 8-9).

Don’t be afraid to refer back to Chapter 7 to help you out with the notation shown on the sequence diagram. Sequence diagrams contain a lot of unique notation, and mastering it all can take some time! It isn’t necessary to have a sequence diagram before you create a communication diagram. You can create communication diagrams or sequence diagrams for your interactions in whatever order you see fit.
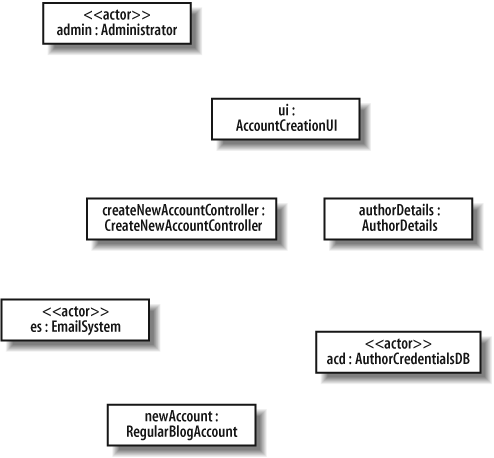
The first step is to add the participants from Figure 8-9 to the communication diagram shown in Figure 8-10.
Next, the links between each of the participants are added so they can communicate with each other, as shown in Figure 8-11.
It’s now time to add the messages that are sent between participants during the lifetime of the interaction, as shown on Figure 8-12. When adding messages to a communication diagram, it’s usually best to start with the participant or event that kicks off the interaction.


Once the initial message or messages are added to the communication diagram, things start to get more complicated. The 3. enterAuthorDetails( ) message triggers a nested
creation message that is sent from the ui : AccountCreationUserInterface participant to create a new authorDetails : CustomerDetails participant. Nested messages get an additional decimal point based on the triggering message’s number, as shown in Figure 8-13.

With that small hurdle out of the way, the rest of the messages can be added to the communication diagram (see Figure 8-14).

Communication Diagrams Versus Sequence Diagrams
Communication and sequence diagrams present such similar information that a comparison is almost inevitable. Setting personal preferences aside, what are the best reasons for picking a sequence diagram, a communication diagram, or even a combination of both to model a particular interaction?
How the Fight Shapes Up
Figure 8-15 shows the two different representations of the same Create a new Regular Blog Account interaction.

The Main Event
Beyond any arguments about personal preference, and using the interaction shown in Figure 8-15 as an example, Table 8-1 compares sequence diagrams and communication diagrams to help you decide which diagram is most useful for your modeling purposes.
|
Feature |
Sequence diagrams |
Communication diagrams |
The result |
|
Shows participants effectively |
Participants are mostly arranged along the top of page, unless the drop-box participant creation notation is used. It is easy to gather the participants involved in a particular interaction. |
Participants as well as links are the focus, so they are shown clearly as rectangles. |
Communication diagrams barely win. Although both types of diagram can show participants as effectively as each other, it can be argued that communication diagrams have the edge since participants are one of their main focuses. |
|
Showing the links between participants |
Links are implied. If a message is passed from one participant to another, then it is implied that a link must exist between those participants. |
Explicitly shows the links between participants. In fact, this is the primary purpose of these types of diagram. |
Communication diagrams win because they explicitly and clearly show the links between participants. |
|
Showing message signatures |
Message signatures can be fully described. |
Message signatures can be fully described. |
Draw! Both types of diagram can show messages as effectively as each other. |
|
With the introduction of sequence fragments, sequence diagrams are much better. |
Shown using the number-letter notation on message sequences. |
Draw! Both types of diagram show parallel messages equally well. | |
|
Achieved using the asynchronous arrow. |
Communication diagrams have no concept of the asynchronous message since its focus is not on message ordering. |
Sequence diagrams are a clear winner here because they explicitly support asynchronous messages. | |
|
Easy to read message ordering |
This is a sequence diagram’s forté. Sequence diagrams clearly show message ordering using the vertical placement of messages down the diagram’s page. |
Shown using the number-point-nested notation. |
Sequence diagrams are a clear winner here since they really show off message ordering clearly and effectively. |
|
Easy to create and maintain the diagram |
Creating a sequence diagram is fairly simple. However, maintaining sequence diagrams can be a nightmare unless a helpful UML tool is being used. |
Communication diagrams are simple enough to create; however, maintenance, especially if message numbering needs to be changed, still ideally needs the support of a helpful UML tool. |
This is a difficult one to judge and is largely based on personal preference. However, communication diagrams do have the edge on the ease-of-maintenance stakes. |
OK, so the fight was a little biased and tongue-in-cheek in that the features assessed were already clear discriminators between communication and sequence diagrams. Although the results shown in Table 8-1 are not really surprising, it’s worth stating once again that you should:
Use sequence diagrams if you are mainly interested in the flow of messages throughout a particular interaction.
Use communication diagrams if you are focusing on the links between the different participants involved in the interaction.
Perhaps the most important message to take away from this comparison is that although both types of diagram convey similar information, communication diagrams and sequence diagrams offer different benefits; therefore, the best approach, time willing, is to use both.
What’s Next?
You’ve seen sequence and communication diagrams, which are the two most commonly used types of interaction diagrams. Timing diagrams are a more specialized interaction diagram focusing on time constraints on interactions, which is particularly useful for expressing time constraints in real-time systems. Timing diagrams are covered in Chapter 9.