The Performance tool is the tool of choice for monitoring IIS performance. The Performance tool graphically displays statistics for the set of performance parameters you’ve selected for display. These performance parameters are referred to as counters. When you install IIS on a system, the Performance tool is updated with a set of counters for tracking IIS performance. You can update these counters when you install additional services and add-ons for IIS as well.
The Performance tool creates a graph depicting the counters you’re tracking. The update interval for this graph is configurable but is set to 1 second by default. As you’ll see when you work with the Performance tool, the tracking information is most valuable when you record performance information in a log file so that it can be played back. Also, the Performance tool is helpful when you configure alerts to send messages when certain events occur, such as when an automatic IIS restart is triggered.
The sections that follow examine key techniques you’ll use to work with the Performance tool. You start the Performance tool by selecting the Performance option from the Administrative Tools menu.
The Performance tool only displays information for counters you’re tracking. More than a hundred IIS counters are available, provided you’ve installed the related service. Counters are organized into object groupings. For example, all ASP-related counters are associated with the Active Server Pages performance object. You’ll find object counters for other services as well. A list of the main IIS-related counter objects follows:
ASP.NET. Object counters for general tracking of ASP.NET applications, application requests, and worker processes
ASP.NET Applications. Object counters for tracking the ASP.NET application queue and other specific ASP.NET application counters
Active Server Pages. Object counters for ASP scripts and applications running on the server
FTP Service. Object counters for the FTP service
Indexing Service. Object counters for Indexing Service that relate to indexing processes, word lists, and queries
Indexing Service Filter. Object counters provide additional performance information related to content filters and indexing speed related to filters
Internet Information Services Global. Object counters for all Internet services (WWW, FTP, SMTP, NNTP, and so on) running on the server
NNTP Commands. Object counters related to NNTP commands that users are executing on the server
NNTP Server. Object counters that track overall NNTP performance, such as the number of articles sent, received, and posted per second
SMTP NTFS Store Driver. Object counters for tracking the total number of messages and message streams
SMTP Server. Object counters that track overall SMTP performance, such as the number of messages sent and received per second
Web Service. Object counters for the World Wide Web Publishing Service
Web Service Cache. Object counters that provide detailed information on the cache used by the Web service, including cache for metadata, files, memory, and Uniform Resource Identifiers (URIs)
Counters for monitoring performance are summarized by issue and object in Table 13-1. The easiest way to learn about these counters is to read the explanations available in the Add Counters dialog box. Start the Performance tool, click the Add button on the toolbar, and then select an object in the Performance Object drop-down list. Afterward, click Explain and then scroll through the list of counters for this object.
Table 13-1. Key Counters Used to Monitor Web Server Performance
Issue | Counter | Object Available For |
|---|---|---|
Application Status | Application Restarts | ASP.NET |
Applications Running | ASP.NET | |
ASP sessions | Session Duration | Active Server Pages |
Sessions Current | Active Server Pages | |
Sessions Timed Out | Active Server Pages, ASP.NET Applications | |
Sessions Total | Active Server Pages, ASP.NET Applications | |
ASP transactions | Transactions Aborted | Active Server Pages, ASP.NET Applications |
Transactions Committed | Active Server Pages, ASP.NET Applications | |
Transactions Pending | Active Server Pages, ASP.NET Applications | |
Transactions Total | Active Server Pages, ASP.NET Applications | |
Transactions/Sec | Active Server Pages, ASP.NET Applications | |
Bandwidth usage | Current Blocked Async I/O Requests | Internet Information Services Global, Web Service |
Measured Async I/O Bandwidth usage | Internet Information Services Global, Web Service | |
Total Allowed Async I/O Requests | Internet Information Services Global, Web Service | |
Total Blocked Async I/O Requests | Internet Information Services Global, Web Service | |
Total Rejected Async I/O Requests | Internet Information Services Global, Web Service | |
Caching and Memory | File Cache Flushes, URI Cache Flushes | Internet Information Services Global |
File Cache Hits, URI Cache Hits | Internet Information Services Global | |
Internet Information Services Global | ||
File Cache Misses, URI Cache Misses | Internet Information Services Global | |
Maximum File Cache Memory Usage | Internet Information Services Global | |
Script Engines Cached | Active Server Pages | |
Template Cache Hit Rate | Active Server Pages | |
Template Notifications | Active Server Pages | |
Templates Cached | Active Server Pages | |
Connections | Connection Attempts/Sec | Web Service |
Current Anonymous User | Web Service, FTP Service | |
Current Connections | Web Service, FTP Service | |
Current File Cache Memory Usage | Internet Information Services Global | |
Maximum Connections | Web Service, FTP Service | |
Current Files Cached | Internet Information Services Global | |
Current NonAnonymous Users | Web Service, FTP Service | |
Maximum Anonymous Users | Web Service, FTP Service | |
Maximum NonAnonymous Users | Web Service, FTP Service | |
Total Anonymous Users | Web Service, FTP Service | |
Total Connection Attempts (all instances) | Web Service, FTP Service | |
Total Logon Attempts | Web Service, FTP Service | |
Total NonAnonymous Users | Web Service, FTP Service | |
Errors | Errors During Script Runtime | Active Server Pages |
Errors From ASP Preprocessor | Active Server Pages | |
Errors From Script Compilers | Active Server Pages | |
Active Server Pages | ||
Not Found Errors/Sec | Web Service | |
Requests Not Authorized | Active Server Pages, ASP.NET Applications | |
Requests Not Found | Active Server Pages, ASP.NET Applications | |
Requests Rejected | Active Server Pages, ASP.NET | |
Requests Timed Out | Active Server Pages, ASP.NET Applications | |
Service Uptime | Web Service | |
Total Not Found Errors | Web Service | |
Indexing | Running Queries | Indexing Service |
Total # of Documents | Indexing Service | |
Total # of Queries | Indexing Service | |
Total Indexing Speed (MB/hr) | Indexing Service Filter | |
Requests | Get Requests/Sec | Web Service |
Head Requests/Sec | Web Service | |
ISAPI Extension Requests/Sec | Web Service | |
Post Requests/Sec | Web Service | |
Put Requests/Sec | Web Service | |
Request Bytes In Total | Active Server Pages, ASP.NET Applications | |
Request Bytes Out Total | Active Server Pages, ASP.NET Applications | |
Requests Executing | Active Server Pages, ASP.NET Applications | |
Requests Queued | Active Server Pages, ASP.NET | |
Requests Rejected | Active Server Pages, ASP.NET | |
Requests Succeeded | Active Server Pages, ASP.NET Applications | |
Requests Timed Out | Active Server Pages, ASP.NET Applications | |
Requests Total | Active Server Pages, ASP.NET Applications | |
Requests/Sec | Active Server Pages, ASP.NET Applications | |
Throughput | Bytes Received/Sec | Web Service, FTP Service |
Bytes Sent/Sec | Web Service, FTP Service | |
Bytes Total/Sec | Web Service, FTP Service | |
Files Received/Sec | Web Service | |
Files Sent/Sec | Web Service | |
Files/Sec | Web Service | |
Total Files Received | Web Service, FTP Service | |
Web Service, FTP Service | ||
Total Files Transferred | Web Service, FTP Service | |
Worker Process Status | Worker Process Restarts | ASP.NET |
Worker Processes Running | ASP.NET |
Tip
Multiple versions of ASP.NET can be installed. As a result, the ASP.NET and ASP Applications counter objects have version-specific instances. Use the counter objects for the specific ASP.NET versions you want to track.
When the Performance tool is monitoring a particular object, it can track all instances of all counters for that object. Instances are multiple occurrences of a particular counter. For example, when you track counters for the Web Service object, you often have a choice of tracking all Web site instances or specific Web site instances. Following this, if you configured CorpWeb, CorpProducts, and CorpServices sites, you could use Web Service counters to track a specific Web site instance or multiple Web site instances.
To select which counters you want to monitor, complete the following steps:
Start the Performance tool by clicking Start and selecting All Programs and then Performance from the Administrative Tools menu.
The Performance tool has several views. Click View Graph on the toolbar or press Ctrl + G to ensure that you’re in Graph view.
To add counters, click Add on the toolbar or press Ctrl + I. This displays the Add Counters dialog box shown in Figure 13-4 on the following page. The key fields are the following:
Use Local Computer Counters. Configure performance options for the local computer.
Select Counters From Computer. Enter the Universal Naming Convention (UNC) name of the IIS server you want to work with, such as \ENGSVR01.
Performance Object. Select the type of object you want to work with, such as Active Server Pages.
All Counters. Select all counters for the current performance object.
Select Counters From List. Select one or more counters for the current performance object. For example, you could select Requests Not Found, Requests Queued, and Requests Total.
All Instances. Select all counter instances for monitoring.
Select Instances From List. Select one or more counter instances to monitor. For example, you could select instances of Anonymous Users/Sec for individual Web sites or for all Web sites.
When you’ve selected all the necessary options, click Add to add the counters to the graph. Repeat this process as necessary to add other performance parameters.
Click Close when you’re finished.

You can use performance logs to track the performance of IIS, and you can replay them later. As you set out to work with logs, keep in mind that the parameters you track in log files are recorded separately from the parameters you’re charting in the Performance console. You can configure log files to update counter data automatically or manually. With automatic logging, a snapshot of key parameters is recorded at specific time intervals, such as every 15 seconds. With manual logging, you determine when snapshots are made. Two types of performance logs are available:
Counter logs. These logs record performance data on the selected counters when a predetermined update interval has elapsed.
Trace logs. These logs record performance data whenever their related events occur.
To create and manage performance logging, complete the following steps:
Access the Performance console by selecting the Performance option on the Administrative Tools menu.
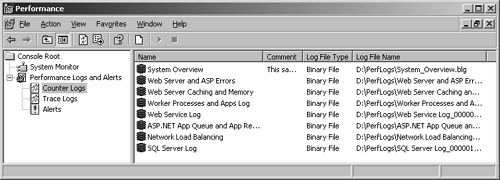
Expand the Performance Logs And Alerts node by clicking the plus sign (+) next to it. If you want to configure a counter log, select Counter Logs. Otherwise, select Trace Logs.
As shown in Figure 13-5, you should see a list of current logs (if any) in the right pane. A green log symbol next to the log name indicates logging is active. A red log symbol indicates logging is stopped.
You can create a new log by right-clicking in the right pane and selecting New Log Settings from the shortcut menu. A New Log Settings dialog box appears asking you to give a name to the new log settings. Type a descriptive name here before continuing.
To manage an existing log, right-click its entry in the right pane and then select one of the following options:
Start. Activates logging
Stop. Halts logging
Save Settings As. Saves the performance log as a Web page for easy access
Delete. Deletes the log
Properties. Displays the Log Properties dialog box
Counter logs record performance data on the selected counters at a specific sample interval. For example, you could sample performance data for the Web service every 5 minutes. To create a counter log, complete the following steps:
Select Counter Logs in the left pane of the Performance console, and then right-click in the right pane to display the shortcut menu. Select New Log Settings.
In the New Log Settings dialog box, type a name for the log, such as HTTP Performance Monitor or Total Request Monitor, and then click OK.
In the General tab, click Add Counters to display the Add Counters dialog box. This dialog box is identical to the Add Counters dialog box shown previously in Figure 13-4.
Use the Add Counters dialog box to add counters for logging. Click Close when you’re finished.
In the Interval field, type in a sample interval and select a time unit in seconds, minutes, hours, or days. The sample interval specifies when new data is collected. For example, if you select a sample interval of 15 minutes, the log is updated every 15 minutes.
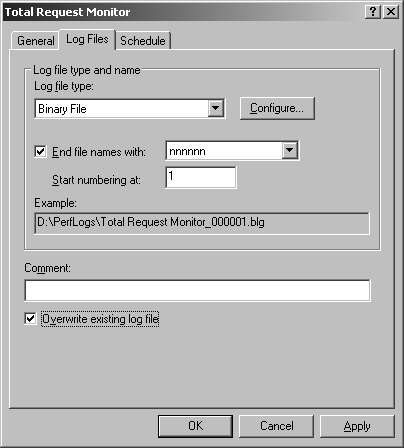
As shown in Figure 13-6, select the Log Files tab and then specify how the log file should be created using the following fields:
Log File Type. Sets the type of log file to create. Use Text File (Comma Delimited) for a log file with comma-separated entries. Use Text File (Tab Delimited) for a log file with tab-separated entries. Use Binary File to create a binary file that only can be read by the Performance console. Use Binary Circular File to create a binary file that overwrites old data with new data when the file reaches a specified size limit.
End File Names With. Sets an automatic suffix for each new file created when you run the counter log. Logs can have a numeric suffix or a suffix in a specific date format.
Start Numbering At. Sets the first serial number for a log that uses an automatic numeric suffix.
Comment. Sets an optional description of the log, which is displayed in the Comment column.
Overwrite Existing Log File. Specifies that any existing log file at the current log file location can be overwritten as necessary.
By default, the operating system stores performance logs in the %System-Drive%PerfLogs folders. The first time you create a counter or trace log, you’ll be prompted to create this folder. If you want to configure a unique log location or set size limits for this counter log, click Configure. This displays the Configure Log Files dialog box. You can now specify the following options:
Location. Sets the folder location for the log file
File Name. Sets the name of the log file
Maximum Limit. Sets no predefined limit on the size of the log file
Limit Of. Sets a specific limit in megabytes on the size of the log file
As shown in Figure 13-7, select the Schedule tab and then specify when logging should start and stop.
You can configure the logging to start manually or automatically at a specific date. Select the appropriate option and then specify a start date if necessary.
You can configure the log file to stop in the following ways:
Click OK when you’ve finished setting the logging schedule. The log is then created, and you can manage it as explained in the "Creating and Managing Performance Logging" section of this chapter.

Trace logs record performance data whenever events for their source providers occur. A source provider is an application or operating system service that has traceable events. On domain controllers, you’ll find System, Local Security Authority, and Active Directory:NetLogon providers. On other servers, the System and Local Security Authority providers probably will be the only providers available.
To create a trace log, complete the following steps:
Select Trace Logs in the left pane of the Performance console, and then right-click in the right pane to display the shortcut menu. Select New Log Settings.
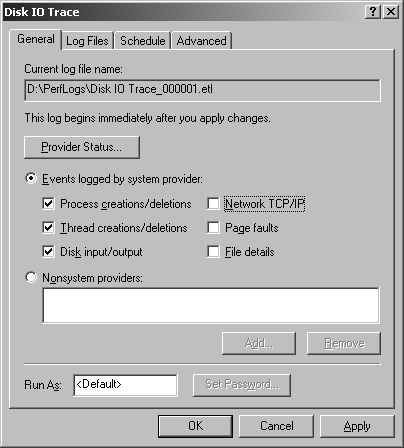
In the New Log Settings dialog box, type a name for the log, such as Disk I/O Trace or Network TCP/IP Trace, and then click OK. This opens the dialog box shown in Figure 13-8.
If you want to trace operating system events, select the Events Logged By System Provider option. You can now select system events to trace.
If you want to trace another provider, select the Nonsystem Providers option button and then click Add. This displays the Add Nonsystem Providers dialog box, which you’ll use to select the provider to trace.
When you’re finished selecting providers and events to trace, select the Log Files tab. You can now configure the trace file as detailed in steps 6 and 7 of the "Creating Counter Logs" section of this chapter. The only change is that the log file types are different. With trace logs, you have two log types:
Sequential Trace File. Writes events to the trace log sequentially up to the maximum file size (if any)
Circular Trace File. Overwrites old data with new data when the file reaches a specified size limit
Select the Schedule tab and then specify when tracing starts and stops.
You can configure the logging to start manually or automatically at a specific date. Select the appropriate option and then specify a start date if necessary.
You can configure the log file to stop manually, after a specified period (such as 7 days), at a specific date and time, or when the log file is full (if you’ve set a specific file size limit).
When you finish setting the logging schedule, click OK. The log is then created and can be managed as explained in the "Creating and Managing Performance Logging" section of this chapter.
When you’re troubleshooting problems, you’ll often want to log performance data over an extended period and analyze the data later. To do this, complete the following steps:
Configure automatic logging as described in the "Creating Counter Logs" section of this chapter.
Load the log file in the Performance console when you’re ready to analyze the data. Select System Monitor in the Performance console and then click View Log Data on the System Monitor toolbar or right-click in the right pane and select Properties. This displays the System Monitor Properties dialog box.
In the Source tab, select Log Files and then click Add. Use the Select Log File dialog box to browse to the log you want to use. Remember, log files are stored in %SystemDrive%PerfLogs by default.
After you select the log you want to view, click Open. Repeat this step to add other log files for display. When you’re ready to proceed, click OK.
Counters you’ve logged are available for charting. Click Add and then select the counters you want to display.
Tip
Unlike previous versions, the current System Monitor can display and play back performance data stored in any of the defined file formats. If you see an error message when trying to play back a log, it might have an erroneous error description that says you can’t play back logs of this type. Make sure the log file contains data. There’s no data to play back in an empty file.
You can configure alerts to notify you when certain events occur or when certain performance thresholds are reached. You can send these alerts as network messages and as events that are logged in the application event log. You can also configure alerts to start applications and performance logs.
To add alerts in Performance console, complete the following steps:
Select Alerts in the left pane of the Performance console, and then right-click in the right pane to display the shortcut menu. Select New Alert Settings.
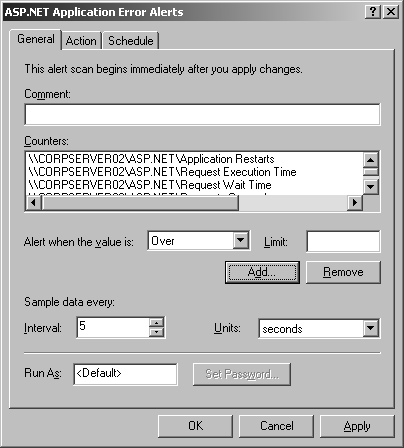
In the New Alert Settings dialog box, type a name for the alert, such as ASP Error Alert or High User Connection Alert. Then click OK. This opens the dialog box shown in Figure 13-9.
On the General tab, type an optional description of the alert in the Comment field. Then click Add to display the Add Counters dialog box. This dialog box is identical to the Add Counters dialog box shown previously in Figure 13-4.
Use the Add Counters dialog box to add counters that trigger the alert. Click Close when you’re finished.
In the Counters frame, in the General tab of the Add Counters dialog box, select the first counter and then use the Alert When The Value Is field to set the occasion when an alert for this counter is triggered. Alerts can be triggered when the counter is over or under a specific value. Select Over or Under and then set the trigger value in the Limit field. The unit of measurement is whatever makes sense for the currently selected counters. For example, to trigger an alert if processor time is over 95 percent, you would select Over and then type 95. Repeat this process to configure other counters you’ve selected.
In the Sample Data Every field, type in a sample interval and select a time unit in seconds, minutes, hours, or days. The sample interval specifies when new data is collected. For example, if you set the sample interval to 5 minutes, the log is updated every 5 minutes.
Select the Action tab, as shown in Figure 13-10. You can now specify any of the following actions to take place when an alert is triggered:
Log An Entry In The Application Event Log. Creates log entries for alerts
Send A Network Message To. Sends a network message to the computer specified
Start Performance Data Log. Sets a counter log to start when an alert occurs
Run This Program. Sets the complete file path of a program or script to run when the alert occurs
Tip
You can run any type of executable file, including batch scripts with the .bat or .cmd extension and Windows scripts with the .vbs, .js, .pl, or .wsc extension. To pass arguments to a script or application, use the options in the Command Line Arguments dialog box. Normally, arguments are passed as individual strings. However, if you select Single Argument String, the arguments are passed in a comma-separated list within a single string. The Example field at the bottom of the dialog box shows how the arguments would be passed.
Select the Schedule tab and then specify when alerting starts and stops. For example, you could configure the alerts to start on a Friday evening and stop on Monday morning. Then each time an alert occurs during this period, the specified actions are executed.
You can configure alerts to start manually or automatically at a specific date. Select the appropriate option and then specify a start date if necessary.
You can configure alerts to stop manually, after a specified period of time, such as 7 days, or at a specific date and time.
When you’ve finished setting the alert schedule, click OK. The alert is then created and you can manage it in much the same way that you manage counter and trace logs.