Chapter 23. Developing a Charting Extension
This chapter discusses the process of adding a new chart type to the BIRT chart engine. BIRT provides a radar chart type with the chart engine as an example of how to build new chart types. This chapter describes how to create this radar chart example.
A radar chart, also known as a spider chart, displays multiple data points proportionately using equidistant radii. This chart type allows the simultaneous comparison of multiple data points in a series. Each data point value determines the magnitude of each radius.
The number of data points in the chart determines the number of radials. The data points can be connected by lines, except for the first and last data points, or all the lines can be connected and the space filled to form a polygon.
The background for a radar chart can be blank, circular, or polygonal. Some chart generators support additional background types, but the following examples support only these three backgrounds, as shown in Figure 23-1 and Figure 23-2.
Figure 23-1 Images of possible radar charts

Figure 23-2 More images of possible radar charts

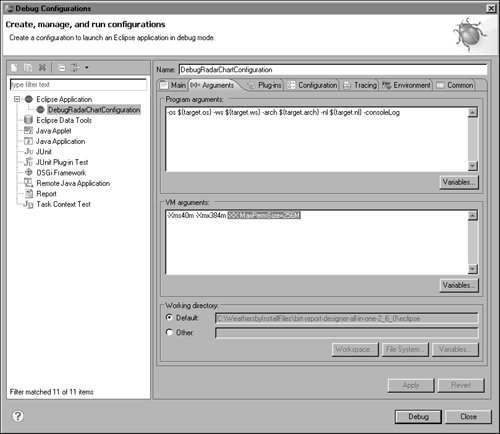
The radar chart example presented in this discussion uses BIRT chart engine version 2.6.
About BIRT charting extension points
The chart engine, like most components in BIRT, defines extension points for adding new features. Table 23-1 is a partial list of the primary extension points with brief descriptions..
Table 23-1 BIRT charting extension points

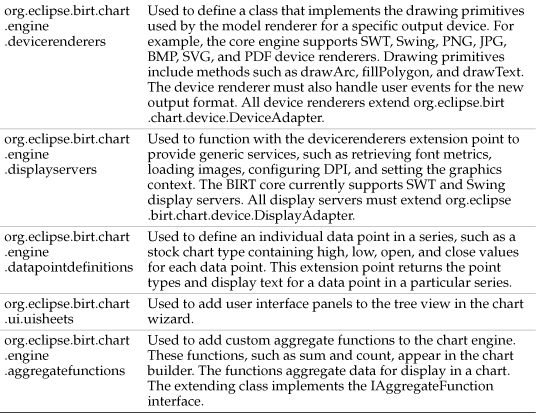
The radar chart example implements some of the extension points described in Table 23-1. The example uses a category and value for each data point, so no special treatment of the individual points is required as occurs, for example, in a stock chart
The implementation of the example requires two plug-ins. The first plug-in implements the user interface in the design-time wizard, shown in Figure 23-3. The second plug-in implements the run-time version of a radar chart that appears in a rendered document.
Figure 23-3 Viewing radar series attributes
The radar chart example requires unloose default implementation of the org.eclipse.birt.chart.engine.datasetprocessors extension point because the data for this chart type is not unique. The example also adds a new chart type, which requires implementing the org.eclipse.birt.chart.ui.types and org.eclipse.birt.chart.engine.charttypes extension points.
The example implements the org.eclipse.birt.chart.engine.modelrenderers extension point to do the drawing and the org.eclipse.birt.chart.ui.seriescomposites extension point to implement a radar-specific series sheet for the chart builder.
The example implements the following extension points listed in Table 23-2.
Table 23-2 BIRT radar source plug-ins

Note that these plugins contain other chart examples. For example, the org.eclipse.birt.chart.examples plug-in contains chart engine API examples.
Setting up the build environment
The example requires an initial workspace setup. The chart engine uses an XSD SDK to generate an EMF model. The example requires the BIRT chart engine plug-ins. These components must be present in the environment. Obtain the required plug-ins by downloading the Eclipse IDE for Java and Report Developers from http://www.eclipse.org/downloads. Unzip the downloaded file to a suitable location and launch eclipse.exe located in the eclipse directory. Create a new workspace and provide a name, such as C:workworkspaces2.6workspacesexamplechart. Next, add the EMF and XSD plug-ins manually or use the update manager. To use the update manager, select the Help→Install New Software, as shown in Figure 23-4.
Figure 23-4 Using the update manager to install new software

In Install, in Work with, select an update site. For example, select Helios - http://download.eclipse.org/releases/helios. In the list of available updates, expand Modeling and select EMF – Eclipse Modeling Framework SDK and XSD – XML Schema Definition SDK items, as shown in Figure 23-5.
Figure 23-5 Selecting an update site and the EMF and XSD items

Choose Next. Install calculates dependencies and presents a summary of the items to install, as shown in Figure 23-6.
Figure 23-6 Modeling components to install
![]()
Choose Next, accept the license, then choose Finish.
After downloading the EMF and XSD plug-ins, restart Eclipse. Then, create a new plug-in project, as described in the following section.
Extending the chart model
After setting up the workspace, you can develop the new chart type. As stated earlier, BIRT uses XSD files to define the chart model. These XSD files are in the org.elcipse.birt.chart.engine plug-in. You can download the plug-in from CVS or obtain it from the source download. Technically, only the xsd directory and the existing EMF model are required, although it is useful to have the chart engine source for debugging purposes.
The xsd directory in the chart engine plug-in contains the schema files, listed in Table 23-3. The schemas meet all the requirements for other chart elements, such as data types. A radar chart requires extending only the type schema.
Table 23-3 XSD schema files in the chart engine plug-in

Figure 23-7 shows the new radar chart type and the settings in the type schema required for a radar series. For example, the boolean value, FillPolys, determines whether a polygon drawn in the radar chart is filled.
Figure 23-7 Viewing the schema for the radar chart type

An example of this type schema for the chart and the schema file is the file named radar.xsd, which is located in the org.eclipse.birt.chart.examples.radar.model package in the org.eclipse.birt.chart.examples.core plug-in.
In the schema file, the xsd:import statement imports the existing schema files from the chart engine plug-in, such as the type schema, using the following code:
<xsd:import namespace="http://www.birt.eclipse.org/ChartModelType"
schemaLocation="../../../../../../../../../
org.eclipse.birt.chart.engine/xsd/type.xsd"/>
Creating an EMF model
First, create a plug-in project. Then, create a folder or package in the project for the model. The next step is to create an EMF model for the series type based on the schema. To create an EMF Generator Model, choose File→New→Other. In New, expand Eclipse Modeling Framework and select EMF Generator Model, as shown in Figure 23-8.
Figure 23-8 Selecting an EMF generator model

Choose Next. Type a name for the model class. In Figure 23-9, showing the radar example, the model is in the org.eclipse.birt.chart.examples.radar.model package.
Figure 23-9 Creating an EMF model for the radar-series type

Choose Next. Select the XML Schema as the model importer, as shown in Figure 23-10.
Figure 23-10 Creating an XML schema for the radar-series type

Choose Next. The wizard prompts for the location of the schema files to use in creating the model. Select Browse Workspace and select the XSD file created earlier, as shown in Figure 23-11.
Figure 23-11 Selecting the location of the schema file
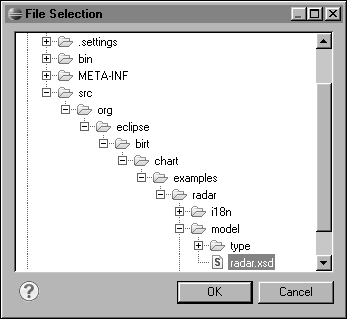
Choose OK. The XSD file appears in the wizard, as shown in Figure 23-12.
Figure 23-12 Checking the location of the schema files

Choose Next. In Package Selection, select the package of the new type, which in the radar example is the org.actuate.birt.radar.chart.model.type. You can also change the name of the ecore file. The example in Figure 23-13 shows the file name changed to radar.ecore.
Figure 23-13 Selecting the new type

To reference the existing chart model, choose Add. In File Selection, select the generator model to reference, as shown in Figure 23-14. The existing generator model is in the src/model directory of the chart engine plug-in.
Figure 23-14 Selecting the new EMF generator model

After these steps, New EMF Generator Model displays all the referenced chart model packages and the root package of the new type to create, as shown in Figure 23-15.
Figure 23-15 Selecting the new EMF generator model

Choose Finish. This operation creates the genmodel and ecore files.
To change the model, change the XSD file and reload the model. To perform this task, right-click the genmodel file and choose Reload. To generate source code based on this model, right-click genmodel and choose Open with EMF Generator. Next, right–click the top node and choose Generate Model Code, as shown in Figure 23-16.
Figure 23-16 Choosing Generate Model Code

These operations generate the basic code for manipulating the model. Note that Eclipse constructs the package names using the targetNamespace attribute defined in the schema, as shown in the following example:
targetNamespace="http://www.birt.eclipse.org/RadarChartModelType"
In the radar example, these packages have been refactored for more suitable names.
Completing the new SeriesImpl
After creating the basic code for manipulating the model, implement the extensions that create the series. First, add methods to the newly created SeriesImpl class. In this example, the class is RadarSeriesImpl.
Although EMF provides most of the required code, there are a few methods in the org.eclipse.birt.chart.model.component.Series interface that may need to be written manually. These methods can include canBeStacked, which determines whether multiple series of the same type can be stacked, and canParticipateInCombination, which determines if the chart type can participate in a combination chart. In most cases, such as this example, the default implementation provides adequate functionality and a custom implementation is not required.
The method, getDisplayName( ), which returns a user-friendly string name for the chart, typically needs to be implemented. In the example, the org.eclipse.birt.chart.examples.radar.i18n package handles all messages.
The following code implements the getDisplayName( ) method in the radar chart:
public String getDisplayName( )
{
return Messages.getString( "RadarSeriesImpl.displayName" );
}
It is also necessary to override several methods in the new SeriesImpl class. The first is the create( ) method, which allows an instance of the SeriesImpl class to be created and initialized, as shown in the following code:
public static final RadarSeries create( )
{
final RadarSeries se =
org.eclipse.birt.chart.examples.radar.model.type
.RadarTypeFactory.eINSTANCE.createRadarSeries( );
( (RadarSeriesImpl) se ).initialize( );
return se;
}
When adding the create( ) method, verify that the TypeFactory class is from the org.eclipse.birt.chart.examples.radar.model.type package and not from the org.eclipse.birt.chart.model.type package.
The second method is the initialize( ) method. In the example, this method sets several default attributes for the radar series, including setting the radar-line attributes and the web-radar, background-line attributes, as shown in Listing 23-1.
Listing 23-1 initialize method
protected void initialize( )
{
super.initialize( );
final LineAttributes lia =
AttributeFactory.eINSTANCE.createLineAttributes( );
( (LineAttributesImpl) lia ).set( null,
LineStyle.SOLID_LITERAL,
1 );
lia.setVisible( true );
setLineAttributes( lia );
final LineAttributes weblia =
AttributeFactory.eINSTANCE.createLineAttributes( );
( (LineAttributesImpl) weblia ).set( null,
LineStyle.SOLID_LITERAL,
1 );
weblia.setVisible( true );
setWebLineAttributes( weblia );
final Marker m = AttributeFactory.eINSTANCE.createMarker( );
m.setType( MarkerType.BOX_LITERAL );
m.setSize( 4 );
m.setVisible( true );
LineAttributes la =
AttributeFactory.eINSTANCE.createLineAttributes( );
la.setVisible( true );
m.setOutline( la );
setMarker( m );
}
Note that additional imports are required. See the source-code example for the complete list of packages to import.
The final two methods to override copy an instance of the radar series. These methods are copyInstance( ) and set( ), as shown in Listing 23-2:
Listing 23-2 copyInstance( ) method
public RadarSeries copyInstance( )
{
RadarSeriesImpl dest = new RadarSeriesImpl( );
dest.set( this );
return dest;
}
protected void set( RadarSeries src )
{
super.set( src );
// children
if ( src.getMarker( ) != null )
{
setMarker( src.getMarker( ).copyInstance( ) );
}
if ( src.getLineAttributes( ) != null )
{
setLineAttributes( src.getLineAttributes( ).copyInstance( ) );
}
if ( src.getWebLineAttributes( ) != null )
{
setWebLineAttributes( src.getWebLineAttributes( ).copyInstan
ce( ) );
}
if ( src.getWebLabel( ) != null )
{
setWebLabel( src.getWebLabel( ).copyInstance( ) );
}
// attributes
paletteLineColor = src.isPaletteLineColor( );
paletteLineColorESet = src.isSetPaletteLineColor( );
backgroundOvalTransparent = src.isBackgroundOvalTransparent( );
backgroundOvalTransparentESet =
src.isSetBackgroundOvalTransparent( );
showWebLabels = src.isShowWebLabels( );
showWebLabelsESet = src.isSetShowWebLabels( );
webLabelMax = src.getWebLabelMax( );
webLabelMaxESet = src.isSetWebLabelMax( );
webLabelMin = src.getWebLabelMin( );
webLabelMinESet = src.isSetWebLabelMin( );
webLabelUnit = src.getWebLabelUnit( );
webLabelUnitESet = src.isSetWebLabelUnit( );
fillPolys = src.isFillPolys( );
fillPolysESet = src.isSetFillPolys( );
connectEndpoints = src.isConnectEndpoints( );
connectEndpointsESet = src.isSetConnectEndpoints( );
plotSteps = src.getPlotSteps( );
plotStepsESet = src.isSetPlotSteps( );
}
These two methods are called any time the engine makes a copy of the radar series, for example, when run-time series are created based on the design-time series. The copyInstance( ) method also needs to be defined in the generated Series interface. In this example, the following code was added to the org.eclipse.birt.chart.examples.radar.model.type.RadarSeries interface:
RadarSeries copyInstance( );
Implementing the extension points
The following section describes the design-time extension points first, then the run-time extension points. The EMF-generated code described earlier in the chapter must be in the run-time plug-in.
Design-time plug-in extensions
The design-time extensions for the chart builder and the radar chart user interfaces are implemented in the org.eclipse.birt.chart.examples plug-in. The following sections discuss each extension point, starting with the design-time extension points, org.eclipse.birt.chart.ui.types and org.eclipse.birt.chart.ui.seriescomposites.
Chart UI-types extension point
Use the UI-types extension point to register new chart types. To use this extension point, create a class that implements the org.eclipse.birt.chart.ui.swt.interfaces.IChartType interface. In this example, we are technically creating a new series renderer, not a new chart type. However, this type shows up as a new chart type in the user interface.
Most of the methods in this interface are used extensively in the chart builder. In the chart engine, there is a default implementation of the IChartType interface from which most chart types extend, the org.eclipse.birt.chart.ui.swt.DefaultChartTypeImpl class. The example extends from this class. The following list describes the interface methods along with a brief description of when to call each method:
• getName( )
Returns the name of the Chart.
• getDisplayName( )
Returns the name to display in the chart builder wizard.
• getImage( )
Returns the icon image to display in the chart builder for a specific chart type.
• getChartSubtypes( )
Returns a collection of chart subtypes that the chart supports. A collection should contain an image and a name for each subtype supported.
• getModel( )
Returns the model for the current chart under development. This method is called when the user selects a different chart type, to handle converting between chart types. For example, when the user selects a bar chart in the first tab, then selects a pie chart, this method is called to convert from a chart with axes to a chart without axes.
• getSupportedDimensions( )
Called to determine how many dimensions the chart type supports. Currently, the engine can process 2D, 2D with depth, and 3D. If a chart type supports more than 2D, additional rendering code must be written, which is discussed later in this chapter.
• getDefaultDimension( )
Returns the default dimension for a chart type.
• supportsTransposition( )
Determines if the chart dimensions can be transposed, such as swapping the x- and y- axes. Transposition can be specific to a supported dimension type. For example, a 2Dchart can support transposition, but a 3D chart may not.
• getDefaultOrientation( )
Returns the default orientation of a chart, vertical or horizontal. No implementation defaults to vertical.
• getBaseUI( )
Constructs the base series user interface in the chart builder, which sets the data values for the chart type.
• isDimensionSupported( )
Determines if a chart type supports a specific dimension.
Creates an initial series type for a specific chart. Called whenever a list of series types is pre-populated within the user interface. In most cases, implementing this method only requires calling the create( ) method of the series implementation class, such as RadarSeriesImpl.create( ).
• canCombine( )
Determines if a chart type can be combined with another chart type, such as a Bar-and-Line combination chart.
Before implementing this extension point, create a 16 × 16 pixel GIF icon to represent the chart in the first chart builder tab. In addition, create a 71 × 71 pixel GIF icon for each subtype of the new chart type. Note that you should have at least one 71 × 71 image for the default chart subtype.
This example implements three subtypes. Each subtype determines what type of background to render, currently a circular and polygon non-filled background, and a circular-filled background.
To include the images in the workspace, create an icons directory in the plug-in and import the images to this directory. Open the build tab on the Plug-in Manifest Editor and select the icons checkbox to include this new directory in the build, as shown in Figure 23-17.
Figure 23-17 Adding an icons directory to the workspace

Next add the org.eclipse.birt.chart.ui.types extension to the plugin.xml. The example adds the following extension to the org.eclipse.birt.chart.examples plug-in, as shown in the following code:
<extension
id="ChartWizardContext"
name="Chart example types"
point="org.eclipse.birt.chart.ui.types">
<chartType
classDefinition=
"org.eclipse.birt.chart.examples.radar.ui.type
.RadarChart"
name="Radar Chart"/>
</extension>
Use ChartWizardContext as the identifier. The chart builder uses the identifier to display which chart types are supported. Under the chartType element, the classDefinition attribute specifies the class that implements the IChartType interface. The class org.eclipse.birt.chart.examples.ui.type.RadarChart implements the IChartType interface by extending the DefaultChartTypeImpl class.
Select Dependencies. Then, add the following dependencies to your plug-in:
• org.eclipse.birt.chart.engine.extension
• org.eclipse.birt.chart.ui
• org.eclipse.birt.chart.ui.extension
• com.ibm.icu
Figure 23-18 shows these dependencies.
Figure 23-18 Adding dependencies to the plug-in

In the radar chart example, com.ibm.icu is in a dependent plug-in and does not show in this image.
Create the class and package that you specified in the classDefinition attribute of the extension point. The radar chart uses org.eclipse.birt.chart.ui.examples.radar.ui.type package and a class named RadarChart:
public RadarChart( )
{
chartTitle =
Messages.getString( "RadarChart.Txt.DefaultRadarChartTitle" );
}
See the source-code example for a complete listing of the RadarChart class.
The constructor for this class sets the title for the chart. The getImage( ) method reads the 16×16 pixel icon image into an org.eclispe.swt.graphics. Image variable, which returns the value when the framework calls the getImage( ) method, as shown in the following code:
public Image getImage( )
{
return UIHelper.getImage( "icons/obj16/Radar16.gif" );
}
The getName( ) and getDisplayName( ) methods return the strings Radar Chart and Radar Series respectively, as shown in the following code:
public String getName( )
{
return Radar.TYPE_LITERAL;
}
public String getDisplayName( )
{
return Messages.getString( "RadarChart.Txt.DisplayName" );
}
The getChartSubtypes( ) method creates a collection of sub-chart types. For each subtype of the chart, instantiate an instance of the DefaultChartSubTypeImpl class, passing the chart type name, the image read from the icons directory, a description, and a display name, as shown in Listing 23-3.
Listing 23-3 getChartSubtypes( ) method
public Collection<IChartSubType> getChartSubtypes( String
sDimension,
Orientation orientation )
{
Vector<IChartSubType> vSubTypes = new Vector<IChartSubType>( );
// Do not respond to requests for unknown orientations
if ( !orientation.equals( Orientation.VERTICAL_LITERAL ) )
{
return vSubTypes;
}
if ( sDimension.equals( TWO_DIMENSION_TYPE )
||
sDimension.equals( ChartDimension.TWO_DIMENSIONAL_LITERAL
.getName( ) ) )
{
vSubTypes.add( new
DefaultChartSubTypeImpl( Radar.STANDARD_SUBTYPE_LITERAL,
UIHelper.getImage( "icons/wizban/Radar71.gif" ),
sStandardDescription,
Messages.getString( "RadarChart.SubType.Standard" ) ) );
vSubTypes.add( new
DefaultChartSubTypeImpl( Radar.SPIDER_SUBTYPE_LITERAL,
UIHelper.getImage( "icons/wizban/spiderweb.gif" ),
sSpiderDescription,
Messages.getString( "RadarChart.SubType.Spider" ) ) );
vSubTypes.add( new
DefaultChartSubTypeImpl( Radar.BULLSEYE_SUBTYPE_LITERAL,
UIHelper.getImage( "icons/wizban/bullseye.gif" ),
sBullseyeDescription,
Messages.getString( "RadarChart.SubType.Bullseye" ) ) );
}
return vSubTypes;
}
The getModel( ) method converts an existing chart model to a Radar Chart or creates a new one if the wizard has not yet created one. As stated earlier, this method is called by the chart builder when constructing a new chart or converting an existing one, as shown in Listing 23-4.
Listing 23-4 getModel( ) method
public Chart getModel( String sSubType, Orientation orientation,
String sDimension, Chart currentChart )
{
ChartWithoutAxes newChart = null;
if ( currentChart != null )
{
newChart = (ChartWithoutAxes)
getConvertedChart( currentChart,
sSubType,
sDimension );
if ( newChart != null )
{
return newChart;
}
}
newChart = ChartWithoutAxesImpl.create( );
newChart.setType( Radar.TYPE_LITERAL );
newChart.setSubType( sSubType );
newChart.setDimension( getDimensionFor( sDimension ) );
newChart.setUnits( "Points" );
if ( newChart.getDimension( ).equals(
ChartDimension.TWO_DIMENSIONAL_WITH_DEPTH_LITERAL ) )
{
newChart.setSeriesThickness( 15 );
}
newChart.getLegend( ).setItemType( LegendItemType
.SERIES_LITERAL );
SeriesDefinition sdX = SeriesDefinitionImpl.create( );
sdX.getSeriesPalette( ).shift( 0 );
Series categorySeries = SeriesImpl.create( );
sdX.getSeries( ).add( categorySeries );
sdX.getQuery( ).setDefinition( "Base Series" );
newChart.getTitle( )
.getLabel( )
.getCaption( )
.setValue( getDefaultTitle( ) );
SeriesDefinition sdY = SeriesDefinitionImpl.create( );
sdY.setZOrder( 1 );
sdY.getSeriesPalette( ).shift( 0 );
RadarSeries valueSeries = RadarSeriesImpl.create( );
LineAttributes lia =
LineAttributesImpl.create( ColorDefinitionImpl.GREY( ),
LineStyle.SOLID_LITERAL,
1 );
valueSeries.setWebLineAttributes( lia );
valueSeries.getLabel( ).setVisible( true );
valueSeries.setSeriesIdentifier( "Series 1" );
sdY.getSeries( ).add( valueSeries );
sdX.getSeriesDefinitions( ).add( sdY );
newChart.getSeriesDefinitions( ).add( sdX );
addSampleData( newChart );
return newChart;
}
The private getConvertedChart( ) method is called by getModel( ) in the chart builder when switching between chart types, allowing changes to the model to be preserved during a design session. Most of the code in this method focuses on copying element values for one type of chart to another, as shown in Listing 23-5.
Listing 23-5 getConvertedChart( ) method
private Chart getConvertedChart( Chart currentChart, String
sNewSubType,
String sNewDimension )
{
Chart helperModel = (Chart) EcoreUtil.copy( currentChart );
helperModel.eAdapters( ).addAll( currentChart.eAdapters( ) );
// Cache series to keep attributes during conversion
ChartCacheManager.getInstance( )
.cacheSeries( ChartUIUtil.getAllOrthogonalSeriesDefinitions(
helperModel ) );
if ( currentChart instanceof ChartWithAxes )
{
if ( !ChartPreviewPainter.isLivePreviewActive( ) )
{
helperModel.setSampleData( getConvertedSampleData(
helperModel.getSampleData( ),
( ( (ChartWithAxes) currentChart ).getAxes( )
.get( 0 ) ).getType( ),
AxisType.LINEAR_LITERAL ) );
}
// Create a new instance of the correct type
and set initial properties
currentChart = ChartWithoutAxesImpl.create( );
currentChart.setType( Radar.TYPE_LITERAL );
currentChart.setSubType( sNewSubType );
currentChart.setDimension( getDimensionFor(
sNewDimension ) );
// Copy generic chart properties from the old chart
currentChart.setBlock( helperModel.getBlock( ) );
currentChart.setDescription( helperModel
.getDescription( ) );
currentChart.setGridColumnCount( helperModel
.getGridColumnCount( ) );
if ( helperModel.getInteractivity( ) != null )
{
currentChart.getInteractivity( )
.setEnable( helperModel.getInteractivity( )
.isEnable( ) );
currentChart.getInteractivity( )
.setLegendBehavior( helperModel.getInteractivity( )
.getLegendBehavior( ) );
}
currentChart.setSampleData( helperModel.getSampleData( ) );
currentChart.setScript( helperModel.getScript( ) );
currentChart.setUnits( helperModel.getUnits( ) );
if ( helperModel.getGridColumnCount( ) > 0 )
{
currentChart.setGridColumnCount( helperModel
.getGridColumnCount( ) );
}
else
{
currentChart.setGridColumnCount( 1 );
}
// Copy series definitions from old chart
( (ChartWithoutAxes) currentChart ).getSeriesDefinitions( )
.add( ( ( (ChartWithAxes) helperModel ).getAxes( )
.get( 0 ) ).getSeriesDefinitions( ).get( 0 ) );
Vector<SeriesDefinition> vOSD =
new Vector<SeriesDefinition>( );
// Only convert series in primary orthogonal axis.
Axis primaryOrthogonalAxis =
( (ChartWithAxes) helperModel ).getAxes( )
.get( 0 ).getAssociatedAxes( ).get( 0 );
EList<SeriesDefinition> osd =
primaryOrthogonalAxis.getSeriesDefinitions( );
for ( int j = 0; j < osd.size( ); j++ )
{
SeriesDefinition sd = osd.get( j );
Series series = sd.getDesignTimeSeries( );
sd.getSeries( ).clear( );
sd.getSeries( ).add( getConvertedSeries( series, j ) );
vOSD.add( sd );
}
( ( (ChartWithoutAxes)currentChart )
.getSeriesDefinitions( ).get( 0 ) )
.getSeriesDefinitions( ).clear( );
( ( (ChartWithoutAxes)currentChart )
.getSeriesDefinitions( )
.get( 0 ) ).getSeriesDefinitions( ).addAll( vOSD );
currentChart.getLegend( )
.setItemType( LegendItemType.SERIES_LITERAL );
currentChart.getTitle( )
.getLabel( ).getCaption( )
.setValue( getDefaultTitle( ) );
}
else if ( currentChart instanceof ChartWithoutAxes )
{
if ( currentChart.getType( ).equals( Radar.TYPE_LITERAL ) )
{
currentChart.setSubType( sNewSubType );
if ( !currentChart.getDimension( )
.equals( getDimensionFor( sNewDimension ) ) )
{
currentChart.setDimension(
getDimensionFor( sNewDimension ) );
}
}
else
{
// Create a new instance of the correct type
and set initial
// properties
currentChart = ChartWithoutAxesImpl.create( );
currentChart.setType( Radar.TYPE_LITERAL );
currentChart.setSubType( sNewSubType );
currentChart.setDimension(
getDimensionFor( sNewDimension ) );
// Copy generic chart properties from the old chart
currentChart.setBlock( helperModel.getBlock( ) );
currentChart.setDescription(
helperModel.getDescription( ) );
currentChart.setGridColumnCount( helperModel
.getGridColumnCount( ) );
currentChart.setSampleData(
helperModel.getSampleData( ) );
currentChart.setScript( helperModel.getScript( ) );
currentChart.setUnits( helperModel.getUnits( ) );
if ( helperModel.getInteractivity( ) != null )
{
currentChart.getInteractivity( )
.setEnable( helperModel.getInteractivity( )
.isEnable( ) );
currentChart.getInteractivity( )
.setLegendBehavior( helperModel.getInteractivity( )
.getLegendBehavior( ) );
}
// Clear existing series definitions
( (ChartWithoutAxes)
currentChart ).getSeriesDefinitions( ).clear( );
// Copy series definitions
( (ChartWithoutAxes)
currentChart ).getSeriesDefinitions( )
.add( ( (ChartWithoutAxes)helperModel )
.getSeriesDefinitions( ).get( 0 ) );
// Update the series
EList<SeriesDefinition> seriesdefinitions =
( ( (ChartWithoutAxes) currentChart )
.getSeriesDefinitions( ).get( 0 ) )
.getSeriesDefinitions( );
for ( int j = 0; j < seriesdefinitions.size( ); j++ )
{
Series series = seriesdefinitions.get( j )
.getDesignTimeSeries( );
series = getConvertedSeries( series, j );
// Clear any existing series
seriesdefinitions.get( j ).getSeries( ).clear( );
// Add the new series
seriesdefinitions.get( j ).getSeries( ).add( series );
}
currentChart.getLegend( )
.setItemType( LegendItemType.SERIES_LITERAL );
currentChart.getTitle( )
.getLabel( )
.getCaption( )
.setValue( getDefaultTitle( ) );
}
}
else
{
return null;
}
return currentChart;
}
The private method getConvertedSeries( ) is called by the getConvertedModel( ) method to preserve series changes between model changes, for example, customizing a line chart, changing it to a bar chart, then changing it back again to a line chart.
Without these methods, the series has to be created again for every change, as shown in the following code:
private Series getConvertedSeries( Series series, int
seriesIndex )
{
// Do not convert base series
if ( series.getClass( ).getName( ).equals( SeriesImpl
.class.getName( ) ) )
{
return series;
}
RadarSeries radarseries = (RadarSeries)
ChartCacheManager.getInstance( )
.findSeries( RadarSeriesImpl.class.getName( ),
seriesIndex );
if ( radarseries == null )
{
radarseries = RadarSeriesImpl.create( );
}
// Copy generic series properties
ChartUIUtil.copyGeneralSeriesAttributes( series, radarseries );
return radarseries;
}
The private method addSampleData( ) is called by getModel( ) to provide sample data for the chart. This sample data displays a chart for review until real data is selected. To display the chart using real data instead of sample data, enable the chart live preview preference. The chart builder enables the live preview preference by default.
private void addSampleData( Chart newChart )
{
SampleData sd = DataFactory.eINSTANCE.createSampleData( );
sd.getBaseSampleData( ).clear( );
sd.getOrthogonalSampleData( ).clear( );
// Create Base Sample Data
BaseSampleData sdBase =
DataFactory.eINSTANCE.createBaseSampleData( );
sdBase.setDataSetRepresentation( "A, B, C, D" );
sd.getBaseSampleData( ).add( sdBase );
// Create Orthogonal Sample Data (with simulation count of 2)
OrthogonalSampleData oSample =
DataFactory.eINSTANCE.createOrthogonalSampleData( );
oSample.setDataSetRepresentation( "5, 4, 12, 16" );
oSample.setSeriesDefinitionIndex( 0 );
sd.getOrthogonalSampleData( ).add( oSample );
newChart.setSampleData( sd );
}
The getSupportedDimensions( ) method determines how many possible dimension choices a specific chart type supports. This example supports only two dimensions.
The wizard calls the getDefaultDimension( ) method when first populating the dimension choices for a specific chart type or when first creating a working model of the specific chart type. Whenever switching between chart types, use the getModel( ) method to call the getDimensionFor( ) private method. This method uses the current dimension of the previously selected chart.
In the process, the chart type automatically specifies a dimension based on the current working session. For example, when a 3D bar chart is created and the user changes the type to an area chart, the new chart also becomes 3D. In the example, the chart dimension is set to 2D to override any dimension passed to the method since the example supports only 2D, as shown in the following code:
private static final String[ ] saDimensions = new String[ ]{
TWO_DIMENSION_TYPE
};
public String[ ] getSupportedDimensions( )
{
return saDimensions;
}
public String getDefaultDimension( )
{
return saDimensions[0];
}
private ChartDimension getDimensionFor( String sDimension )
{
return ChartDimension.TWO_DIMENSIONAL_LITERAL;
}
The getBaseUI( ) method sets up the base series user interface in the chart builder to attach the data to the chart. In the example, an instance of the DefaultBaseSeriesComponent( ) constructs the user interface. Currently, all chart types use the default. Figure 23-19 shows the portion of the user interface handled by this method.
Figure 23-19 Building the user interface for the category series
![]()
This user interface must be shared across the defined value series. For example, a combination chart that uses a Bar series and a Line series must use the same category series, as shown in the following code:
public ISelectDataComponent getBaseUI( Chart chart,
ISelectDataCustomizeUI selectDataUI, ChartWizardContext
context,String sTitle )
{
DefaultBaseSeriesComponent component =
new DefaultBaseSeriesComponent( ChartUIUtil
.getBaseSeriesDefinitions( chart ).get( 0 ),context,
sTitle );
component.setLabelText( Messages.getString(
"RadarBaseSeriesComponent.Label.CategoryDefinition" ) );
component.setTooltipWhenBlank( Messages.getString(
"RadarChart.Tooltip.InputExpression" ) );
return component;
}
// Copy generic series properties
ChartUIUtil.copyGeneralSeriesAttributes(series, radarseries);
return radarseries;
}
The getSeries( ) method instantiates a RadarSeriesImpl object using the create( ) method described earlier, as shown in the following code:
public Series getSeries( )
{
return (RadarSeries) RadarSeriesImpl.create( );
}
Series composite extension point
The series composite extension point constructs custom user interface elements for use in the chart builder. The series composite element for this extension point has two attributes, seriesType and seriesUIProvider. The seriesType attribute specifies the composite type. The seriesUIProvider attribute specifies the class that implements the ISeriesUIProvider interface. This extension point is implemented in the second and third tabs of the chart builder.
The ISeriesUIProvider interface has the following methods:
• getSeriesAttributeSheet( )
Constructs the composite used to manipulate the series properties.
• getSeriesDataComponent( )
Builds elements that appear in chart builder by returning user interface items for the value series and the optional value series grouping.
• getSeriesClass( )
Returns the series class for which the ISeriesUIProvider is implemented.
• validateSeriesBindingType( )
Verifies that series has the proper data type. For example, text values are not allowed for value types in some chart types.
• isValidAggregationType( )
Determines if a particular aggregate function is acceptable for a series.
Functions similar to the validateSeriesBindingType( ) method. Currently, the only chart that implements this method is the Gantt chart, which supports only First, Last, Min, and Max aggregates.
• getCompatibleAxisType( )
Called for Charts that contain axes. Determines if a specific axis type is supported for a value series. For example, a Gantt chart supports only date-time values for an orthogonal axis. A Bar chart supports logarithmic, linear, or date time values.
• validationIndex( )
Provides the framework with information about the number of data definitions that must have values for a particular series type. For example, a Bar chart requires only one value in a query definition while a stock chart requires four values.
The chart engine provides an extensible class, DefaultSeriesUIProvider, that provides a default implementation for most methods. The example extends this class by adding the following specification to plugin.xml:
<extension point="org.eclipse.birt.chart.ui.seriescomposites">
<seriescomposite
seriesUIProvider=
"org.eclipse.birt.chart.examples.radar.ui.series
.RadarSeriesUIProvider"
seriesType=
"org.eclipse.birt.chart.examples.radar.model.type
.impl.RadarSeriesImpl"/>
</extension>
To implement the class, create the class and package specified in the seriesUI Provider attribute. The radar example uses the org.eclipse.birt.chart.examples.radar.ui.series package and the class, RadarSeriesUIProvider. See the source-code example for a complete listing of the RadarSeriesUIProvider class. Extend this class from the DefaultSeriesUIProvider class. The getSeries Class( ) method returns the RadarSeriesImpl class name, as shown in the following code:
private static final String SERIES_CLASS =
RadarSeriesImpl.class.getName( );
public String getSeriesClass( )
{
return SERIES_CLASS;
}
The getSeriesDataComponent( ) method constructs parts of the data select tab in chart builder. The radar example uses the code shown in Listing 23-6.
Listing 23-6 getSeriesDataComponent( ) method
public ISelectDataComponent getSeriesDataComponent(
int seriesType,SeriesDefinition seriesDefn,
ChartWizardContext context, String sTitle )
{
if ( seriesType == ISelectDataCustomizeUI.ORTHOGONAL_SERIES )
{
return new BaseDataDefinitionComponent(
BaseDataDefinitionComponent.BUTTON_AGGREGATION,sTitle,
seriesDefn,ChartUIUtil.getDataQuery( seriesDefn, 0 ),
context, sTitle );
}
else if ( seriesType ==
ISelectDataCustomizeUI.GROUPING_SERIES )
{
BaseDataDefinitionComponent ddc =
new YOptionalDataDefinitionComponent(
BaseDataDefinitionComponent.BUTTON_GROUP,
ChartUIConstants.QUERY_OPTIONAL,seriesDefn,
seriesDefn.getQuery( ),context,sTitle );
return ddc;
}
return new DefaultSelectDataComponent( );
}
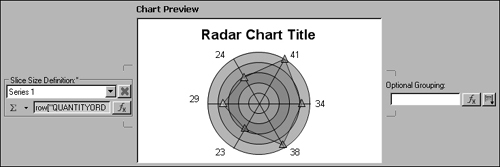
The getSeriesDataComponent( ) method is called for the orthogonal series and the optional grouping user interface portions, as shown in Figure 23-20.
Figure 23-20 Building the user interface for value series and optional grouping
The radar chart cannot use text or date time values for an orthogonal series. The validateSeriesBindingType( ) method verifies that the value series data is a numeric type, as shown in Listing 23-7.
Listing 23-7 validateSeriesBindingType( ) method
public void validateSeriesBindingType( Series series,
IDataServiceProvider idsp ) throws ChartException
{
Iterator<Query> iterEntries =
series.getDataDefinition( ).iterator( );
while ( iterEntries.hasNext( ) )
{
Query query = iterEntries.next( );
DataType dataType =
idsp.getDataType( query.getDefinition( ) );
if ( dataType == DataType.TEXT_LITERAL
|| dataType == DataType.DATE_TIME_LITERAL )
{
throw new ChartException( ChartUIExtensionPlugin.ID,
ChartException.DATA_BINDING,
query.getDefinition( ) );
}
}
}
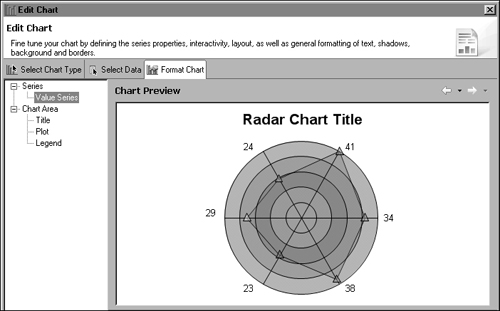
The getSeriesAttributeSheet method returns an SWT Composite to configure the series in Format Chart in the chart builder. When constructing the user interface, the framework calls this specification for a series, as shown in Figure 23-21.
Figure 23-21 Building the user interface for the Value Series

In this example, a new class, RadarSeriesAttributeComposite, performs the actual composite building.
public Composite getSeriesAttributeSheet( Composite parent,
Series series, ChartWizardContext context )
{
return new RadarSeriesAttributeComposite( parent,
SWT.NONE,
context,
series );
}
Add a new class to the package to implement the composite. The radar chart example uses the RadarSeriesAttributeComposite class. This class must extend the org.eclipse.swt.widgets.Composite class and implement the SelectionListener and Listener interfaces from that package, as shown in the following code:
public class RadarSeriesAttributeComposite extends Composite
implements SelectionListener, Listener
The constructor for this class verifies the correct series type for the composite and sets the chart model and chart builder context. The call to init( ) sets the height and width for the composite based on the parent container, as shown in Listing 23-8.
Listing 23-8 RadarSeriesAttributeComposite( ) constructor
public RadarSeriesAttributeComposite( Composite parent, int style,
ChartWizardContext context, Series series )
{
super( parent, style );
if ( !( series instanceof RadarSeriesImpl ) )
{
try
{
throw new ChartException( ChartUIExtensionPlugin.ID,
ChartException.VALIDATION,
RadarSeriesAttributeComposite.Exception
.IllegalArgument,
new Object[ ]{series.getClass( ).getName( )},
Messages.getResourceBundle( ) );
}
catch ( ChartException e )
{
logger.log( e );
e.printStackTrace( );
}
}
this.series = (RadarSeries) series;
this.context = context;
this.chart =
(ChartWithoutAxes) context.getModel( );
init( );
placeComponents( );
ChartUIUtil.bindHelp( parent,
ChartHelpContextIds.SUBTASK_YSERIES_LINE );
}
private void init( )
{
this.setSize( getParent( ).getClientArea( ).width,
getParent( ).getClientArea( ).height );
}
...
The final call in the constructor is placeComponents( ) method, which creates the user interface. Each Radar Series contains line-attribute definitions, which are defined earlier for actual values as well as the background web radar. This example uses only the first series definition to determine how the web-radar background looks.
Before building the complete composite, the implementation checks to see if the series is the first or a subsequent series.Figure 23-22 shows the details of the chart line GUI construction.
Figure 23-22 Building the user interface for the chart line

This portion of the user interface controls the background grid of the chart and is only visible when selecting the first series. The user interface has the standard line attributes to control the web-radar line. The user interface also contains a spinner element to set the number of scale steps in the background, a check box that shows a percentage label at each step, and a check box to determine whether the background color of a bull’s-eye radar element is translucent. The rendering process uses these values. The chart uses values from the EMF model.
The code in Listing 23-9 shows how the radar chart example implements the placeComponents( ) method:
Listing 23-9 placeComponents( ) method
private void placeComponents( )
{
boolean show_web_attributes = false;
RadarSeries rsd = (RadarSeries) chart.getSeriesDefinitions( )
.get( 0 ).getSeriesDefinitions( ).get( 0 )
.getDesignTimeSeries( );
if ( rsd.equals( this.series ) )
{
// SeriesIdentifier is not unique
if( firstSeries.equals(
this.series.getSeriesIdentifier() ) )
{
show_web_attributes = true;
}
// Main content composite
this.setLayout( new GridLayout( ) );
if ( show_web_attributes )
{
grpLine = new Group( this, SWT.NONE );
GridLayout glLine = new GridLayout( 3, false );
grpLine.setLayout( glLine );
grpLine.setLayoutData(
new GridData( GridData.FILL_BOTH ) );
grpLine.setText( Messages.getString(
"RadarSeriesMarkerSheet.Label.Web" ) );
wliacLine = new LineAttributesComposite( grpLine,
SWT.NONE,
context,
series.getWebLineAttributes( ),
true,
true,
true );
GridData wgdLIACLine = new GridData( );
wgdLIACLine.widthHint = 200;
wgdLIACLine.verticalSpan = 3;
wliacLine.setLayoutData( wgdLIACLine );
wliacLine.addListener( this );
lblWebStep = new Label( grpLine, SWT.NONE );
{
lblWebStep.setText( Messages.getString(
"Radar.Composite.Label.ScaleCount" ) );
lblWebStep.setToolTipText( Messages.getString(
"Radar.Composite.Label.ScaleCountToolTip" ) );
}
iscScaleCnt = new Spinner( grpLine, SWT.BORDER );
GridData gdISCLeaderLength = new GridData( );
gdISCLeaderLength.widthHint = 100;
iscScaleCnt.setLayoutData( gdISCLeaderLength );
iscScaleCnt.setMinimum( 1 );
iscScaleCnt.setMaximum( MAX_STEPS );
iscScaleCnt.setSelection(
series.getPlotSteps( ).intValue( ) );
iscScaleCnt.addSelectionListener( this );
btnWebLabels = new Button( grpLine, SWT.CHECK );
{
btnWebLabels.setText(
Messages.getString(
"RadarSeriesAttributeComposite.Lbl.ShowWeb" ) );
btnWebLabels.setSelection( series.isShowWebLabels( ) );
btnWebLabels.addSelectionListener( this );
GridData gd = new GridData( GridData.FILL_HORIZONTAL );
gd.horizontalSpan = 2;
btnWebLabels.setLayoutData( gd );
}
btnTranslucentBullseye = new Button( grpLine, SWT.CHECK );
{
btnTranslucentBullseye.setText(
Messages.getString(
"Radar.Composite.Label.bullsEye" ) );
btnTranslucentBullseye.setSelection(
series.isBackgroundOvalTransparent( ) );
btnTranslucentBullseye.addSelectionListener( this );
GridData gd = new GridData( GridData.FILL_HORIZONTAL );
gd.horizontalSpan = 2;
gd.verticalAlignment = SWT.TOP;
btnTranslucentBullseye.setLayoutData( gd );
btnTranslucentBullseye.setVisible(
chart.getSubType( ).equals(
Radar.BULLSEYE_SUBTYPE_LITERAL ) );
}
}
grpLine2 = new Group( this, SWT.NONE );
GridLayout glLine2 = new GridLayout( 2, false );
glLine2.horizontalSpacing = 0;
grpLine2.setLayout( glLine2 );
grpLine2.setLayoutData( new GridData( GridData.FILL_BOTH ) );
grpLine2.setText( Messages.getString(
"RadarSeriesMarkerSheet.Label.Series" ) );
liacLine =
new LineAttributesComposite( grpLine2,
SWT.NONE,
context,
series.getLineAttributes( ),
true,
true,
true );
GridData gdLIACLine = new GridData( );
gdLIACLine.verticalSpan = 4;
gdLIACLine.widthHint = 200;
liacLine.setLayoutData( gdLIACLine );
liacLine.addListener( this );
Composite cmp = new Composite( grpLine2, SWT.NONE );
cmp.setLayoutData( new GridData( GridData.FILL_BOTH ) );
cmp.setLayout( new GridLayout( ) );
btnPalette = new Button( cmp, SWT.CHECK );
{
btnPalette.setText( Messages.getString(
"RadarSeriesAttributeComposite.Lbl.LinePalette" ) );
btnPalette.setSelection( series.isPaletteLineColor( ) );
btnPalette.addSelectionListener( this );
}
btnConnectEndPoints = new Button( cmp, SWT.CHECK );
{
btnConnectEndPoints.setText(
Messages.getString(
"RadarSeriesAttributeComposite.Lbl.ConnectPoints" ) );
btnConnectEndPoints.setSelection(
series.isConnectEndpoints( ) );
btnConnectEndPoints.addSelectionListener( this );
}
btnFillPoly = new Button( cmp, SWT.CHECK );
{
btnFillPoly.setText(
Messages.getString(
"RadarSeriesAttributeComposite.Lbl.FillPoly" ) );
btnFillPoly.setSelection( series.isFillPolys( ) );
btnFillPoly.addSelectionListener( this );
btnFillPoly.setEnabled( btnConnectEndPoints.getSelection( ) );
}
Group grpMarker = new Group( cmp, SWT.NONE );
grpMarker.setText( Messages.getString(
"RadarSeriesMarkerSheet.GroupLabel.Markers" ) );
grpMarker.setLayout( new GridLayout( 2, false ) );
// Layout for marker
Label lblMarker = new Label( grpMarker, SWT.NONE );
lblMarker.setText( Messages.getString(
"RadarSeriesMarkerSheet.Label.Markers" ) );
mec = new MarkerEditorComposite( grpMarker,
series.getMarker( ) );
enableLineSettings( series.getWebLineAttributes( )
.isVisible( ) );
enableLineSettings( series.getLineAttributes( ).isVisible( ) );
}
The place components method in the previous code also populates the user interface with the specific series values, as shown in Figure 23-23. If the series is the first series on the radar, the user interface portion is placed below the radar-web user interface.
Figure 23-23 Building the series line user interface

The standard line attributes user interface configures the actual line attributes of the radar series. In addition, a check box determines if the series palette color can be used as the line color for the radar. A fill polygons check box determines if the radar series must be filled. A connect data set endpoints check box determines if the first and last data point are connected, which creates a polygon. In addition, a configuration drop-down box can select a specific marker. Note that user interface items are pre-populated with values from the current working model.
The widgetSelected( ) method in this class handles changes to the check boxes and the spinner. This method alters the current series model with the values selected in the user interface, as shown in Listing 23-10.
Listing 23-10 widgetSelected( ) method
public void widgetSelected( SelectionEvent e )
{
if ( e.getSource( ).equals( btnPalette ) )
{
series.setPaletteLineColor( btnPalette.getSelection( ) );
}
else if ( e.getSource( ).equals( btnFillPoly ) )
{
series.setFillPolys( btnFillPoly.getSelection( ) );
}
else if ( e.getSource( ).equals( btnConnectEndPoints ) )
{
series.setConnectEndpoints( btnConnectEndPoints.getSelection( )
);
btnFillPoly.setEnabled( btnConnectEndPoints.getSelection( ) );
}
else if ( e.getSource( ).equals( btnTranslucentBullseye ) )
{
series.setBackgroundOvalTransparent( btnTranslucentBullseye.get
Selection( ) );
}
else if ( e.getSource( ).equals( mec ) )
{
series.setMarker( mec.getMarker( ) );
}
else if ( e.getSource( ).equals( iscScaleCnt ) )
{
series.setPlotSteps( BigInteger.valueOf( iscScaleCnt.getSelecti
on( ) ) );
}
else if ( e.getSource( ).equals( btnWebLabels ) )
{
series.setShowWebLabels( btnWebLabels.getSelection( ) );
}
}
The handleEvent( ) method tracks changes when the series line attributes are altered or when the radar-web background line attributes are changed. As with the widgetSelected( ) method, this method alters the current working radar series model, as shown in Listing 23-11.
Listing 23-11 handleEvent( ) method
public void handleEvent( Event event )
{
if ( event.widget.equals( liacLine ) )
{
if ( event.type ==
LineAttributesComposite.VISIBILITY_CHANGED_EVENT )
{
series.getLineAttributes( )
.setVisible( ( (Boolean)
event.data ).booleanValue( ) );
enableLineSettings( series.getLineAttributes( ).isVisible( ) );
}
else if ( event.type ==
LineAttributesComposite.STYLE_CHANGED_EVENT )
{
series.getLineAttributes( ).setStyle(
(LineStyle) event.data );
}
else if ( event.type ==
LineAttributesComposite.WIDTH_CHANGED_EVENT )
{
series.getLineAttributes( )
.setThickness( ( (Integer)
event.data ).intValue( ) );
}
else if ( event.type ==
LineAttributesComposite.COLOR_CHANGED_EVENT )
{
series.getLineAttributes( )
.setColor( (ColorDefinition) event.data );
}
}
else if ( event.widget.equals( wliacLine ) )
{
if ( event.type ==
LineAttributesComposite.VISIBILITY_CHANGED_EVENT )
{
series.getWebLineAttributes( )
.setVisible( ( (Boolean)
event.data ).booleanValue( ) );
enableLineSettings( series.getWebLineAttributes( )
.isVisible( ) );
}
else if ( event.type ==
LineAttributesComposite.STYLE_CHANGED_EVENT )
{
series.getWebLineAttributes( )
.setStyle( (LineStyle) event.data );
}
else if ( event.type ==
LineAttributesComposite.WIDTH_CHANGED_EVENT )
{
series.getWebLineAttributes( )
.setThickness( ( (Integer)
event.data ).intValue( ) );
}
else if ( event.type ==
LineAttributesComposite.COLOR_CHANGED_EVENT )
{
series.getWebLineAttributes( )
.setColor( (ColorDefinition) event.data );
}
}
}
The enableLineSettings( ) method disables or enables the series palette as line color check box. If the line series configuration user interface is not visible, the default behavior is to use the series palette as the line color and the check box is disabled. If the line series configuration user interface is visible, the check box is enabled.
private void enableLineSettings( boolean isEnabled )
{
if ( btnPalette != null )
{
btnPalette.setEnabled( isEnabled );
}
}
Run-time Plug-in extensions
The run-time extensions should be implemented in the plug-in that extends the chart model described in the first part of this chapter. In the radar example, these extension points are implemented in the org.eclipse.birt.chart.examples.core plug-in. The following sections discuss each of the extension points, org.eclipse.birt.chart.engine.modelrenerers, org.eclipse.birt.chart.engine.datasetprocessors, and org.eclipse.birt.chart.engine.charttypes.
Chart model types extension point
The chart engine framework uses the charttypes extension point to load the custom model. This example implements this extension point with the RadarModelLoader class located in the org.eclipse.birt.chart.examples.radar.model package. This class has only one method which creates an instance of the RadarTypePackage.
public class RadarModelLoader implements IExtChartModelLoader
{
public EPackage getChartTypePackage( )
{
return RadarTypePackage.eINSTANCE;
}
}
The plugin.xml snippet for the extension point is shown below:
<extension
point="org.eclipse.birt.chart.engine.charttypes">
<chartType
modelLoader=
"org.eclipse.birt.chart.examples.radar.model
.RadarModelLoader"
namespaceURI=
"http://www.birt.eclipse.org/RadarChartModelType"
</chartType>
</extension>
Data processor extension point
The data set processors extension point supports setting up a processor class to handle row navigation and population of data sets for a chart series. This example requires only the default data set processor, because there are only two values per data point.
To specify the default data set processor, open plugin.xml and add the following code:
<extension
point="org.eclipse.birt.chart.engine.datasetprocessors">
<datasetProcessor
processor=
"org.eclipse.birt.chart.extension.datafeed
.DataSetProcessorImpl"
series=
"org.eclipse.birt.chart.examples.radar.model.type.impl
.RadarSeriesImpl"/>
</extension>
Model Renderer Extension Point
The model renderer extension point is the final extension point in this example. This extension point renders a series. All the previous processing creates and modifies the series model. This extension point focuses on the actual mechanics of drawing the series.
All model renderers must extend from one of two abstract classes, AxesRenderer or BaseRenderer. When a series renderer does not require axes or the axes are drawn in the series renderer, extend the BaseRenderer class. If the model renderer requires axes and needs the framework to generate these axes, extend AxesRenderer.
In a radar-web chart, the axes render in a radial fashion, which the AxesRenderer class currently does not handle, so this example extends the BaseRenderer class. The following code shows the plugin.xml snippet for this extension point:
<extension
point="org.eclipse.birt.chart.engine.modelrenderers">
<modelRenderer
renderer=
"org.eclipse.birt.chart.examples.radar.render.Radar"
series=
"org.eclipse.birt.chart.examples.radar.model.type.impl
.RadarSeriesImpl"/>
</extension>
The modelRenderer element has two attributes, series and renderer. The series attribute contains the series class used with the renderer. The renderer attribute declares the class that extends one of the renderer classes. Add this snippet to the plugin.xml and create the package and class specified in the renderer attribute. In the radar example, the Radar class located in the org.eclipse.bir.chart.examples.radar.render package is used and extends from the BaseRenderer class.
The BaseRenderer class implements the ISeriesRenderer interface, providing a set of convenience methods for use by a model renderer. The convenience methods are not discussed in this chapter. See the Javadoc for more details.
The ISeriesRenderer interface contains the following methods, which a series renderer must implement, since an implementation does not exist in the abstract BaseRenderer class:
• Compute( )
Called by the chart engine framework in the chart engine build( ) method just before returning the GenerateChartState object used for rendering the chart. This method gives the series renderer the opportunity to do pre-processing on the data to be rendered.
• renderLegendGraphic( )
Called when rendering the legend graphic. For example, rendering a legend line in a line chart using the specified series color and marker.
• renderSeries( )
Called by the framework for each series when rendering the series graphics for the series type.
Before discussing the actual implementation of these methods, this section provides a small primer about how the drawing framework for the chart engine works. All model renderers are passed an instance of an object that implements the IPrimitiveRenderer interface. This object renders the primitives by implementing the org.eclipse.birt.chart.engine.devicerenderers extension point.
The IPrimitiveRenderer interface describes methods such as drawCircle( ), drawRectangle( ), and fillOval( ). This approach insulates the model renderer from the underlying mechanics of writing the actual output for a chart. The new model renderers function in existing frameworks, such as BIRT, which use the chart engine.
Each of the primitive render methods requires a parameter that defines the object to draw. For example, drawing a line requires start and end points. This parameter object is an instance of an object that extends the abstract class, PrimitiveRenderEvent.
PrimitiveRenderEvent contains information used with all object types, such as the background color and line attributes, which the concrete classes must implement. Each primitive render method has an associated, specific class that extends the PrimitiveRenderEvent class.
Currently BIRT supplies device renderers for the SWT, Swing, BMP, JPG, PNG, SVG and PDF formats, as shown in Figure 23-24.
Figure 23-24 Implementing and extending device renderers

For example, the drawLine( ) method is passed a LineRenderEvent object. This class defines the start and end points for a line as well as properties like the line attributes. Refer to the Javadoc to find all the required methods to set for a particular render event object.
Assume that a model renderer is passed the ipr object, which is an instance of the SWTRendererImpl class that implements the IPrimitiveRenderer interface. A line can be drawn by first setting up a LineRenderEvent (myLre) event then calling ipr.drawLine(myLre).
To increase performance, the chart engine also uses an event object cache. This cache stores previously created RenderEvent objects for reuse and is encapsulated in the EventObjectCache class. The device renderer provides a convenience method to retrieve objects from the cache. If the event object does not exist in the cache, it is created, stored in the cache, and returned.
The method, getEventObject( ), takes two parameters, source and type. The source parameter identifies the part of the rendering framework from which the event originates. The type parameter specifies the class that implements the event.
To create the source parameter, BIRT provides the StructureSource class that has methods for creating the various framework sources. For example, when rendering the legend, the source parameter can be created using the StructureSource.createLegend( ) method. When rendering the series, the StructureSource.createSeries( ) method is used.
The source parameter is used by various aspects of the framework, such as interactivity functions. The StructureSource class is also extended by the WrappedStructureSource class, which provides details for a subcomponent of the StructureSource. For example, when rendering a data point, the WrappedStructureSource.createSeriesDataPoint( ) method is used, passing the series as well as the specific data point values for the source. See the Javadoc for StructureSource and WrappedStructureSource to find what specific sources can be created.
A line-render event in the renderLegendGraphic( ) method can be created, as shown in the following code:
final LineRenderEvent lre = (LineRenderEvent) ((EventObjectCache)
ipr).getEventObject(StructureSource.createLegend(lg),
LineRenderEvent.class);
The render event object can then be populated with the appropriate values and passed as a parameter to the drawLine( ) method of the primitive renderer object.
For a design-time series, many run-time series can be generated. For example, when the series are grouped, this situation often requires the copying or creation of new objects defined in the chart EMF model.
To assist in quickly creating these objects, BIRT provides a factory class GObjectFactory that provides creation and copy methods for portions of the chart model. To get access to the object factory, an instance method is provided. The following line is used in the example:
protected final static IGObjectFactory goFactory =
GObjectFactory.instance();
The chart engine also provides two utility classes that can be used by model renderers to control z-ordering within and between series. These classes are DeferredCache and DeferredCacheManager.
The DeferredCacheManager is set up during the render phase of chart creation and the one instance can be used by all model renders and the framework in many instances. This class is designed to manipulate one or more DeferredCached instances, allowing drawing events for one or more series to be cached and flushed at appropriate times.
A DeferredCache instance is created for each run-time series for 2D charts or one instance is used with 3D, 2D with depth, and 2D series that are specifically defined to only use one cache. The DeferredCache class provides utility methods to add rendering events to the cache, like addLine( ), addPlane( ), or addLabel( ). Where appropriate these methods allow passing in a z-order value.
The model renderer can call specific flush methods to draw the elements at specific times during processing. To simplify the radar chart example, the deferred cache mechanisms are not often used.
The first method implemented in the Radar class is the renderLegendGraphic( ) method. As stated earlier, this method is called anytime the legend is rendered. This method is called by the framework for every element that is rendered in the legend.
In the radar chart, render the marker used and optionally a line through the marker. First, verify the bounds that are passed to the method. The bounds object is the area for rendering the particular legend graphic.
Next, retrieve the current series by using a convenience method from the BaseRenderer class named getSeries. Use this method to retrieve the line attributes that are configured for the series.
If the line is visible, draw a line in the legend. To draw the line, a LineRenderEvent event is used, as described earlier. Once the event is created, set the line attributes, start and end points based on the bounds, then draw the line, as shown in Listing 23-12.
Listing 23-12 renderLegendGraphic( ) method
public void renderLegendGraphic( IPrimitiveRenderer ipr,
Legend lg,
Fill fPaletteEntry, Bounds bo ) throws ChartException
{
if ( ( bo.getWidth( ) == 0 ) && ( bo.getHeight( ) == 0 ) )
{
return;
}
final ClientArea ca = lg.getClientArea( );
final LineAttributes lia = ca.getOutline( );
final RadarSeries ls = (RadarSeries) getSeries( );
if ( fPaletteEntry == null )
{
fPaletteEntry = ColorDefinitionImpl.RED( );
}
final RectangleRenderEvent rre = ( (EventObjectCache)
ipr ).getEventObject( StructureSource.createLegend( lg ),
RectangleRenderEvent.class );
rre.setBackground( ca.getBackground( ) );
rre.setOutline( lia );
rre.setBounds( bo );
ipr.fillRectangle( rre );
LineAttributes liaMarker = ls.getLineAttributes( );
if ( !liaMarker.isSetVisible( ) )
{
throw new ChartException( ChartEngineExtensionPlugin.ID,
ChartException.RENDERING,
exception.unspecified.marker.linestyle.visibility,
Messages.getResourceBundle( getRunTimeContext( )
.getULocale( ) ) );
}
if ( liaMarker.isVisible( ) )
{
final LineRenderEvent lre =
( (EventObjectCache) ipr )
.getEventObject( StructureSource.createLegend( lg ),
LineRenderEvent.class );
if ( fPaletteEntry instanceof ColorDefinition &&
( ls.isSetPaletteLineColor( ) &&
ls.isPaletteLineColor( ) ) )
{
liaMarker = goFactory.copyOf( liaMarker );
liaMarker.setColor( goFactory.copyOf( FillUtil.getColor(
fPaletteEntry ) ) );
}
lre.setLineAttributes( liaMarker );
lre.setStart( LocationImpl.create( bo.getLeft( ) + 1,
bo.getTop( )#NAME?/ 2 ) );
lre.setEnd( LocationImpl.create( bo.getLeft( ) +
bo.getWidth( ) - 1,
bo.getTop( ) + bo.getHeight( ) / 2 ) );
ipr.drawLine( lre );
}
...
Next, the markers are rendered using a convenience method provided by the base renderer class that handles drawing markers. This method is named renderMarker( ) and is passed various values like the bounds, palette entry, and device renderer. The code for this continuing portion of the renderLegendGraphic( ) method is presented in Listing 23-13.
Listing 23-13 renderLegendGraphic( ) (continued)
SeriesDefinition sd = getSeriesDefinition( );
final boolean bPaletteByCategory = isPaletteByCategory( );
if ( bPaletteByCategory && ls.eContainer( )
instanceof SeriesDefinition )
{
sd = (SeriesDefinition) ls.eContainer( );
}
int iThisSeriesIndex = sd.getRunTimeSeries( ).indexOf( ls );
if ( iThisSeriesIndex < 0 )
{
throw new ChartException( ChartEngineExtensionPlugin.ID,
ChartException.RENDERING,
exception.missing.series.for.palette.index,
new Object[ ]{
ls, sd },
Messages.getResourceBundle(
getRunTimeContext( ).getULocale( ) ) );
}
Marker m = null;
// need
m = ls.getMarker( );
double width = bo.getWidth( ) / getDeviceScale( );
double height = bo.getHeight( ) / getDeviceScale( );
int markerSize = (int) ( ( ( width > height ? height : width )
- 2 ) / 2 );
if ( markerSize <= 0 )
{
markerSize = 1;
}
if ( m != null && m.isVisible( ) )
{
renderMarker( lg, ipr, m,
LocationImpl.create( bo.getLeft( ) + bo.getWidth( ) / 2,
bo.getTop( ) + bo.getHeight( ) / 2 ),
ls.getLineAttributes( ),
fPaletteEntry,
null,
new Integer( markerSize ),
false,
false );
}
}
The compute( ) method is called prior to any of the render methods during the build phase of the chart. This method gives the model renderer an opportunity to do pre-calculations or validation of data.
In the example, the radar compute( ) method validates that the number of data points for the base series and the orthogonal series is equal using the validateDataSetCount( ) method of BaseRenderer. It also validates the scale used by the chart as shown in Listing 23-14.
public void compute( Bounds bo, Plot p, ISeriesRenderingHints
isrh )
throws ChartException
{
final SeriesRenderingHints srh = (SeriesRenderingHints) isrh;
// VALIDATE CONSISTENT DATASET COUNT BETWEEN BASE AND
ORTHOGONAL
try
{
validateDataSetCount( isrh );
}
catch ( ChartException vex )
{
throw new ChartException( ChartEngineExtensionPlugin.ID,
ChartException.GENERATION,
vex );
}
// SCALE VALIDATION
try
{
dpha = srh.getDataPoints( );
double[ ] da = srh.asPrimitiveDoubleValues( );
if ( dpha == null || da == null ||
dpha.length < 1 || da.length < 1 )
{
throw new ChartException( ChartEngineExtensionPlugin.ID,
ChartException.RENDERING,
exception.invalid.datapoint.dial,
org.eclipse.birt.chart.engine.extension.i18n.Messages
.getResourceBundle( getRunTimeContext( ).getULocale( ) ) );
}
// Currently only using the base series to store
// web/radar-specific information
RadarSeries rsd = getFirstSeries( );
int psc = rsd.getPlotSteps( ).intValue( );
if ( psc > 20 )
{
psc = 20;
}
if ( psc < 1 )
{
psc = 1;
}
scaleCount = psc;
// Set on Plot dialog
double cvr =
( (ChartWithoutAxes) getModel( ) ).getCoverage( );
if ( cvr <= 0 )
{
cvr = 0.8;
}
percentReduce = 1 - cvr;
dSafeSpacing *= getDeviceScale( );
}
catch ( Exception ex )
{
ex.printStackTrace( );
throw new ChartException( ChartEngineExtensionPlugin.ID,
ChartException.GENERATION,ex );
}
}
The chart engine calls the renderSeries( ) method for every generated run-time series. This method calculates the data set min and max values and stores them in a class variable. These values are used to scale the radar. The render method for the series is then called. The code in Listing 23-15 shows the getDsMinMax( ) method and the renderSerie( ) methods which implement this functionality.
Listing 23-15 getDsMinMax( ) and renderSeries( ) methods
private void getDsMinMax( )
{
PluginSettings ps = PluginSettings.instance( );
IDataSetProcessor iDSP = null;
DataSet dst;
EList<SeriesDefinition> el =
( (ChartWithoutAxes) getModel( ) ).getSeriesDefinitions( );
ArrayList<Series> al =
new ArrayList<Series>( );
( (ChartWithoutAxesImpl)getModel( ) ).recursivelyGetSeries(
el,al,0, 0 );
final Series[ ] sea = al.toArray( new Series[al.size( )] );
for ( int i = 0; i < sea.length; i++ )
{
try
{
iDSP = ps.getDataSetProcessor( sea[i].getClass( ) );
dst = sea[i].getDataSet( );
Double min = (Double) iDSP.getMinimum( dst );
Double max = (Double) iDSP.getMaximum( dst );
if ( min != null && min < axisMin )
{
this.axisMin = min;
}
if ( max != null && max > axisMax )
{
this.axisMax = max;
}
}
catch ( Exception e )
{
e.printStackTrace( );
}
}
}
public void renderSeries( IPrimitiveRenderer ipr, Plot p,
ISeriesRenderingHints isrh ) throws ChartException
{
SeriesDefinition sd = getSeriesDefinition( );
ChartWithoutAxes cwoa = (ChartWithoutAxes) getModel( );
if ( cwoa.getDimension( ) !=
ChartDimension.TWO_DIMENSIONAL_LITERAL )
{
throw new ChartException( ChartEngineExtensionPlugin.ID,
ChartException.RENDERING,
exception.dial.dimension,
new Object[ ]{cwoa.getDimension( ).getName( )},
Messages.getResourceBundle(
getRunTimeContext( ).getULocale( ) ) );
}
logger.log( ILogger.INFORMATION,
Messages.getString( "info.render.series",
getRunTimeContext( ).getULocale( ) )
+ getClass( ).getName( )
#NAME?
+ iSeriesCount );
getDsMinMax( );
render( getDevice( ),
srh.getClientAreaBounds( true ),
(RadarSeries) getSeries( ),
sd );
}
The render method draws the actual radar. This method uses values from the model to determine how to display the chart.
The render method first calculates the center point and radial sizes of the radar chart. If the series is a bulls-eye chart the ovals are rendered. The data points are iterated and markers and labels are rendered. The points are then used in the renderPolys( ) method to render each of the lines and polygons. Finally, the method renders the web labels if the series is the last in the axes. The code for the render method is shown in Listing 23-16.
private final void render( IDeviceRenderer idr, Bounds bo,
RadarSeries se, SeriesDefinition sd ) throws ChartException
{
List<Series> rts = sd.getRunTimeSeries( );
int iThisSeriesIndex = rts.indexOf( se );
if ( iThisSeriesIndex == -1 )
iThisSeriesIndex = getSeriesIndex( );
int totalSeriesCnt = getSeriesCount( );
int currSeriesIdx = getSeriesIndex( );
final EList<Fill> elPalette =
sd.getSeriesPalette( ).getEntries( );
final AbstractScriptHandler<?> sh =
getRunTimeContext( ).getScriptHandler( );
dc = getDeferredCache( );
// render polys biggest to least
// render axes
// render labels
// render markers
Bounds boCA = goFactory.copyOf( bo );
double dh = boCA.getHeight( ) - ( boCA.getHeight( ) *
percentReduce );
double dl = boCA.getLeft( ) + ( boCA.getWidth( ) *
percentReduce ) / 2;
double dt = boCA.getTop( ) + ( boCA.getHeight( ) *
percentReduce ) / 2;
double dw = boCA.getWidth( ) - ( boCA.getWidth( ) *
percentReduce );
double centrePointX = Math.round( dl + dw / 2 );
double centrePointY = Math.round( dt + dh / 2 );
double mag = dh / 2;
Location cntpt = LocationImpl.create( centrePointX,
centrePointY );
if ( currSeriesIdx == 1 )
{
if ( BULLSEYE_SUBTYPE_LITERAL.equals(
getModel( ).getSubType( ) ) )
{
renderOvalBackgrounds( idr, cntpt, se, mag );
}
}
PolarCoordinate pc = new PolarCoordinate( cntpt,
dpha.length,
getSeriesCount( ) - 1,
getSeriesIndex( ) - 1 );
final boolean bPaletteByCategory = isPaletteByCategory( );
Fill fPaletteEntry = null;
if ( !bPaletteByCategory )
{
fPaletteEntry = FillUtil.getPaletteFill( elPalette,
iThisSeriesIndex );
updateTranslucency( fPaletteEntry, se );
}
Location loAxis =
LocationImpl.create( centrePointX, centrePointY );
List<Location> loList = new LinkedList<Location>( );
for ( int index = 0; index < dpha.length; index++ )
{
DataPointHints dph = dpha[index];
if ( isNaN( dph.getOrthogonalValue( ) ) )
{
continue;
}
double currval = ( (Double)
dph.getOrthogonalValue( ) ).doubleValue( );
if ( currval < 0 )
{
continue;
}
pc.computeLocation( loAxis, index, mag );
Location lo = pc.createLocation( index, mag
* ( currval / getAxisMax( ) ) );
loList.add( lo );
if ( bPaletteByCategory )
{
fPaletteEntry = FillUtil.getPaletteFill( elPalette,
index );
updateTranslucency( fPaletteEntry, se );
}
LineAttributes llia = se.getLineAttributes( );
if ( se.isPaletteLineColor( ) && index == 0 )
{
llia.setColor( goFactory.copyOf( FillUtil
.getColor( fPaletteEntry ) ) );
}
Marker m = se.getMarker( );
if ( m != null )
{
ScriptHandler.callFunction( sh,
ScriptHandler.BEFORE_DRAW_DATA_POINT,
dph,
fPaletteEntry,
getRunTimeContext( ).getScriptContext( ) );
getRunTimeContext( ).notifyStructureChange(
IStructureDefinitionListener
.BEFORE_DRAW_DATA_POINT, dph );
renderMarker( se,
idr,
m,
lo,
llia,
fPaletteEntry,
dph,
m.getSize( ),
true,
false );
ScriptHandler.callFunction( sh,
ScriptHandler.AFTER_DRAW_DATA_POINT,
dph,
fPaletteEntry,
getRunTimeContext( ).getScriptContext( ) );
getRunTimeContext( ).notifyStructureChange(
IStructureDefinitionListener.AFTER_DRAW_DATA_POINT,
dph );
}
drawSeriesLabel( idr, pc, dph, loAxis );
}
renderPolys( idr,
loList.toArray( new Location[loList.size( )] ),
se,
sd );
// last for rendering
if ( currSeriesIdx == ( totalSeriesCnt - 1 ) )
{
if ( se.getWebLineAttributes( ) != null
&& se.getWebLineAttributes( ).isVisible( ) )
{
renderAxes( idr, pc, se, mag );
}
RadarSeries rsd = getFirstSeries( );
if ( rsd.isShowWebLabels( ) )
{
Location loLabel = LocationImpl.create( 0, 0 );
for ( int sc = 0; sc <= scaleCount; sc++ )
{
final TextRenderEvent stre =
( (EventObjectCache) idr ).getEventObject(
StructureSource.createSeries( se ),
TextRenderEvent.class );
Label la = goFactory.copyOf( rsd.getLabel( ) );
la.setVisible( true );
stre.setTextPosition( TextRenderEvent.RIGHT );
// use this to set the direction
rsd.getLabelPosition();
double lblperc = ( (double) sc / scaleCount ) * 100;
DecimalFormat decform = new DecimalFormat( "#.##" );
lblperc = Double.valueOf( decform.format( lblperc ) );
la.getCaption( ).setValue( lblperc + "%" );
stre.setLabel( la );
stre.setAction( TextRenderEvent.RENDER_TEXT_AT_LOCATION );
double ycord = mag * sc / scaleCount;
ycord = Math.round( centrePointY - ycord );
double xcord = Math.round( centrePointX - 10 );
loLabel.set( xcord, ycord );
stre.setLocation( loLabel );
dc.addLabel( stre );
}
}
}
}
The renderSeries( ) method of the Radar class calls the render( ) method when the chart engine needs to render a radar series. For each series, the render( ) method creates a location array that contains all the points then renders the appropriate graphic.
The render( ) method first retrieves the current series index and the total number of series. These variables are used to determine when to render specific items.
The render( ) method receives the bounds for the area where the series is rendered. These bounds are modified by the coverage plot setting and new top, left, width, and height variables are created. In addition, the center point of the plot is created.
If the chart is a bulls-eye subchart type and is the first radar series to render, the renderOvalBackgrounds( ) method is called, which is discussed later in this chapter. It draws the banded circles in the background of the chart. Then the render( ) method begins to loop through all data points for the series.
For each new data point, a theta is calculated based on radians that split the entire radar chart into equidistant radials. An x- and y- coordinate is calculated for the individual point. The polar coordinates are handled using a private class within the Radar class. See the source code for more information. If the series is the last, the axes are rendered.
The renderOvalBackgrounds( ) method is only called for bulls-eye subchart types. This method draws a filled-oval background for each band in the radar. The palette color is based on the palette for the first series and incremented by one for every step. The bands are optionally rendered translucent, as shown in Listing 23-17.
Listing 23-17 renderOvalBackgrounds( ) method
private void renderOvalBackgrounds( IDeviceRenderer idr,
Location center,
Series se, double magnitude )
{
final OvalRenderEvent ore =
( (EventObjectCache)idr ).getEventObject(
StructureSource.createSeries( se ),
OvalRenderEvent.class );
LineAttributes lia = null;
LineAttributes wlia =
( (RadarSeries) se ).getWebLineAttributes( );
if ( wlia == null )
{
lia =
LineAttributesImpl.create( ColorDefinitionImpl.GREY( ),
LineStyle.SOLID_LITERAL, 1 );
}
else
{
lia = wlia;
}
ore.setBackground( lia.getColor( ) );
ore.setOutline( lia );
for ( int sc = scaleCount; sc >= 1; sc-- )
{
double spiderMag = magnitude * sc / scaleCount;
ore.setBounds( goFactory.createBounds( center.getX( ) -
spiderMag,
center.getY( ) - spiderMag,
spiderMag * 2,
spiderMag * 2 ) );
Fill wPaletteEntry = null;
Palette pa = sd.getSeriesPalette( );
int ps = pa.getEntries( ).size( );
int tscnt = getSeriesCount( );
int palcnt = ps + tscnt + sc;
if ( palcnt > ps )
palcnt = 1;
wPaletteEntry =
FillUtil.getPaletteFill( pa.getEntries( ), sc + 1 );
if ( wPaletteEntry instanceof ColorDefinition )
{
RadarSeries rsd = getFirstSeries( );
if ( rsd.isBackgroundOvalTransparent( ) )
{
wPaletteEntry =
goFactory.translucent(
(ColorDefinition) wPaletteEntry );
}
}
// ore.setBounds( goFactory.copyOf( bo ) );
ore.setBackground( wPaletteEntry );
try
{
idr.fillOval( ore );
}
catch ( Exception e )
{
e.printStackTrace( );
}
}
}
The renderPolys( ) method is called for every series when the final data point is processed. The prelocation array contains all the points for the series. How the array is drawn depends on settings made in the chart builder. For example, the chart can be rendered as a non-filled polygon, filled polygon, or a disconnected line.
This method uses the PolygonRenderEvent event and calls drawPolygon( ) and fillPolygon( ) for series that require filled polygons. The method uses a LineRenderEvent( ) and drawLine( ) to draw the disconnected line radar series, as shown in Listing 23-18.
Listing 23-18 renderPolys( ) method
private void renderPolys( IDeviceRenderer idr, Location[ ]
prelo, Series se, SeriesDefinition sd )
{
int iThisSeriesIndex = sd.getRunTimeSeries( ).indexOf( se );
if ( iThisSeriesIndex == -1 )
iThisSeriesIndex = getSeriesIndex( );
final EList<Fill> elPalette =
sd.getSeriesPalette( ).getEntries( );
Fill fPaletteEntry = FillUtil.getPaletteFill( elPalette,
iThisSeriesIndex );
LineAttributes llia = ( (RadarSeries)
se ).getLineAttributes( );
final PolygonRenderEvent pre =
( (EventObjectCache) idr ).getEventObject(
StructureSource.createSeries( se ),
PolygonRenderEvent.class );
final LineRenderEvent lre =
( (EventObjectCache) idr ).getEventObject(
StructureSource.createSeries( se ),
LineRenderEvent.class );
if ( se.isSetTranslucent( ) && se.isTranslucent( ) )
{
if ( fPaletteEntry instanceof ColorDefinition )
{
fPaletteEntry = goFactory.translucent(
(ColorDefinition) fPaletteEntry );
}
}
// Disconnected Lines
if ( !( (RadarSeries) se ).isConnectEndpoints( ) )
{
lre.setLineAttributes( llia );
for ( int i = 0; i < ( prelo.length - 1 ); i++ )
{
lre.setStart( prelo[i] );
lre.setEnd( prelo[i + 1] );
try
{
idr.drawLine( lre );
}
catch ( Exception e )
{
e.printStackTrace( );
}
}
}
else
{
pre.setBackground( fPaletteEntry );
pre.setPoints( prelo );
pre.setOutline( llia );
try
{
idr.drawPolygon( pre );
if ( ( (RadarSeries) se ).isFillPolys( ) )
{
idr.fillPolygon( pre );
}
}
catch ( Exception e )
{
e.printStackTrace( );
}
}
}
The drawSeriesLabel( ) method is called by the render( ) method and uses TextRenderEvent to render the labels for a specific data point in the series. The code for this method is shown in Listing 23-19.
Listing 23-19 drawSeriesLabel( ) method
private final void drawSeriesLabel( IDeviceRenderer idr,
PolarCoordinate pc, DataPointHints dph, Location lo )
throws ChartException
{
if ( se.getLabel( ).isVisible( ) )
{
double space = dSafeSpacing / 2;
Label la = goFactory.copyOf( se.getLabel( ) );
la.getCaption( ).setValue( dph.getDisplayValue( ) );
Location loLabel = lo;
final TextRenderEvent tre = ( (EventObjectCache) idr )
.getEventObject( WrappedStructureSource
.createSeriesDataPoint( se,
dph ),
TextRenderEvent.class );
tre.setLabel( la );
tre.setAction( TextRenderEvent.RENDER_TEXT_AT_LOCATION );
int degree = pc.getDegree( dph.getIndex( ) );
if ( Math.abs( degree ) > 90 )
{
tre.setTextPosition( TextRenderEvent.LEFT );
}
else
{
tre.setTextPosition( TextRenderEvent.RIGHT );
}
double dX = -Math.signum( Math.abs( degree ) - 90 ) * space;
double dY = -Math.signum( degree ) * space;
loLabel.translate( dX, dY );
tre.setLocation( loLabel );
// Text render event must be either cached or copied here
for correct interactivity.
dc.addLabel( tre );
}
}
The final method in this example is the renderAxes( ) method. This method is called by the render( ) method on the last series.
The vertical radials are first drawn and appear on all sub-types. Next, if the chart is a bulls-eye or standard radar chart sub-type, a set of ovals is drawn for each band or step.
If the chart subtype is a spider type, then a set of polygons is drawn using line segments to create the bands. The x- and y- coordinates for each line segment are calculated similar to the way the main data value locations described earlier in this chapter. The code in Listing 23-20 shows the renderAxes( ) method.
Listing 23-20 renderAxes( ) method
private void renderAxes( IDeviceRenderer idr, PolarCoordinate pc,
Series se, double magnitude )
{
Location center = pc.getCenter( );
int iSeriesCount = getSeriesCount( ) - 1;
int iCount = pc.getCount( ) * iSeriesCount;
pc = new PolarCoordinate( center, iCount, 1, 0 );
Location lo = center.copyInstance( );
LineAttributes lia = null;
LineAttributes wlia = null;
RadarSeries rsd = getFirstSeries( );
wlia = rsd.getWebLineAttributes( );
if ( wlia == null )
{
lia = LineAttributesImpl.create(
ColorDefinitionImpl.GREY( ),
LineStyle.SOLID_LITERAL,1 );
}
else
{
lia = wlia;
}
final LineRenderEvent lre = ( (EventObjectCache)
idr ).getEventObject( StructureSource.createSeries( se ),
LineRenderEvent.class );
final OvalRenderEvent ore = ( (EventObjectCache) idr )
.getEventObject( StructureSource.createSeries( se ),
OvalRenderEvent.class );
lre.setLineAttributes( lia );
// Radials
lre.setStart( center );
try
{
for ( int i = 0; i < iCount; i++ )
{
pc.computeLocation( lo, i, magnitude );
lre.setEnd( lo );
idr.drawLine( lre );
}
String subType = getModel( ).getSubType( );
if ( STANDARD_SUBTYPE_LITERAL.equals( subType )||
BULLSEYE_SUBTYPE_LITERAL.equals( subType ) )
ore.setBackground( lia.getColor( ) );
ore.setOutline( lia );
Bounds bo = BoundsImpl.create( 0, 0, 0, 0 );
for ( int sc = 1; sc <= scaleCount; sc++ )
{
double spiderMag = magnitude * sc / scaleCount;
ore.setBounds( pc.computeBounds( bo, spiderMag ) );
idr.drawOval( ore );
}
}
else if ( SPIDER_SUBTYPE_LITERAL.equals( subType ) )
{
Location lo1 = lo.copyInstance( );
for ( int sc = 1; sc < scaleCount + 1; sc++ )
{
double spiderMag = magnitude * sc / scaleCount;
pc.computeLocation( lo1, 0, spiderMag );
for ( int index = 1; index < iCount + 1; index++ )
{
lo.set( lo1.getX( ), lo1.getY( ) );
pc.computeLocation( lo1, index, spiderMag );
lre.setStart( lo );
lre.setEnd( lo1 );
idr.drawLine( lre );
}
}
}
}
catch ( Exception e )
{
e.printStackTrace( )3;
}
}
Debugging this example
When debugging this example, verify that the max perm size setting is set to 256M or greater. This setting is available in the VM arguments entry box in Debug Configuration, as shown in Figure 23-25.
Figure 23-25 Debugging the new Chart Type