Chapter 10. Application Visibility
This chapter covers the following topics:
![]() Application Visibility fundamentals
Application Visibility fundamentals
![]() ezPM
ezPM
![]() Metrics export—NetFlow v9 and IPFIX
Metrics export—NetFlow v9 and IPFIX
The growth in cloud computing and new voice and video collaboration applications are increasing the bandwidth, resiliency, and performance-monitoring requirements for the WAN. These new enterprise trends make it important for enterprise networks to be application aware to cost-effectively address these stringent requirements. For the staff responsible for planning, operating, and maintaining the network and network services, it is indispensable to have visibility into the current health of the network from end to end. It is also essential to gather short- and long-term data in order to fully understand how the network is performing and what applications are active on it. Capacity planning is one of the most important issues faced by organizations in managing their networks.
Application Visibility is a key component of IWAN to meet the needs of the modern cloud and collaboration applications. With Application Visibility it becomes possible to understand what applications are in use in enterprise networks and examine their performance.
Application Visibility Fundamentals
Application Visibility is an integral part of Cisco IOS software and is a key component of IWAN that collects and measures application performance data.
Overview
Network operators want to understand how their network is being used and by which applications. Traditionally, this knowledge has been obtained by exporting information about the flows traversing the network using Traditional NetFlow (TNF) and Flexible NetFlow (FNF), and then analyzing the data using a network management system (NMS) or analytic system. Exported fields that can be used to classify flows include IP addresses, port numbers, DSCP markings, and application names using NBAR, among other techniques. Collected metrics are traditionally bytes and packets that give information about the bandwidth used per application and client/server pair.
But organizations want real application visibility into the network and need to understand application performance. Performance Monitor is the next-generation monitoring engine that adds application-level visibility to a variety of network devices, beginning with branch and WAN aggregation routers and wireless LAN controllers. Performance Monitor recognizes and classifies thousands of applications, including voice and video, email, file sharing, gaming, peer-to-peer (P2P), encrypted, and cloud-based applications, and uses this classification to perform per-application monitoring of bandwidth statistics (traditional NetFlow statistics), of transactional application response time (ART) metrics, and of media application metrics such as latency and jitter. The per-application metrics are exported via NetFlow version 9 and Internet Protocol Flow Information Export (IPFIX) for analysis, reporting, and visualization by partner network management systems. All of this is accomplished without the need to deploy and manage separate hardware or software probes in each network location; it is integrated directly into the Cisco devices.
Performance Monitor is also an integral part of the Cisco initiative called Application Visibility and Control (AVC). This is why IWAN Application Visibility is commonly named AVC.
Components
The Cisco IWAN Application Visibility solution leverages multiple technologies to recognize and analyze applications, and it combines several Cisco IOS and IOS XE components, as well as communicates with external tools, to integrate the following functions into a powerful solution:
![]() Application recognition and classification: Operating on Cisco IOS and Cisco IOS XE, NBAR2 uses multiple innovative technologies such as DPI, DNS, DNS-AS, server based, and more to identify a wide variety of applications within the network traffic flow, using L3 to L7 data. NBAR2 can monitor thousands of applications and supports Protocol Pack updates for expanding application recognition, without requiring IOS upgrade or router reload. For more information, refer to Chapter 6, “Application Recognition.”
Application recognition and classification: Operating on Cisco IOS and Cisco IOS XE, NBAR2 uses multiple innovative technologies such as DPI, DNS, DNS-AS, server based, and more to identify a wide variety of applications within the network traffic flow, using L3 to L7 data. NBAR2 can monitor thousands of applications and supports Protocol Pack updates for expanding application recognition, without requiring IOS upgrade or router reload. For more information, refer to Chapter 6, “Application Recognition.”
![]() Metrics collection: Traditionally the monitoring engine used to collect bytes and packets has been Flexible NetFlow. Performance Monitor is the next-generation monitoring engine that can provide performance metrics for TCP-based applications (ART metrics), RTP-based applications (media applications), and HTTP-based applications. Performance Monitor allows the definition of a policy for the traffic to be monitored.
Metrics collection: Traditionally the monitoring engine used to collect bytes and packets has been Flexible NetFlow. Performance Monitor is the next-generation monitoring engine that can provide performance metrics for TCP-based applications (ART metrics), RTP-based applications (media applications), and HTTP-based applications. Performance Monitor allows the definition of a policy for the traffic to be monitored.
![]() Metrics export: Metrics are aggregated and exported in NetFlow v9 (RFC 3954) or IPFIX (RFC 7011) format to a management and reporting package. Metrics records are sent out directly from the data plane when possible, to maximize system performance. When more complex processing is required, such as when the router maintains a history of exported records, records may be exported by the route processor, which is slower than direct export from the data plane.
Metrics export: Metrics are aggregated and exported in NetFlow v9 (RFC 3954) or IPFIX (RFC 7011) format to a management and reporting package. Metrics records are sent out directly from the data plane when possible, to maximize system performance. When more complex processing is required, such as when the router maintains a history of exported records, records may be exported by the route processor, which is slower than direct export from the data plane.
![]() Management and reporting systems: Management and reporting systems, such as Cisco Prime Infrastructure or third-party tools, receive the network metrics data in NetFlow v9 or IPFIX format and provide a wide variety of system management and reporting functions. These functions include configuring metrics reporting, creating application and network performance reports, system provisioning, configuring alerts, and assisting in troubleshooting.
Management and reporting systems: Management and reporting systems, such as Cisco Prime Infrastructure or third-party tools, receive the network metrics data in NetFlow v9 or IPFIX format and provide a wide variety of system management and reporting functions. These functions include configuring metrics reporting, creating application and network performance reports, system provisioning, configuring alerts, and assisting in troubleshooting.
Figure 10-1 illustrates the basic elements of Application Visibility with the metering engine available on IWAN platforms, the exporting protocol, and the NMS that collects all performance metrics.

The key advantages to using Flexible NetFlow or Performance Monitor can be summarized as follows:
![]() Flexibility and scalability of flow data
Flexibility and scalability of flow data
![]() The ability to monitor a wide range of packet information, producing new information about network behavior
The ability to monitor a wide range of packet information, producing new information about network behavior
![]() Enhanced network anomaly and security detection
Enhanced network anomaly and security detection
![]() User-configurable flow information to perform customized traffic identification and the ability to focus and monitor specific network behavior
User-configurable flow information to perform customized traffic identification and the ability to focus and monitor specific network behavior
![]() Convergence of multiple accounting technologies into one accounting mechanism
Convergence of multiple accounting technologies into one accounting mechanism
Both Flexible NetFlow and Performance Monitor include two key components that perform the following functions:
![]() Flow caching analyzes and collects IP data flows within a router or switch and prepares data for export. Flexible NetFlow and Performance Monitor have the ability to implement multiple flow caches or flow monitors for tracking different applications simultaneously. For instance, the user can simultaneously track one application’s accessibility for security purposes and execute traffic analysis for performance issues for a different application in separate caches. This gives the ability to pinpoint and monitor specific information about the applications.
Flow caching analyzes and collects IP data flows within a router or switch and prepares data for export. Flexible NetFlow and Performance Monitor have the ability to implement multiple flow caches or flow monitors for tracking different applications simultaneously. For instance, the user can simultaneously track one application’s accessibility for security purposes and execute traffic analysis for performance issues for a different application in separate caches. This gives the ability to pinpoint and monitor specific information about the applications.
![]() NetFlow reporting collection uses exported data from multiple routers and filters, aggregates the data according to customer policies, and stores this summarized or aggregated data. NetFlow collection systems allow users to complete real-time visualization or trending analysis of recorded and aggregated flow data. Users can specify the router and aggregation scheme and time interval desired. Collection systems can be commercial or third-party freeware products and can be optimized for specific NetFlow applications such as traffic or security analysis.
NetFlow reporting collection uses exported data from multiple routers and filters, aggregates the data according to customer policies, and stores this summarized or aggregated data. NetFlow collection systems allow users to complete real-time visualization or trending analysis of recorded and aggregated flow data. Users can specify the router and aggregation scheme and time interval desired. Collection systems can be commercial or third-party freeware products and can be optimized for specific NetFlow applications such as traffic or security analysis.
Flows
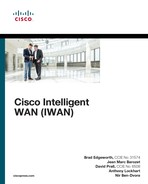
Flexible NetFlow and Performance Monitor use the concept of flows. A flow is defined as a stream of packets between a given source and a given destination. The definition of a flow is based on the definition of key fields. For example, a flow can include all packets between a given source IP and destination IP, or it can be defined as all traffic for a specific application. Performance Collection defines the concept of key fields and non-key fields:
![]() Flexible NetFlow and Performance Monitor use the values in key fields in IP datagrams, such as the IP source or destination address and the source or destination transport protocol port, as the criteria for determining when a new flow must be created in the cache while network traffic is being monitored. When the value of the data in the key field of a datagram is unique with respect to the flows that already exist, a new flow is created.
Flexible NetFlow and Performance Monitor use the values in key fields in IP datagrams, such as the IP source or destination address and the source or destination transport protocol port, as the criteria for determining when a new flow must be created in the cache while network traffic is being monitored. When the value of the data in the key field of a datagram is unique with respect to the flows that already exist, a new flow is created.
![]() Flexible NetFlow and Performance Monitor use non-key fields as the criteria for identifying fields from which data is captured from the flows. The flows are populated with data that is captured from the values in the non-key fields.
Flexible NetFlow and Performance Monitor use non-key fields as the criteria for identifying fields from which data is captured from the flows. The flows are populated with data that is captured from the values in the non-key fields.
![]() The combination of key fields and non-key fields is called a NetFlow record.
The combination of key fields and non-key fields is called a NetFlow record.
Figure 10-2 illustrates a NetFlow cache with key fields and non-key fields. The flow definition could include more fields, which are represented by ellipses, or have fewer fields. The application ID that was identified by NBAR2 is displayed in decimal format. The command show ip nbar protocol-id correlates the application ID to the specific application.
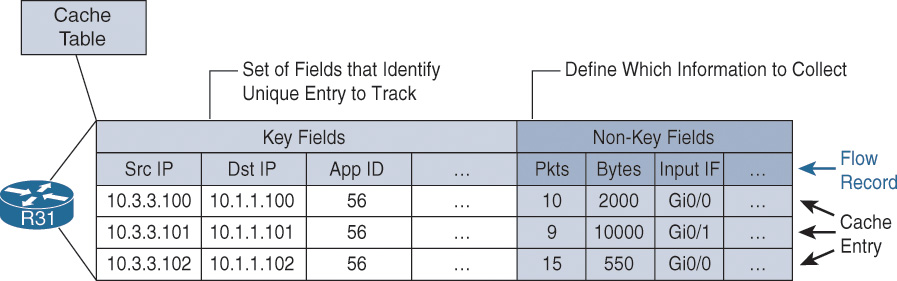
Figure 10-3 shows an example of the process for inspecting packets and creating flow records in the cache. In this example, two unique flows are created in the cache because different values are in the source and destination IP address key fields. Using application name as a key field might create multiple flows unless account-on-resolution is used.

Observation Point
The location where a router monitors traffic is called the observation point and is the interface where the flows are metered. The location of the observation point is exported to a network management station or analytic system.
Flow Direction
The flow direction is defined in RFC 5102 and is the direction of the flow observed at the observation point. Flow direction is ingress or egress and identifies whether the flow comes into an interface or out of an interface when the flow is collected. Figure 10-4 illustrates Performance Collection enabled:
![]() Observation point A is configured on R31’s ingress interface, GigabitEthernet0/3.
Observation point A is configured on R31’s ingress interface, GigabitEthernet0/3.
![]() Observation point B is configured on R31’s egress interface, tunnel 100.
Observation point B is configured on R31’s egress interface, tunnel 100.

Traffic leaving host 10.3.3.100 is ingress to R31’s GigabitEthernet0/3 and egress from R31’s tunnel 100 interface. The traffic coming back from the server is ingress to R31’s tunnel 100 interface and egress from R31’s GigabitEthernet0/3. As a result, Performance Collection can potentially report both forward and return traffic for observation points A and B. Therefore, IPFIX requires differentiation between ingress and egress to detect the direction of the network traffic flow for an interface.
Source/Destination IP Versus Connection
The definition of a flow in a NetFlow record usually includes the source and destination IP addresses. This creates two unidirectional flows. The use of connections creates a bidirectional flow and therefore reduces the size of the NetFlow cache, and it is always associated with the client or server regardless of where the bidirectional flow resides in the network.
Figure 10-5 shows the configuration differences that are available when defining the collection of a flow’s records.

Figure 10-6 illustrates the use of source and destination IP addresses versus connection in a record definition. When connection is used, a single bidirectional record is created.

Performance Metrics
In addition to bandwidth statistics, Application Visibility can provide performance metrics for TCP and media applications running over RTP.
Application Response Time Metrics
Application response time (ART) measures the performance of a TCP-based application. It separates the application delivery path into multiple segments and provides insight into application behavior (network versus server bottleneck) to accelerate problem isolation. ART metrics provide essential information on application performance as experienced by clients in branch offices. Enabling performance measurements in different network segments and using ART metrics helps to
![]() Quickly determine where a problem lies and identify the source of an application’s performance problems, which can be related to the network, the application, or the application server
Quickly determine where a problem lies and identify the source of an application’s performance problems, which can be related to the network, the application, or the application server
![]() Quickly resolve problems before users notice them
Quickly resolve problems before users notice them
![]() Understand application behavior over time to support planning for change: implementing new network resources, applying policies, and so forth
Understand application behavior over time to support planning for change: implementing new network resources, applying policies, and so forth
![]() Enable deployment and verification of WAN optimization services
Enable deployment and verification of WAN optimization services
![]() Clarify user expectations to support the development of service levels
Clarify user expectations to support the development of service levels
Figure 10-7 illustrates path segments between the client and the server. Server network delay (SND) approximates WAN delay.

ART metrics are metrics extracted or calculated by the ART engine. These metrics are available only for TCP flows. ART client/server bytes and packets are for Layer 3 and Layer 4 measurements.
Figure 10-8 illustrates the TCP performance in the context of different types of delay and response times.

From Figure 10-8, the following major performance metrics are calculated:
![]() Server network delay (SND) identifies the processing time for the operating system running on the server, assuming that the TCP handshake is managed by the kernel.
Server network delay (SND) identifies the processing time for the operating system running on the server, assuming that the TCP handshake is managed by the kernel.
![]() Client network delay (CND) identifies the processing time for the operating system on the client, assuming that the TCP handshake is managed by the kernel.
Client network delay (CND) identifies the processing time for the operating system on the client, assuming that the TCP handshake is managed by the kernel.
![]() Network delay (ND) = CND + SND.
Network delay (ND) = CND + SND.
![]() Application delay (AD) = response time (RT) – SND.
Application delay (AD) = response time (RT) – SND.
![]() Transaction time (TT) quantifies the user experience, and AD helps with troubleshooting server issues.
Transaction time (TT) quantifies the user experience, and AD helps with troubleshooting server issues.
Media Metrics
Performance Monitor calculates RTP packet drops by keeping track of the sequence numbers that are part of the RTP header. Unlike a TCP connection, a media stream based on RTP and UDP is always unidirectional. Thus, a Performance Monitor policy applied in the input direction on a LAN interface on a branch site’s router collects RTP metrics only for media streams leaving the site. To collect RTP metrics for media streams entering a branch site, you need to apply the policy either on the WAN interface (input) or on the LAN interface (output). Media monitoring can be applied at different locations to measure performance before and after the observation point. Figure 10-9 illustrates the RTP performance metrics for a collector instance applied on ingress or egress direction.

Another field in the RTP header is the synchronization source identifier (SSRC). This identifier is used to distinguish between different audio and video channels if they share the same UDP session. In the case of the Cisco TelePresence System, the multiscreen video channels share the same UDP stream (IP source, IP destination, and Layer 4 ports). For the Cisco TelePresence System, the SSRC is used to differentiate the unique video channels.
RTP jitter values are calculated by analyzing the timestamp field in the RTP header. The timestamp does not actually refer to regular time but to ticks of the encoder’s clock. For video, the encoding clock rate is usually 90 kHz, and in traditional voice it is 8 kHz. However, with modern wideband audio codecs, the frequency may be a variety of values. Performance Monitor tries to derive the clock rate from the payload type field in the RTP header, so the RTP payload type gives an idea of the kind of media in an RTP stream. The static RTP payload types can be found on the IANA website (www.iana.org/assignments/rtp-parameters).
Web Statistics
Performance Collection collects and exports web metrics such as host name, URIs (aka URLs), SSL common names, and more. This information can be used to identify which web traffic is business relevant and which traffic is business irrelevant. Performance metrics can be collected for those applications that are business relevant.
HTTP Host
Figure 10-10 illustrates HTTP traffic from a user to various destinations. The host names in this example are www.cnn.com, www.youtube.com, and www.facebook.com. The host is collected only when it is observed.

URI Statistics
A pattern is used to export the list of URIs and the corresponding hit counts. For example, in Figure 10-10 there are the following flows during the five-minute window: host name www.cnn.com, source IP 10.3.100.15, destination IP 100.64.20.2, destination port 80, and protocol TCP.
The result is exported with the source and destination IP addresses, port number, and URL.
Note
There are many more extracted fields and metrics, and Performance Monitor has the flexibility to be provisioned as needed. For more information about all metrics available with Performance Collection, refer to the “AVC Metrics Definitions” on the Cisco website, www.cisco.com.
Flexible NetFlow
Flexible NetFlow is commonly used to collect metrics about traffic forwarded by a device and supports both IPv4 and IPv6. It can be a first option to obtain application visibility, mostly based on application names and bandwidth utilization. This section on Flexible NetFlow is followed by the Performance Monitor section. Performance Monitor provides more benefits than FNF by including information on a specific class of traffic, history, or reaction. Performance Monitor runs on top of Flexible NetFlow, so any feature available in FNF is also available in Performance Monitor. It is recommended to use Performance Monitor to get the full application visibility that includes performance metrics.
Note
Performance Monitor is now included on the WAN edge router platforms that support IWAN.
Flexible NetFlow Overview
Flexible NetFlow (FNF) is an integral part of Cisco IOS software that collects and measures data, thus allowing every router or switch in the network to become a source of telemetry and a monitoring device. FNF allows extremely granular and accurate traffic measurements and high-level aggregated traffic collection.
Configuration Principles
The following process must be completed to enable NetFlow data collection and optional data export:
![]() Create an FNF flow record or select a built-in flow record: A combination of key and non-key fields is called a record. Flexible NetFlow records are assigned to FNF flow monitors to define the cache that is used for storing flow data.
Create an FNF flow record or select a built-in flow record: A combination of key and non-key fields is called a record. Flexible NetFlow records are assigned to FNF flow monitors to define the cache that is used for storing flow data.
FNF flow records define the criteria that are used to match a flow and additional criteria that routers should collect if present. Key fields are the mandatory criteria in a flow that must be matched in order for routers to create a cache and optionally export it. All key fields must be matched. Non-key fields are not mandatory criteria, but data is also collected if it exists. Flexible NetFlow includes several predefined records that can be used instead of creating a custom NetFlow record from scratch.
![]() Create a flow exporter for each external NetFlow collector: Flow exporters define where to send the flow data that has been collected. The flow record exporter destinations are NetFlow analyzers used for off-box analysis. Flow exporters are created as separate entities in the configuration. They are assigned to flow monitors to provide data export capability. Several flow monitors can be defined to provide several export destinations.
Create a flow exporter for each external NetFlow collector: Flow exporters define where to send the flow data that has been collected. The flow record exporter destinations are NetFlow analyzers used for off-box analysis. Flow exporters are created as separate entities in the configuration. They are assigned to flow monitors to provide data export capability. Several flow monitors can be defined to provide several export destinations.
![]() Create a flow monitor and associate it with either a custom or built-in flow record: Flow monitors are the FNF components that are applied to interfaces to perform network traffic monitoring. Flow data is collected from the network traffic and added to the flow monitor cache during the monitoring process based on the key and non-key fields in the flow record.
Create a flow monitor and associate it with either a custom or built-in flow record: Flow monitors are the FNF components that are applied to interfaces to perform network traffic monitoring. Flow data is collected from the network traffic and added to the flow monitor cache during the monitoring process based on the key and non-key fields in the flow record.
![]() Associate the flow monitor to an interface: The flow monitors must be associated to an interface in an ingress or egress fashion.
Associate the flow monitor to an interface: The flow monitors must be associated to an interface in an ingress or egress fashion.
The user-defined flow record facilitates the creation of various configurations for traffic analysis and data export on a networking device with a minimum number of configuration commands. Each flow monitor can have a unique combination of flow record, flow exporter, and cache type.
Create a Flexible NetFlow Flow Record
Flexible NetFlow requires the explicit configuration of a flow record that consists of both key fields and non-key fields. The following steps are required to create an FNF record:
Step 1. Create a user-defined flow record.
Customized flow records are used to analyze traffic data for a specific purpose. A customized flow record must have at least one match criterion for use as the key field and typically has at least one collect criterion for use as a non-key field.
The command flow record record-name defines a Flexible NetFlow record.
Step 2. Define the key fields.
Key fields are used to define the flow. The command match {application | datalink | flow | interface | ipv4 | ipv6 | routing | timestamp | transport} is used to configure a key field for the flow record.
For information about the key fields available for the match command, refer to the Cisco IOS Flexible NetFlow Command Reference at www.cisco.com/c/en/us/td/docs/ios/fnetflow/command/reference/fnf_book.html.
Step 3. Repeat Step 2 as required to configure additional key fields for the record.
Step 4. Define the non-key fields.
This step is to configure the metrics that Flexible NetFlow collects for every flow. The command collect defines a non-key field.
Step 5. Repeat Step 4 as required to configure additional non-key fields for the record.
Example 10-1 provides an example of a flow record configuration that is deployed to R11 to get a basic understanding of the traffic.
Example 10-1 R11 Flexible NetFlow Record Example
R11
flow record NMS-FLOWRECORD
description NMS Record
match ipv4 tos
match ipv4 protocol
match ipv4 source address
match ipv4 destination address
match transport source-port
match transport destination-port
match interface input
match flow direction
collect routing source as
collect routing destination as
collect routing next-hop address ipv4
collect ipv4 dscp
collect ipv4 id
collect ipv4 source prefix
collect ipv4 source mask
collect ipv4 destination mask
collect transport tcp flags
collect interface output
collect flow sampler
collect counter bytes
collect counter packets
collect timestamp sys-uptime first
collect timestamp sys-uptime last
collect application name
Create a Flow Exporter
The NetFlow data that is stored in the cache of the network device can be more effectively analyzed when exported to an external collector. A flow exporter is required only when exporting data to an external collector. This procedure may be skipped if data is analyzed only on the network device.
The following steps are performed to create a flow exporter for a remote system for further analysis and storage:
Step 1. Create a flow exporter.
A flow exporter defines the parameters for an NMS running a NetFlow collector. The command flow exporter exporter-name defines a new exporter.
Step 2. Define the destination.
Each flow exporter supports only one destination. If the data needs to be exported to multiple destinations, multiple flow exporters are configured and assigned to the flow monitor. The command destination {hostname | ip-address} [vrf vrf-name] specifies the destination for the export. The IP address can be either an IPv4 or IPv6 address.
Step 3. Define the export protocol.
Data can be exported using NetFlow v9 or IPFIX. The command export-protocol {netflow-v5 | netflow-v9 | ipfix} defines the export protocol. NetFlow v5 is available for traditional NetFlow and cannot be used for Application Visibility, which preferably uses IPFIX. NetFlow v9 can be used for Flexible NetFlow with a user-based record that does not require a variable-length field (such as URL monitoring).
Step 4. Define the UDP port.
The command transport udp udp-port defines the port used at the NMS.
Step 5. Define option templates.
The command option option-name is used to add the option templates that a network administrator wants to export to the NMS. Option templates include application table, interface table, and more. For information about the option names that are available to configure option templates, refer to the Cisco IOS Flexible NetFlow Command Reference.
Different NetFlow collector applications support different export version formats (NetFlow v9 and/or IPFIX) and expect to receive the exported data on a particular UDP port. Example 10-2 provides an example of a flow exporter configuration that is deployed on R11 to export to an NMS.
Example 10-2 R11 Flexible NetFlow Exporter
R11
flow exporter NMS-FLOWEXPORTER
destination 10.151.1.95
source Loopback0
transport udp 2055
export-protocol ipfix
option interface-table
option c3pl-class-table timeout 300
option c3pl-policy-table timeout 300
option application-table
Create a Flow Monitor
The network device must be configured to monitor the flows through the device on a per-interface basis. The flow monitor must include a flow record and optionally one or more flow exporters if data is to be collected and analyzed. After the flow monitor is created, it is applied to device interfaces. The flow monitor stores flow information in a cache, and the timer values for this cache are modified within the flow monitor configuration.
The following steps are required to create a Flexible NetFlow monitor and assign it to an interface:
Step 1. Create a flow monitor.
Customized flow records are used to analyze traffic data for a specific purpose. A customized flow record must have at least one match criterion for use as the key field and typically has at least one collect criterion for use as a non-key field.
The command flow monitor monitor-name defines a Flexible NetFlow monitor.
Step 2. Assign the flow record.
Each flow monitor requires a record to define the contents and layout of its cache entries. The record format can be one of the predefined record formats or a user-defined record. The command record record-name specifies the record for the flow monitor.
Predefined records such as netflow-original or netflow include a list of records that have predefined key and non-key fields. For information about predefined records, refer to the Cisco IOS Flexible NetFlow Command Reference.
Step 3. Assign the flow exporter (optional).
Each flow monitor may have one or more exporters to export the data in the flow monitor cache to an NMS running a NetFlow collector. The command exporter exporter-name assigns an exporter to this flow monitor.
Step 4. Set the cache timers.
The commands cache timeout active active-timer and cache timeout inactive inactive-timer define the cache timers.
Example 10-3 provides an example of a flow monitor configuration that is deployed to R11.
Example 10-3 R11 Flexible NetFlow Monitor
R11
flow monitor NMS-FLOWMONITOR
description NMS Monitor
exporter NMS-FLOWEXPORTER
cache timeout inactive 10
cache timeout active 60
record NMS-FLOWRECORD
Apply a Flow Monitor to the WAN
A best practice for NetFlow is to monitor all inbound and outbound traffic on the network device. This method covers all traffic regardless of encryption or application optimization. The command ip flow monitor monitor-name {input | output} assigns a flow monitor to an interface (physical or logical).
Example 10-4 provides an example of a flow monitor assigned to tunnel 100 on R11.
Example 10-4 Applying a Flexible NetFlow Monitor to the WAN
R11
interface Tunnel100
ip flow monitor MONITOR-STATS input
ip flow monitor MONITOR-STATS output
Example 10-5 provides the complete configuration for a sample FNF configuration. Figure 10-11 depicts the dependencies for Example 10-5 and FNF when there are multiple flow records, exporters, and monitors.

Example 10-5 Complete Sample Flexible NetFlow Monitor
R11
! Creation of the Flow
flow record NMS-FLOWRECORD
description NMS Record
match ipv4 tos
match ipv4 protocol
match ipv4 source address
match ipv4 destination address
match transport source-port
match transport destination-port
match interface input
match flow direction
collect routing source as
collect routing destination as
collect routing next-hop address ipv4
collect ipv4 dscp
collect ipv4 id
collect ipv4 source prefix
collect ipv4 source mask
collect ipv4 destination mask
collect transport tcp flags
collect interface output
collect flow sampler
collect counter bytes
collect counter packets
collect timestamp sys-uptime first
collect timestamp sys-uptime last
collect application name
!
! Creation of the Flow Exporter
flow exporter NMS-FLOWEXPORTER
destination 10.151.1.95
source Loopback0
transport udp 2055
export-protocol ipfix
option interface-table
option c3pl-class-table timeout 300
option c3pl-policy-table timeout 300
option application-table
!
! Creation of Flow Monitor
flow monitor NMS-FLOWMONITOR
description NMS Monitor
exporter NMS-FLOWEXPORTER
cache timeout inactive 10
cache timeout active 60
record NMS-FLOWRECORD
! Association of the Flow Monitor to the interface in both directions
interface Tunnel100
ip flow monitor MONITOR-STATS input
ip flow monitor MONITOR-STATS output
Flexible NetFlow for Application Visibility
Flexible NetFlow can be used for a variety of use cases ranging from simple statistics gathering to full Application Visibility. The following examples are given to illustrate flow record definition flexibility. Based on customer requirements, one or more flow records can be defined to collect what is necessary.
Use Case 1: Flow Statistics
Example 10-6 illustrates a flow record used to collect usage aggregated by source/destination IP addresses and ports.
Example 10-6 R11 Flexible NetFlow Record Statistics
R11
flow record RECORD-FLOW-STATS
match ipv4 dscp
match ipv4 protocol
match ipv4 source address
match ipv4 destination address
match transport source-port
match transport destination-port
match interface input
match flow direction
collect interface output
collect counter bytes long
collect counter packets
collect routing next-hop address ipv4
Note
Watch out for direction. In FNF, direction is not exported by default. In a large-scale aggregation, tracking and storing every single flow severely limits the scalability of the solution. Advanced filtering is available with Performance Monitor.
Use Case 2: Application Client/Server Statistics
Example 10-7 illustrates a flow record to collect usage aggregated by application name and source/destination address. The match application name command calls on NBAR2, and the optional account-on-resolution keyword provides accurate accounting until classification. The record is added to the cache only when the application classification is final, therefore representing an accurate accounting for the entire flow.
Example 10-7 R11 Flexible NetFlow Record Application Client/Server Statistics
R11
flow record RECORD-APPLICATION-CLIENT-SERVER-STATS
match ipv4 dscp
match ipv4 protocol
match ipv4 source address
match ipv4 destination address
match interface input
match flow direction
match application name [account-on-resolution]
collect interface output
collect counter bytes long
collect counter packets
collect routing next-hop address ipv4
Use Case 3: Application Usage
Example 10-8 illustrates a flow record defined to collect usage aggregated by application, flow direction, and interface.
Example 10-8 R11 Flexible NetFlow Record Application Usage
R11
flow record RECORD-APPLICATION-STATS
match interface input
match flow direction
match application name {account-on-resolution}
collect interface output
collect counter bytes long
collect counter packets
Monitoring NetFlow Data
The data stored in the cache of the network device can be viewed in several different ways to address common use cases. These methods are covered briefly to provide examples of how to access the flow data.
View Raw Data Directly on the Router
The simplest method of viewing the NetFlow cache is via the command show flow monitor monitor-name cache, which provides a summary of the cache status followed by a series of individual cache entries.
The FNF configuration shown in Example 10-9 is a basic example used to check existing flows on branch routers and get the DSCP used as well as the next hop.
Example 10-9 R31 Basic Flexible NetFlow Example
R31
flow record RECORD-STATS
match ipv4 dscp
match ipv4 protocol
match ipv4 source address
match ipv4 destination address
match transport source-port
match transport destination-port
match interface input
match flow direction
collect routing next-hop address ipv4
collect counter bytes
!
!
flow monitor MONITOR-STATS
cache timeout inactive 60
cache timeout active 60
cache timeout update 1
record RECORD-STATS
!
interface Tunnel 100
ip flow monitor MONITOR-STATS input
ip flow monitor MONITOR-STATS output
!
interface Tunnel 200
ip flow monitor MONITOR-STATS input
ip flow monitor MONITOR-STATS output
Example 10-10 illustrates the use of the command show flow monitor monitor-name cache.
Example 10-10 R31 Basic Flexible NetFlow Cache
R31-Spoke# show flow monitor MONITOR-STATS cache
Cache type: Normal
Cache size: 4096
Current entries: 30
High Watermark: 33
Flows added: 528193
Flows aged: 528163
– Active timeout (60 secs) 528163
– Inactive timeout (60 secs) 0
– Event aged 0
– Watermark aged 0
– Emergency aged 0
IPV4 SOURCE ADDRESS: 10.1.100.10
IPV4 DESTINATION ADDRESS: 10.3.3.100
TRNS SOURCE PORT: 1967
TRNS DESTINATION PORT: 30000
INTERFACE INPUT: Tu100
FLOW DIRECTION: Input
IP DSCP: 0x2E
IP PROTOCOL: 17
ipv4 next hop address: 10.3.3.100
counter bytes: 104
IPV4 SOURCE ADDRESS: 10.3.3.103
IPV4 DESTINATION ADDRESS: 10.4.4.103
TRNS SOURCE PORT: 30000
TRNS DESTINATION PORT: 1967
INTERFACE INPUT: Et1/0
FLOW DIRECTION: Output
IP DSCP: 0x2E
IP PROTOCOL: 17
ipv4 next hop address: 192.168.100.11
counter bytes: 880
IPV4 SOURCE ADDRESS: 10.1.102.10
IPV4 DESTINATION ADDRESS: 10.3.3.102
TRNS SOURCE PORT: 1967
TRNS DESTINATION PORT: 7000
INTERFACE INPUT: Tu100
FLOW DIRECTION: Input
IP DSCP: 0x12
IP PROTOCOL: 17
ipv4 next hop address: 0.0.0.0
counter bytes: 624
[Output omitted for brevity]
Note
Voice traffic is configured to use DSCP EF (0×2E). Critical applications are configured to use DSCP AF21 (0×12).
There are a couple of options available to format the output; the most useful one is to display a flow table. Example 10-11 illustrates the use of the command show flow monitor monitor-name cache format table.
Example 10-11 R31 Basic Flexible NetFlow Cache Format Table
R31-Spoke# show flow monitor MONITOR-STATS cache format table
Cache type: Normal
Cache size: 4096
Current entries: 35
High Watermark: 38
Flows added: 2567
Flows aged: 2532
– Active timeout (60 secs) 2532
– Inactive timeout (60 secs) 0
– Event aged 0
– Watermark aged 0
– Emergency aged 0
IPV4 SRC ADDR IPV4 DST ADDR TRNS SRC PORT TRNS DST PORT INTF INPUT
FLOW DIRN IP DSCP IP PROT ipv4 next hop addr bytes
=============== =============== ============= =============
==================== ========= ======= ======= ================== ==========
10.1.100.10 10.3.3.100 20000 30000 Tu100
Input 0x2E 17 10.3.3.100 173460
10.3.3.100 10.1.100.10 30000 20000 Gi0/3
Output 0x2E 17 192.168.100.11 114120
10.3.3.101 10.1.101.10 0 2048 Gi0/3
Output 0x00 1 192.168.200.12 4000
10.3.3.103 10.4.4.103 30000 20000 Gi0/3
Output 0x2E 17 192.168.100.41 111240
10.4.4.103 10.3.3.103 20000 30000 Tu100
Input 0x2E 17 10.3.3.103 111180
10.4.4.103 10.3.3.103 30000 20000 Tu100
Input 0x2E 17 10.3.3.103 111060
10.3.3.103 10.4.4.103 20000 30000 Gi0/3
Output 0x2E 17 192.168.100.41 111060
10.3.3.103 10.4.4.103 30000 1967 Gi0/3
Output 0x2E 17 192.168.100.41 160
10.4.4.103 10.3.3.103 1967 30000 Tu100
Input 0x2E 17 10.3.3.103 104
10.3.3.102 10.1.102.10 7000 1967 Gi0/3
Output 0x12 17 192.168.100.11 2160
10.1.102.10 10.3.3.102 1967 7000 Tu100
Input 0x12 17 0.0.0.0 1404
10.3.3.102 10.1.102.10 7000 7000 Gi0/3
Output 0x12 6 192.168.100.11 4428
10.1.102.10 10.3.3.102 7000 7000 Tu100
Input 0x12 6 10.3.3.102 3348
10.1.101.10 10.3.3.101 0 0 Tu200
Input 0x00 1 10.3.3.101 2100
10.4.4.103 10.3.3.103 30000 1967 Tu100
Input 0x2E 17 10.3.3.103 80
10.3.3.103 10.4.4.103 1967 30000 Gi0/3
Output 0x2E 17 192.168.100.41 52
10.3.3.100 10.1.100.10 30000 1967 Gi0/3
Output 0x2E 17 192.168.100.11 80
10.1.100.10 10.3.3.100 1967 30000 Tu100
Input 0x2E 17 10.3.3.100 52
If the specific fields are known, such as the source/destination IP address or the TCP/UDP port number, the cache can be searched for exact matches, or regular expressions can be used for broader match criteria.
Example 10-12 illustrates the use of the command show flow monitor monitor-name cache filter available on IOS with a filter on the destination port. Voice traffic is running on port 30000, and the command shows how to verify that RTP streams have the proper QoS DSCP settings.
Example 10-12 R31 Basic Flexible NetFlow Cache with Destination Port Filter Option
R31-Spoke# show flow monitor MONITOR-STATS cache filter transport destination-port
30000
Cache type: Normal
Cache size: 4096
Current entries: 29
High Watermark: 33
Flows added: 528550
Flows aged: 528521
– Active timeout (60 secs) 528521
– Inactive timeout (60 secs) 0
– Event aged 0
– Watermark aged 0
– Emergency aged 0
IPV4 SOURCE ADDRESS: 10.1.100.10
IPV4 DESTINATION ADDRESS: 10.3.3.100
TRNS SOURCE PORT: 20000
TRNS DESTINATION PORT: 30000
INTERFACE INPUT: Tu100
FLOW DIRECTION: Input
IP DSCP: 0x2E
IP PROTOCOL: 17
ipv4 next hop address: 10.3.3.100
counter bytes: 50940
IPV4 SOURCE ADDRESS: 10.1.100.10
IPV4 DESTINATION ADDRESS: 10.3.3.100
TRNS SOURCE PORT: 1967
TRNS DESTINATION PORT: 30000
INTERFACE INPUT: Tu100
FLOW DIRECTION: Input
IP DSCP: 0x2E
IP PROTOCOL: 17
ipv4 next hop address: 10.3.3.100
counter bytes: 52
Matched 2 flows
Note
The filter option is available only on IOS. Voice traffic is configured to use DSCP EF (0×2E).
View Reports on NetFlow Collectors
Although viewing the NetFlow cache directly on the router can be useful for real-time troubleshooting, it is recommended to use an external NetFlow collector that can build and display reports. One key advantage of using an external collector is the ability to aggregate and correlate flow data collected across multiple network devices. The NetFlow data, cached locally on the network device, is relatively short lived and is typically aged out by new flows within minutes. An external collector is essential to maintain a long-term view of the traffic patterns on a network.
Flexible NetFlow Summary
Flexible NetFlow is a useful network management tool for identifying, isolating, and correcting network problems across multiple devices, such as a misconfigured QoS policy. NetFlow applications can generate multiple reports and filter down to an individual conversation between two endpoints if the FNF record is configured with IP address as a key field. As seen in the previous examples, a proper FNF record definition is critical and is based on customer requirements.
Evolution to Performance Monitor
Performance Monitor is the monitoring engine used in IWAN for Application Visibility and supports both IPv4 and IPv6. As an example, Performance Routing (PfR) instantiates three Performance Monitor instances (PMIs) that provide an aggregated view of performance between sites. To get the full view of the performance metrics per flow, Performance Monitor can be configured and tuned according to the enterprise needs. Performance Monitor provides a wide variety of network metrics data. The monitoring agent collects
![]() Traffic statistics such as bandwidth usage
Traffic statistics such as bandwidth usage
![]() TCP performance metrics such as response time and latency
TCP performance metrics such as response time and latency
![]() RTP performance metrics such as packet loss and jitter
RTP performance metrics such as packet loss and jitter
Performance Monitor runs on top of Flexible NetFlow (and therefore supports all FNF metrics) and provides the following advantages:
![]() Many more metrics
Many more metrics
![]() Ability to apply a monitor on specific traffic with class maps
Ability to apply a monitor on specific traffic with class maps
![]() History
History
![]() Event generation
Event generation
![]() Ability to react when a threshold is crossed
Ability to react when a threshold is crossed
Performance Monitor can be configured in two ways:
![]() Explicitly configured with a model that is very similar to the one used in FNF but brings additional flexibility with a class map that allows filtering of traffic. The configuration can be long but provides a very flexible model.
Explicitly configured with a model that is very similar to the one used in FNF but brings additional flexibility with a class map that allows filtering of traffic. The configuration can be long but provides a very flexible model.
![]() Automatically configured based on predefined templates. This configuration, called Easy Performance Monitor (ezPM), drastically simplifies the configuration and is the recommended option because it includes Cisco validated records, monitors, class maps, and policy maps. The configuration consists of only a couple of lines.
Automatically configured based on predefined templates. This configuration, called Easy Performance Monitor (ezPM), drastically simplifies the configuration and is the recommended option because it includes Cisco validated records, monitors, class maps, and policy maps. The configuration consists of only a couple of lines.
Principles
Performance Monitor is a passive monitoring engine that is an integral part of Cisco IOS software and collects and measures performance data. Performance Monitor also uses the concept of flows, similar to Flexible NetFlow, but provides much more information. A flow is defined as a stream of packets. The definition of a flow is based on the definition of key fields. Performance Monitor includes metric providers that collect data and a Metric Mediation Agent (MMA) that correlates data from various metric providers and exposes them to the user or NMS.
The MMA manages, correlates, and aggregates metrics from different metric providers. It performs the following functions:
![]() Controls the traffic monitoring and filtering policy
Controls the traffic monitoring and filtering policy
![]() Correlates data from multiple metric providers into the same record
Correlates data from multiple metric providers into the same record
![]() Aggregates metrics
Aggregates metrics
![]() Supports history and alert functions
Supports history and alert functions
Metric providers collect and calculate metrics and provide them to the MMA for correlation. There are a variety of metric providers; some collect simple, stateless metrics per packet, and other more complex metric providers track states and collect metrics per flow, transforming the metrics at the time of export and making sophisticated calculations. These transformations may require punting of records to the route processor (RP) before the metrics are exported to the management and reporting system.
The MMA compiles multiple metric providers of different types into the same record.
The exporter is used to export records to the NMS. Metrics are aggregated and exported in NetFlow v9 (RFC 3954) or IPFIX (RFC 7011) format to a management and reporting package.
Figure 10-12 illustrates the architecture of Performance Monitor.

Performance Monitor includes the following major providers:
![]() Traffic statistics: Collects the traditional metrics collected by Flexible NetFlow
Traffic statistics: Collects the traditional metrics collected by Flexible NetFlow
![]() ART metrics: Collects performance metrics for TCP-based applications
ART metrics: Collects performance metrics for TCP-based applications
![]() Media metrics: Collects performance metrics for RTP-based applications
Media metrics: Collects performance metrics for RTP-based applications
Performance Monitor collects information with different levels of granularity based on the configuration used or the profile used with ezPM. A higher level of granularity has an effect on memory and CPU. Table 10-1 summarizes some of the key differences between the two main ezPM profiles.

Some use cases may require a combination of high-level and low-level granularity. It may be interesting to configure a low level of granularity to collect interface traffic (with applications and their bandwidth usage only) and a very high level of granularity for a just a small subset of the traffic (for example, to report performance metrics for specific critical applications).
Performance Monitor Configuration Principles
The Performance Monitor configuration includes many of the same basic elements that are in the Flexible NetFlow configuration:
![]() Flow record—type performance-monitor
Flow record—type performance-monitor
![]() Flow monitor—type performance-monitor
Flow monitor—type performance-monitor
![]() Flow exporter
Flow exporter
![]() Class map
Class map
![]() Policy map—type performance-monitor
Policy map—type performance-monitor
Figure 10-13 illustrates the Performance Monitor configuration. A policy includes one or more classes. Each class has a flow monitor of type performance-monitor associated with it, and each flow monitor has a flow record of type performance-monitor and an optional flow exporter associated with it. Compared to the Flexible NetFlow configuration, the use of a class map allows a better and finer filtering. For example, Performance Monitor can be configured to track performance only for voice traffic.

The following steps are required to enable Performance Monitor:
Step 1. Create a flow exporter for each external NetFlow collector.
Flow exporters export the data in the flow monitor cache to a remote system running a NetFlow collector for analysis and storage. Flow exporters are created as separate entities in the configuration. Flow exporters are assigned to flow monitors to provide data export capability for the flow monitors. Several flow monitors can be defined to provide several export destinations.
Step 2. Configure a flow record to specify the key and non-key fields that will be monitored.
A flow record is configured using the match and collect commands. A flow exporter can optionally be configured to specify the export destination. For Cisco Performance Monitor, a performance-monitor type flow record is required.
Step 3. Configure a flow monitor that includes the flow record and flow exporter.
For Cisco Performance Monitor, a performance-monitor type flow monitor is required.
Step 4. Configure a class map to specify the filtering criteria using the class-map command.
Step 5. Configure a policy map to include one or more classes and one or more performance-monitor type flow monitors using the policy-map command.
For Cisco Performance Monitor, performance-monitor type policies are required.
Step 6. Associate a performance-monitor type policy to the appropriate interface using the service-policy type performance-monitor command.
Example 10-13 illustrates the use of Performance Monitor to collect statistics for IPv6 traffic and ART metrics for IPv6 TCP traffic.
Example 10-13 Performance Monitor Configuration Example
R11
! Flow Exporter
flow exporter AVC_FLOW_EXPORT
transport udp 4825
export-protocol ipfix
source Loopback0
dscp 57
template data timeout 300
option c3pl-class-table timeout 300
option c3pl-policy-table timeout 300
!
! Flow Record for IPv6 Traffic
flow record type performance-monitor AVC_RECORD_IPV6
match connection client ipv6 address
match connection server ipv6 address
match connection server transport port
match ipv6 protocol
collect interface input
collect interface output
collect connection client counter bytes network long
collect connection server counter bytes network long
collect connection client counter packets long
collect connection server counter packets long
collect ipv6 dscp
collect policy qos classification hierarchy
collect connection delay response client-to-server sum
collect connection new-connections
collect connection server counter responses
collect connection initiator
collect connection transaction counter complete
collect application name
!
! Flow Record for IPv6 TCP Traffic
flow record type performance-monitor AVC_RECORD_IPV6_TCP
! Key fields for Performance-monitor
match connection client ipv6 address
match connection server ipv6 address
match connection server transport port
match ipv6 protocol
collect interface input
collect interface output
collect connection client counter bytes network long
collect connection server counter bytes network long
collect connection client counter packets long
collect connection server counter packets long
collect ipv6 dscp
collect policy qos classification hierarchy
collect connection delay network to-server sum
collect connection delay network to-client sum
collect connection delay application sum
collect connection delay response to-server histogram bucket1
collect connection delay response to-server histogram bucket2
collect connection delay response to-server histogram bucket3
collect connection delay response to-server histogram bucket4
collect connection delay response to-server histogram bucket5
collect connection delay response to-server histogram bucket6
collect connection delay response to-server histogram bucket7
collect connection delay response to-server histogram late
collect connection delay response client-to-server sum
collect connection new-connections
collect connection server counter responses
collect connection initiator
collect connection transaction counter complete
collect application name
!
! Flow Monitor for IPv6 TCP Traffic
flow monitor type performance-monitor AVC_FLOW_MONITOR_IPV6
record AVC_RECORD_IPV6
exporter AVC_FLOW_EXPORT
cache timeout synchronized 300
cache type synchronized
history size 0
cache entries 1000000
!
! Flow Monitor for IPv6 TCP Traffic
flow monitor type performance-monitor AVC_FLOW_MONITOR_IPV6_TCP
record AVC_RECORD_IPV6_TCP
exporter AVC_FLOW_EXPORT
cache timeout synchronized 300
cache type synchronized
history size 0
cache entries 1000000
!
! Define Class-Map to match IPv6 and TCP IPv6 traffic
ipv6 access-list ACL-IPV6
permit ipv6 any any
ipv6 access-list ACL-IPV6_TCP
permit tcp any any
!
class-map match-any CLASS-ALLOW_CUSTOMER_TRAFFIC_IPV6
match access-group name ACL-IPV6
class-map match-any CLASS-ALLOW_CUSTOMER_TRAFFIC_IPV6_TCP
match access-group name ACL-IPV6_TCP
!
! Define policy-map using class-map to match all traffic
policy-map type performance-monitor POLICY-PERF_MON_POLICY_INPUT
class CLASS-ALLOW_CUSTOMER_TRAFFIC_IPV6_TCP
flow monitor AVC_FLOW_MONITOR_IPV6_TCP
class CLASS-ALLOW_CUSTOMER_TRAFFIC_IPV6
flow monitor AVC_FLOW_MONITOR_IPV6
!
policy-map type performance-monitor POLICY-PERF_MON_POLICY_OUTPUT
class CLASS-ALLOW_CUSTOMER_TRAFFIC_IPV6_TCP
flow monitor AVC_FLOW_MONITOR_IPV6_TCP
class CLASS-ALLOW_CUSTOMER_TRAFFIC_IPV6
flow monitor AVC_FLOW_MONITOR_IPV6
!
interface GigabitEthernet0/0/1
service-policy type performance-monitor input POLICY-PERF_MON_POLICY_INPUT
service-policy type performance-monitor output POLICY-PERF_MON_POLICY_OUTPUT
The Performance Monitor configuration is extremely flexible and provides a large set of options and fields, but it can also quickly become complex. Example 10-13 is an example with just a subset of the traffic. This is the reason why it is recommended to use a profile-based approach with ezPM.
Easy Performance Monitor (ezPM)
As seen in the previous section, the Performance Monitor configuration can quickly become complex with many options and parameters. The ezPM feature provides a simple and effective method of provisioning monitors and is based on templates that are validated as part of the IWAN solution tests. ezPM adds functions without affecting the traditional, full-featured Performance Monitor configuration model for provisioning monitors, but it does not provide the full flexibility of the traditional Performance Monitor configuration model.
ezPM provides profiles that represent typical deployment scenarios. ezPM profiles include the following:
![]() Application Statistics
Application Statistics
![]() Application Performance
Application Performance
![]() Application Experience (legacy only)
Application Experience (legacy only)
After selecting a profile and specifying a small number of parameters, ezPM provides the remaining provisioning details, which greatly simplify the Performance Monitor configuration. There is also an option to display the entire configuration.
The Application Statistics profile is appropriate for the following use cases:
![]() Common deployments, capacity planning
Common deployments, capacity planning
![]() Aggregated application-level statistics (examples: top N applications, bandwidth per application, top clients/servers per application)
Aggregated application-level statistics (examples: top N applications, bandwidth per application, top clients/servers per application)
![]() Per-interface/application statistics
Per-interface/application statistics
![]() Per-client/server/application/interface statistics
Per-client/server/application/interface statistics
The Application Performance profile is appropriate when performance metrics and maximum information are required:
![]() Common deployments, capacity planning, but with more details than the Application Statistics profile
Common deployments, capacity planning, but with more details than the Application Statistics profile
![]() Aggregated application-level statistics (examples: top N applications, bandwidth per application, top clients/servers per application)
Aggregated application-level statistics (examples: top N applications, bandwidth per application, top clients/servers per application)
![]() All application statistics with the main addition of application performance metrics
All application statistics with the main addition of application performance metrics
![]() Finer granularity
Finer granularity
The Application Experience profile remains available only to support legacy configurations, but it is recommended to use the improved Application Performance profile for new configurations.
Application Statistics Profile
Application Statistics is a simple profile used to collect application statistics. It does not report performance statistics in contrast to the Application Performance profile. This profile is a good means to understanding the enterprise traffic profile and discovering applications and their bandwidth usage.
The Application Statistics profile provides two different traffic monitors, application-stats and application-client-server-stats, described in Table 10-2. The monitors operate on all IPv4 and IPv6 traffic and are based on a coarse-grain model.
The application-stats monitor collects data (and mostly bandwidth information) per application. All metrics are aggregated per application. This monitor does not keep individual client/source information. The application-client-server-stats monitor on the other end collects metrics of every client/server in addition to application name and bandwidth information.
The Application Statistics profile operates with only one monitor, because the application-client-server-stats monitor reports the same information as the application-stats monitor, plus additional information.
Application Performance Profile
The Application Performance profile is an improved form of the Application Experience profile, optimized for maximum performance and still exporting the maximum possible amount of available information for monitored traffic.
The Application Performance profile enables the use of five different traffic monitors, described in Table 10-3. The monitors operate on all IPv4 and IPv6 traffic.

Application Experience Profile
The Application Experience profile enables the use of five different traffic monitors, described in Table 10-4. The monitors operate on all IPv4 and IPv6 traffic.

It is recommended to use the new Application Performance profile described in the previous section. The Application Experience profile remains available only for backward compatibility.
ezPM Configuration Steps
ezPM provides a simple and effective method of provisioning monitors based on profiles. The configuration is straightforward but also allows the use of parameterized options such as class-replace, ipv4/ipv6, and so on. The cache size is automatically set based on the platform used, as opposed to Flexible NetFlow which requires explicit configuration. The following steps are required to create a Performance Monitor instance and assign it to an interface using ezPM:
Step 1. Choose a profile and create a Performance Monitor context.
The command performance monitor context context-name profile {application-statistics | application performance} creates a Performance Monitor context.
Each context may have one or more exporters to export the data in the Performance Monitor cache to an NMS running a NetFlow collector. The command exporter destination {hostname | ip-address} source interface interface-id [port port-value transport udp vrf vrf-name] defines the exporter (collector running on the NMS).
Step 3. Define the monitor to use.
Choose the monitor to enable based on the profile used. The command traffic monitor traffic-monitor-name is used to assign an exporter to this flow monitor.
Options for traffic monitor type include the following:
![]() Application Performance profile:
Application Performance profile:
![]() url
url
![]() application-response-time
application-response-time
![]() application-traffic-stats
application-traffic-stats
![]() conversation-traffic-stats
conversation-traffic-stats
![]() media
media
![]() Application Statistics profile:
Application Statistics profile:
![]() application-stats
application-stats
![]() application-client-server-stats
application-client-server-stats
This command includes more parameters such as the cache size, cache type, IPv4 and/or IPv6, and others. For information about the options available for the traffic monitor traffic-monitor-name command, refer to the Cisco Application Visibility and Control User Guide at www.cisco.com/c/en/us/td/docs/ios/solutions_docs/avc/guide/avc-user-guide.html.
Step 4. To configure additional traffic monitor parameters, repeat Step 3.
Step 5. Assign the Performance Monitor context to the interface.
The interface is selected with the command interface interface-id. Then the performance monitor is assigned with the command performance monitor context context-name.
Example 10-14 provides an example of a Performance Monitor with the Application Statistics profile where the application-client-server-stats monitor is used.
Example 10-14 ezPM Configuration Example for Application Statistics
R11-Hub
! Easy performance monitor context
!
performance monitor context MYTEST profile application-statistics
exporter destination 10.1.1.200 source Loopback0
traffic-monitor application-client-server-stats
!
! Interface attachments
interface GigabitEthernet0/0/2
performance monitor context MYTEST
The command show performance-monitor context context-name configuration gives the configuration generated by ezPM. Example 10-15 shows the output for the configuration used in Example 10-14.
Example 10-15 ezPM Equivalent Configuration for Application Statistics Profile and Monitor application-client-server-stats
R31-Spoke# show performance monitor context MYTEST configuration
!===============================================================================
! Equivalent Configuration of Context MYTEST !
!===============================================================================
!Access Lists
!=============
!Class-maps
!===========
class-map match-all MYTEST-app_cs_stats_ipv4
match protocol ip
!
class-map match-all MYTEST-app_cs_stats_ipv6
match protocol ipv6
!
!Samplers
!=========
!Records and Monitors
!=====================
!
flow record type performance-monitor MYTEST-app_cs_stats_ipv4
description ezPM record
match ipv4 version
match ipv4 protocol
match application name account-on-resolution
match connection client ipv4 address
match connection server ipv4 address
match connection server transport port
match flow observation point
collect routing vrf input
collect ipv4 dscp
collect flow direction
collect timestamp sys-uptime first
collect timestamp sys-uptime last
collect connection initiator
collect connection new-connections
collect connection sum-duration
collect connection server counter packets long
collect connection client counter packets long
collect connection server counter bytes network long
collect connection client counter bytes network long
!
flow monitor type performance-monitor MYTEST-app_cs_stats_ipv4
record MYTEST-app_cs_stats_ipv4
cache entries 7500
cache timeout synchronized 60 export-spread 15
history size 1
!
flow record type performance-monitor MYTEST-app_cs_stats_ipv6
description ezPM record
match ipv6 version
match ipv6 protocol
match application name account-on-resolution
match connection client ipv6 address
match connection server transport port
match connection server ipv6 address
match flow observation point
collect routing vrf input
collect ipv6 dscp
collect flow direction
collect timestamp sys-uptime first
collect timestamp sys-uptime last
collect connection initiator
collect connection new-connections
collect connection sum-duration
collect connection server counter packets long
collect connection client counter packets long
collect connection server counter bytes network long
collect connection client counter bytes network long
!
flow monitor type performance-monitor MYTEST-app_cs_stats_ipv6
record MYTEST-app_cs_stats_ipv6
cache entries 7500
cache timeout synchronized 60 export-spread 15
history size 1
!
!Policy-maps
!============
policy-map type performance-monitor MYTEST-in
parameter default account-on-resolution
class MYTEST-app_cs_stats_ipv4
flow monitor MYTEST-app_cs_stats_ipv4
class MYTEST-app_cs_stats_ipv6
flow monitor MYTEST-app_cs_stats_ipv6
!
policy-map type performance-monitor MYTEST-out
parameter default account-on-resolution
class MYTEST-app_cs_stats_ipv4
flow monitor MYTEST-app_cs_stats_ipv4
class MYTEST-app_cs_stats_ipv6
flow monitor MYTEST-app_cs_stats_ipv6
!
!Interface Attachments
!======================
interface GigabitEthernet0/0/2
service-policy type performance-monitor input MYTEST-in
service-policy type performance-monitor output MYTEST-out
Example 10-16 provides an example of a Performance Monitor with the Application Performance profile with all monitors enabled.
Example 10-16 ezPM Configuration Example for Application Performance Profile
R11-Hub
! Easy performance monitor context
!
performance monitor context MYTEST profile application-performance
exporter destination 10.1.1.200 source Loopback0
traffic-monitor all
!
!
! Interface attachments
! ---------------------
!
interface GigabitEthernet0/0/2
performance monitor context MYTEST
Example 10-17 provides an example of a Performance Monitor with the Application Performance profile with only a subset of the monitors enabled and only for IPv6 traffic.
Example 10-17 ezPM Configuration Example for Application Performance Profile for only IPv6 Traffic
R11-Hub
! Easy performance monitor context
performance monitor context MYTEST profile application-performance
exporter destination 1.2.3.4 source GigabitEthernet0/0/1 port 4739
traffic-monitor application-response-time ipv6
traffic-monitor application-client-server-stats ipv6
traffic-monitor media ipv6
!
! Interface attachments
interface GigabitEthernet0/0/1
performance monitor context MYTEST
interface GigabitEthernet0/0/2
performance monitor context MYTEST
Monitoring Performance Monitor
Viewing the Performance Monitor cache directly on the router is not easy, and it is recommended to use an external NetFlow collector that can build and display reports. An external collector has the ability to aggregate the information collected across multiple network devices.
Metrics Export
Performance Monitor stores all traffic metrics in a local cache of every router. This NetFlow data, cached locally on the network device, is relatively short lived and is typically aged out by new flows within minutes. An external collector is essential to maintain a long-term view of the traffic patterns on a network. This NetFlow data is exported to an external NMS that includes a NetFlow collector. The protocol used to export these metrics is an IETF standard called NetFlow v9 and IPFIX.
Flow Record, NetFlow v9, and IPFIX
The basic output of Flexible NetFlow or Performance Monitor is a flow record. Several different formats for flow records have evolved as NetFlow has matured. The most recent evolutions of the NetFlow flow record format are known as NetFlow version 9 and IPFIX. The distinguishing feature of the NetFlow v9 and IPFIX formats is that they are template based. Templates provide an extensible design to the record format, a feature that should allow future enhancements to NetFlow services without requiring concurrent changes to the basic flow record format.
Figure 10-14 illustrates the principle of the NetFlow v9 and IPFIX export protocols with a template-based exporting process.

Terminology
One of the difficulties of describing the NetFlow v9 or IPFIX packet format is that many distinctly different but similar-sounding terms are used to describe portions of the NetFlow output. To forestall any confusion, these terms are described here:
![]() Export packet: Built by a device (for example, a router) with monitoring services enabled, this type of packet is addressed to another device (for example, a NetFlow collector). The other device processes the packet (parses, aggregates, and stores information on IP flows).
Export packet: Built by a device (for example, a router) with monitoring services enabled, this type of packet is addressed to another device (for example, a NetFlow collector). The other device processes the packet (parses, aggregates, and stores information on IP flows).
![]() FlowSet: Following the packet header, an export packet contains information that must be parsed and interpreted by the collector device. FlowSet is a generic term for a collection of records that follow the packet header in an export packet. There are two different types of FlowSets: template and data. An export packet contains one or more FlowSets, and both template and data FlowSets can be mixed within the same export packet.
FlowSet: Following the packet header, an export packet contains information that must be parsed and interpreted by the collector device. FlowSet is a generic term for a collection of records that follow the packet header in an export packet. There are two different types of FlowSets: template and data. An export packet contains one or more FlowSets, and both template and data FlowSets can be mixed within the same export packet.
![]() Template ID: The template ID is a unique number that distinguishes a template record from all other template records produced by the same export device. A collector application that receives export packets from several devices should be aware that uniqueness is not guaranteed across export devices. Thus, the collector should also cache the address of the export device that produced the template ID in order to enforce uniqueness.
Template ID: The template ID is a unique number that distinguishes a template record from all other template records produced by the same export device. A collector application that receives export packets from several devices should be aware that uniqueness is not guaranteed across export devices. Thus, the collector should also cache the address of the export device that produced the template ID in order to enforce uniqueness.
![]() Template record: A template record defines the format of subsequent data records that may be received in current or future export packets. Templates are used to describe the type and length of individual fields within a NetFlow data record that match a template ID. A template record within an export packet does not necessarily indicate the format of data records within that same packet. A collector application must cache any template records received, and then parse any data records it encounters by locating the appropriate template record within the cache.
Template record: A template record defines the format of subsequent data records that may be received in current or future export packets. Templates are used to describe the type and length of individual fields within a NetFlow data record that match a template ID. A template record within an export packet does not necessarily indicate the format of data records within that same packet. A collector application must cache any template records received, and then parse any data records it encounters by locating the appropriate template record within the cache.
![]() Options template: An options template is a special type of template record used to communicate the format of data related to the NetFlow process.
Options template: An options template is a special type of template record used to communicate the format of data related to the NetFlow process.
![]() Data record: A data record provides information about an IP flow that exists on the device that produced an export packet. Each group of data records (that is, each data FlowSet) references a previously transmitted template ID, which can be used to parse the data contained within the records.
Data record: A data record provides information about an IP flow that exists on the device that produced an export packet. Each group of data records (that is, each data FlowSet) references a previously transmitted template ID, which can be used to parse the data contained within the records.
![]() Options data record: The options data record is a special type of data record (based on an options template) with a reserved template ID that provides information about the NetFlow process itself. An example is application name to identifier mapping, or interface name to interface identifier mapping.
Options data record: The options data record is a special type of data record (based on an options template) with a reserved template ID that provides information about the NetFlow process itself. An example is application name to identifier mapping, or interface name to interface identifier mapping.
![]() Template FlowSet: A template FlowSet is a collection of one or more template records that have been grouped together in an export packet.
Template FlowSet: A template FlowSet is a collection of one or more template records that have been grouped together in an export packet.
![]() Data FlowSet: A data FlowSet is a collection of one or more data records that have been grouped together in an export packet.
Data FlowSet: A data FlowSet is a collection of one or more data records that have been grouped together in an export packet.
A NetFlow export format consists of a packet header followed by one or more template or data FlowSets. A template FlowSet provides a description of the fields that will be present in future data FlowSets. These data FlowSets may occur later within the same export packet or in subsequent export packets. Figure 10-15 illustrates the NetFlow v9 and IPFIX packet format and the intermix of template and data FlowSets.

NetFlow Version 9 Packet Header Format (RFC 3954)
The NetFlow v9 exporter sends packets to collectors. These packets include template FlowSets, which define the following data formats by a set of field types and their lengths, and data FlowSets, which are sets of actual statistics. The NetFlow v9 exporter sends templates separately from (and less frequently than) data sets. There are other sets of template/data FlowSets called option template/data FlowSets, by which an exporter can send a collector metadata related to a NetFlow process.
IPFIX Packet Header Format (RFC 7011)
IPFIX is the IETF standard version of the Cisco NetFlow v9 protocol. The packet format is very similar with a few differences and additional features, such as variable-length records. IPFIX is especially required when URL collection is enabled. IPFIX is the default export protocol used in ezPM profiles.
Figure 10-16 illustrates the packet format and the intermix of template and data FlowSets.

Note
Set identifiers are used as follows:
![]() ID = 2 is reserved for template FlowSets.
ID = 2 is reserved for template FlowSets.
![]() ID = 3 is reserved for data FlowSets.
ID = 3 is reserved for data FlowSets.
The header follows the same format as prior NetFlow versions so collectors will be backward compatible. Each data record represents one flow.
Monitoring Exports
The command show flow export templates displays the template records exported from a router that has Flexible NetFlow or Performance Monitor configured with an exporter.
Example 10-18 provides an example of the templates exported from a router that has the FNF configuration defined in Example 10-6. The options templates are displayed (interface, application names, class map and policy map mapping tables), then the template for the RECORD-STATS record that was defined. These templates give the identifier and length of individual fields within a NetFlow data record.
Example 10-18 Templates Exported
R31-Spoke# show flow export templates
Flow Exporter EXPORTER-LA:
Client: Option options interface-table
Exporter Format: IPFIX (Version 10)
Template ID : 256
Source ID : 0
Record Size : 100
Template layout
_____________________________________________________________________________
| Field | ID | Ent.ID | Offset | Size |
-----------------------------------------------------------------------------
| INTERFACE INPUT SNMP | 10 | | 0 | 4 |
| interface name short | 82 | | 4 | 32 |
| interface name long | 83 | | 36 | 64 |
-----------------------------------------------------------------------------
Client: Option options application-name
Exporter Format: IPFIX (Version 10)
Template ID : 257
Source ID : 0
Record Size : 83
Template layout
_____________________________________________________________________________
| Field | ID | Ent.ID | Offset | Size |
-----------------------------------------------------------------------------
| APPLICATION ID | 95 | | 0 | 4 |
| application name | 96 | | 4 | 24 |
| application description | 94 | | 28 | 55 |
-----------------------------------------------------------------------------
Client: Option classmap option table
Exporter Format: IPFIX (Version 10)
Template ID : 258
Source ID : 0
Record Size : 300
Template layout
_____________________________________________________________________________
| Field | ID | Ent.ID | Offset | Size |
-----------------------------------------------------------------------------
| C3PL CLASS CCE-ID | 8233 | 9 | 0 | 4 |
| c3pl class name | 8234 | 9 | 4 | 40 |
| c3pl class type | 8235 | 9 | 44 | 256 |
-----------------------------------------------------------------------------
Client: Option policymap option table
Exporter Format: IPFIX (Version 10)
Template ID : 259
Source ID : 0
Record Size : 300
Template layout
_____________________________________________________________________________
| Field | ID | Ent.ID | Offset | Size |
-----------------------------------------------------------------------------
| C3PL POLICY CCE-ID | 8236 | 9 | 0 | 4 |
| c3pl policy name | 8237 | 9 | 4 | 40 |
| c3pl policy type | 8238 | 9 | 44 | 256 |
-----------------------------------------------------------------------------
Client: Flow Monitor MONITOR-STATS
Exporter Format: IPFIX (Version 10)
Template ID : 260
Source ID : 0
Record Size : 27
Template layout
_____________________________________________________________________________
| Field | ID | Ent.ID | Offset | Size |
-----------------------------------------------------------------------------
| ipv4 source address | 8 | | 0 | 4 |
| ipv4 destination address | 12 | | 4 | 4 |
| interface input snmp | 10 | | 8 | 4 |
| transport source-port | 7 | | 12 | 2 |
| transport destination-port | 11 | | 14 | 2 |
| flow direction | 61 | | 16 | 1 |
| ip dscp | 195 | | 17 | 1 |
| ip protocol | 4 | | 18 | 1 |
| routing next-hop address ipv4 | 15 | | 19 | 4 |
| counter bytes | 1 | | 23 | 4 |
-----------------------------------------------------------------------------
Monitoring Performance Collection on Network Management Systems
Network management systems used to collect FNF and Performance Monitor data must include a NetFlow collector that supports NetFlow v9 and IPFIX export protocols. These applications offer an effective way to monitor and control application performance leveraging Cisco capabilities.
Deployment Considerations
Application Visibility is commonly used in combination with other components of the Cisco IWAN solution.
Performance Routing
Performance Routing metric collection is based on Performance Monitor. When PfR is enabled on a router, it provides bandwidth statistics per traffic class and performance statistics per channel (refer to Chapter 7, “Introduction to Performance Routing (PfR),” for more details). This gives statistics between the border routers but does not provide granularity per application or connection. To have a deeper view and end-to-end visibility of the performance metrics, Performance Monitor with ezPM can be used to complement the metrics exported with PfR.
Interoperability with WAAS
Cisco WAAS provides WAN optimization and application acceleration. The IWAN architecture takes advantage of both AVC and WAAS WAN optimization. However, it is not desirable to run NBAR on the WAN interface because WAN optimization occurs first, so NBAR sees only compressed traffic and may not be able to properly see application traffic after WAAS is applied.
A general recommendation when NBAR is used is to use QoS without NBAR on the outbound interface, enabling NBAR on the LAN interface only to classify applications and mark the corresponding DSCP value. Figure 10-17 illustrates the use of NBAR with WAAS.

The Cisco IWAN Performance Collection solution operates closely with Cisco WAAS, reporting performance on both optimized and unoptimized traffic. Because optimized traffic may be exported twice (pre- and post-WAAS), a new segment field is exported within the record in order to describe the type of traffic at the monitoring location. Figure 10-18 illustrates the segment definitions.

Without WAAS, the router sees only one TCP segment. Figure 10-19 illustrates ART monitoring and export without WAAS.

When deploying Cisco WAAS with AppNav as the redirection protocol, AppNav creates two logical interfaces, AppNav-Uncompress and AppNav-Compress. Performance Monitor monitors traffic on the AppNav logical interfaces and exports two records. Figure 10-20 illustrates Performance Monitor with WAAS and AppNav.

If NBAR is enabled on the WAN interface, and WAAS is enabled, AppNav automatically runs NBAR on the AppNav-Uncompress virtual interface.
Summary
Application Visibility is a key component of IWAN to add application-level visibility to branch and WAN aggregation routers in an IWAN domain. Application Visibility recognizes and classifies thousands of applications and uses this classification to perform per-application monitoring of bandwidth statistics, of transactional ART metrics, and of media application metrics such as latency and jitter. The per-application metrics are exported via NetFlow v9 and IPFIX for analysis, reporting, and visualization by partner network management systems. Application Visibility is integrated directly into the Cisco devices with a next-generation passive monitoring engine called Performance Monitor. ezPM is the recommended configuration to enable Performance Monitor because it provides the Cisco recommended parameters and deployment options as well as a drastically reduced configuration.
Further Reading
Cisco. “Cisco Application Visibility and Control (AVC).” www.cisco.com/go/avc.
Cisco. Cisco Application Visibility and Control User Guide. www.cisco.com.
Cisco. “AVC Metric Definitions.” www.cisco.com.
Claise, B., ed. RFC 3954. “Cisco Systems NetFlow Services Export Version 9. IETF, October 2004. www.ietf.org/rfc/rfc3954.txt.
Claise, B., P. Aitken, and N. Ben-Dvora. RFC 6759, “Cisco Systems Export of Application Information in IP Flow Information Export (IPFIX).” IETF, November 2012. https://tools.ietf.org/html/rfc6759.
Claise, B., B. Trammel, and P. Aitken, ed. RFC 7071, “Specification of the IP Flow Information Export (IPFIX) Protocol for the Exchange of Flow Information.” IETF, September 2013. www.ietf.org/rfc/rfc7011.txt.
IANA. “Real-Time Transport Protocol (RTP) Parameters .” www.iana.org/assignments/rtp-parameters.
Quittek, J., et al. RFC 5102, “Information Model for IP Flow Information Export.” IETF, January 2008. https://tools.ietf.org/html/rfc5102.