
Most applications go through a series of pretests as developers put the pieces together. The development team wants to see how the pieces are going together and determine if they work well with each other. In addition, the development team wants to see whether the design is working at all. In some respects, the pretesting stage is curiosity. Most people who create something want to see how things are looking as they create it. A sculptor steps back to view a creation, a cook tastes to see how the ingredients taste together — a developer is no different.
Sometimes the pretests are more than simple curiosity, however. They serve an important purpose in making your application work as it should. The sculptor steps back and notices that part of the ear isn't formed correctly, the cook notices that the pinch of salt is missing — the developer sees that the application is lacking something that causes speed to suffer. The sculptor conforms, in some respects, to engineering standards and artistic norms, and the cook uses a recipe, but these design statements can't address the artistic part of each trade — the artist's eye and the cook's sense of taste prevail. Likewise, the seasoned developer follows the design and relies on best practices, but the pretest provides the artistic touch that defines the difference between an application that works and one that works well.
Fortunately, Microsoft provides some tools to make pretesting more practical. Yes, you could theoretically add counters to your application and run it through its paces while you watch it, using the Performance console found in the Administrative Tools folder of the Control Panel. However, using the counter approach is inconvenient and overly formal for the kind of testing you need to perform during development — that's why using the testing tools in Visual Studio is important. The Performance Wizard and Performance Explorer make the task of performing a pretest easier and more convenient. These tools let you take a little sample of your application to see how it works without going through a strict process. This chapter helps you understand speed as it applies to the development phase of your application.
Applications that run slowly aren't very useful. As described in Chapter 18, users expect speedy applications, as do your customers. Even managers expect applications that work efficiently, which includes running quickly. From the very first computer until now, speed has been an essential concern for every application. Even the fastest application can run faster still — no one's completely satisfied with the speed of any application. That said, most applications reach a point of acceptable or reasonable execution speed. After all, if the application spends 90 percent of its time waiting for the user to do something, making it faster probably won't result in any substantial time savings.
Too much speed can become detrimental. Like a recipe without salt or a statue with an ill-formed ear, the application that places speed over any other consideration lacks balance and will almost certainly fail. To put this issue in a different light, the application will taste bad to the user because it lacks the elements needed to provide everything the user requires. Most ill-advised speed trade-offs take two forms:
Missing code that the application doesn't require to perform a task, but does require to service user needs.
Code that the application requires to ensure the output is correct, even when this code isn't directly involved in performing the task.
The following sections consider these two forms of speed trade-off. When you read these sections, consider your current application design again. Sometimes a necessary element doesn't appear in a design and won't ever make it into the application as a result. Remember the cook adding salt to the dish and the sculptor refining the statue's ear. You may find that you must add a little salt to your application and refine it in other ways to give the user a good experience — sometimes sampling your application is the only way to see these needs.
As the development process evolves, developers often find that their code isn't as fast as expected, and because they're short on time they look for a quick fix that they hope no one will notice. For example, explanatory dialog boxes and progress information often disappear as unnecessary. In many cases, no one notices until the application is released and the user complains. If the person receiving the complaint is astute, they will probably notice the missing feature and wonder why it doesn't appear in the application as originally anticipated in the design. Whether the developers maintaining the application rely on the original design or duplicate someone else's tired solution, the feature ends up as part of the application anyway and someone else will have to come up with a way to produce more application speed with the feature in place. In short, cutting needed features will always cost the organization time and frustration because someone will eventually notice that they're missing and add them back into the application.
You might wonder whether there's ever a good reason to cut code, even seemingly unneeded code, to produce a speed gain. Most applications do have low-priority features that you can cut. The design document usually lists these features. However, you should never cut a feature from the design without first discussing the matter with the development team. Other team members may be relying on that feature for a particular need or have code they're required to create to support it. Unfortunately, cutting low-priority features almost never improves application performance in the right area. You normally end up improving your code in some other way — possibly by tightening loop code or relying on any of the myriad techniques that developers have used to improve performance for years.
Still, the temptation to find a quick fix is very high when the pressure to produce reams of code is high, so some developers will look at other areas. The second most common false cut is code that verifies data inputs to a method, checks user identity for each call, or performs some other background task associated with either application reliability or security. In many cases, these cuts go unnoticed until some foul person breaks into your system, steals your customer database, and promptly sends an extortion letter to your organization's owner. Although this may seem like a far-fetched result of removing a line or two of code, it happens nearly every day. You can't gain speed at the expense of necessary reliability or security features, even if you feel that no one will miss these features.
Novice developers often remove safety code from an application. For example, an application may include code to verify every data write by reading the data back and matching it to the original data. Such a check can reduce application speed, but it does ensure that the data you write actually makes it to the destination. Because such code is time consuming, the novice developer will eye it gleefully and remove it in a heartbeat. Months down the road, someone finds out that the data in the database is corrupted or missing completely. Removing safety code is never an option.
A final area where developers often err in removing code is in flexibility areas. A design calls for code to appear in a specific form so that the organization can reuse or repurpose the code later. However, developing code like this can reduce overall application speed. A developer may come along and place the code within the application or change it in other ways to make it faster. However, now the code is embedded in the application, so the organization can no longer reuse it. An ill-advised fix becomes a maintenance nightmare for the organization and eventually costs the company money when the code becomes unavailable for the next application.
One of the worst possible speed scenarios is when an application performs tasks extremely fast, but performs them incorrectly. Errors can range from subtle to gross, but they always affect the organization in some way and eventually someone sees them. Regrettably, the mistakes are often found only after the organization suffers from them in some major way — sometimes the error is so great that the organization doesn't recover. The consequences of any wrong output from your application can be severe enough to cause harm to someone, even if you can't see how that harm will occur.
The effects of error often snowball in ways that no one can determine in advance. For example, you may work for an organization that makes alarm clock software for digital clocks — nothing too dangerous in that, is there? However, because your software is off by a little and a hospital uses the digital clock to time doses of medicine, a patient receives their medication too late. The patient dies because your clock was off. Is this example a little extreme? Sure, but it illustrates a point. Every piece of software you create is important and must provide error-free results within your ability as a developer to produce them. You can't ever assume that a slightly wrong answer of any sort is okay.
When you must choose between speed and accuracy, accuracy should always win. Of course, in very exceptional times this rule doesn't hold. For example, if you're creating an application that calculates the distance between earth and another object in the universe, an error of an inch or so probably won't cause any problems for anyone. Some applications don't need to calculate a result to the nth degree simply because the result of the calculation is so huge that the tiny fractional error won't result in any harm to anyone and won't change the human perception of the results. Obviously, these situations are far and few between. Normally, you want as much accuracy as your application can provide to ensure precise output.
You can create code that performs a task quickly and still provides the right answer. In most cases, you can avoid disaster by using the following process:
Try various techniques until you find the fastest method you feel will work properly.
Verify the results locally. Make sure you test the results completely — even relying on inputs that you know you won't normally use. Test outside the box.
Have the results independently verified by another group in your organization.
If necessary, request that an auditor also certify the results. When you take this step, don't change the code again for any reason unless you get the auditor to verify the new code.
Test and monitor the code in a production setup to ensure users don't come up with some quirk that will cause incorrect output.
You have many options for measuring the speed of your application. However, most of these options only work well after you have the application in final form. What you really need is a method that works while you develop the application. Visual Studio provides some tools that make obtaining speed predictions easier while developing your application. The following sections describe these tools in detail.
Before you can measure the performance of anything, you need some sample code. The example includes two sections of code for comparison. Listing 19-1 shows the first sample.
Example 19.1. Displaying a list of files and file sizes
private void btnTest_Click(object sender, EventArgs e)
{
   // Obtain the starting time.
   DateTime Start = DateTime.Now;

   // Clear the listbox.
   lstOutput.Items.Clear();

   // Obtain a list of files to process.
   String[] FileList =
      Directory.GetFiles(
         Environment.GetFolderPath(Environment.SpecialFolder.System));

   // Get the filesize for each file.
   foreach (String ThisFile in FileList)
   {
      try
      {
         // Add the data to the list box.
         lstOutput.Items.Add(
            "Name: " + ThisFile + " Size: " +
               File.OpenRead(ThisFile).Length.ToString());
      }
      catch (IOException IOE)
      {
         // Add the data to the list box.
         lstOutput.Items.Add(
            "Name: " + ThisFile + " Error: " +
               IOE.Message);
      }
   }

   // Obtain the ending time.
   DateTime End = DateTime.Now;

   // Display the time difference.
   TimeSpan Difference = End - Start;
   MessageBox.Show("Processed " +
      FileList.Length.ToString() +
      " Files In " + Difference.TotalSeconds.ToString());
}
The example isn't very complicated, but it'll do the job. In this case, the example begins by obtaining the starting time. It then clears the list box used for output data and collects a list of the files to process.
The example uses the Environment.SpecialFolder.System folder because it usually contains a lot of files so you can see performance differences between two processing techniques without using extra code.
The next step is to process the files. In this case, the example uses the File.OpenRead(ThisFile).Length.ToString() method to obtain the size of each file. The second sample will use a different technique. Because this method can generate an IOException exception when a file is busy, you must place it within a try...catch block.
The code ends by obtaining the ending time, finding the difference, and displaying it in a message box. You see the time used to execute the example on screen, along with the list of files in lstOutput. The first time you run this code, the execution speed will lag. You have to expect this problem from some code because Windows needs to fill a cache or some other action must occur the first time (such as compiling the assembly). The first run of this code on my machine is 35.519 seconds. However, the second run is a mere 0.515625 seconds.
It's possible to improve on the initial processing time using a different approach to obtaining the file size. The example contains a second sample that uses the processing technique shown here:
// Get the filesize for each file.
foreach (String ThisFile in FileList)
{
   // Create an object to store the data.
   FileInfo FileData = new FileInfo(ThisFile);

   // Add the data to the list box.
   lstOutput.Items.Add(
      "Name: " + ThisFile + " Size: " + FileData.Length.ToString());
}
Everything else about the sample is the same. Notice that this example creates a special FileInfo object, FileData. This new technique doesn't require a try...catch block because it doesn't generate an error if a file is busy. When you run this example, you'll see a performance improvement. The run time now is a svelte 0.3125 seconds, or a 39.39 percent improvement.
A release build will generally run faster than a debug build. Make sure you run the two samples consistently — either both as release builds or both as debug builds. Otherwise, you'll receive inconsistent results.
The Performance Wizard is the first stop for seeing how your code will work. You can choose to explore application performance using one of two approaches:
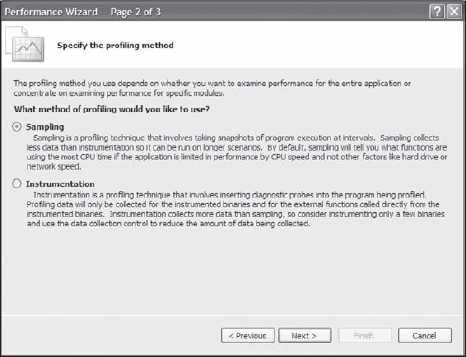
Sampling: Use this approach when you want to check the performance of the entire application. The sampling approach takes a snapshot of your application at intervals. It doesn't collect as much information as the instrumentation approach, so you can use the sampling approach for a longer duration. However, because the sampling approach stores less data, it doesn't provide a good view of individual modules.
Instrumentation: Use this approach when you want to check specific methods within your application. When using the instrumentation approach, you insert diagnostic probes into the code, so the performance monitoring is extremely targeted. The instrumentation approach collects detailed data about the instrumented binaries and the external binaries they call. Because of the large amount of data this approach collects, you may want to limit data collection using the Data Collection Control explained later in the chapter.
Not all versions of Visual Studio have the performance tools described in this and other sections of the chapter. These sections assume that you're using the Visual Studio Team System Development Edition (or a similar high-end edition that includes the performance tools).
It's time to see how these two approaches work with the example program. The following steps show how to configure the sampling and instrumentation approaches using the Performance Wizard:
Choose Analyze

Select a target for your performance check. If you choose your application, go directly to Step 4. The Profile an Executable (.EXE), Profile a Dynamic Link Library (.DLL), or Profile an ASP.NET Application options require an additional setup step.
Click Next. You'll see target-specific information you must provide. Figure 19-2 shows how the information appears for an executable. The information for a DLL is similar. When you choose the Profile an ASP.NET Application option, all you must provide is an URL for the application. Fill out the information required to locate and execute the target you want to profile.
Click Next. You'll see the Select the Profiling Method dialog box shown in Figure 19-3. This is where you choose between the sampling and instrumentation approaches. Note that if you're working with an executable, DLL, or ASP.NET application, the title bar will say Step 3 of 4.
Select Sampling (for full application profiling) or Instrumentation (to profile individual modules) and click Next. You'll see a summary dialog box that tells you about the selections you've made. Verify that the selections are correct. Click Previous if you find some of the information is incorrect.
If you choose the wrong approach, you can modify it by changing the option in the Method drop-down list box of Performance Explorer. Simply complete the wizard and modify the method as needed. You can also use this approach to switch between the sampling or instrumentation approaches as needed.
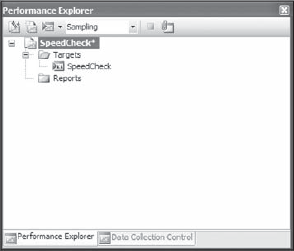
Click Finish. You'll see the Performance Explorer window shown in Figure 19-4. You're ready to begin profiling your application. The "Profiling Performance" section of the chapter tells you how to begin the profiling process. The "Viewing Performance Results" section of the chapter tells you how to interpret the results using Performance Explorer.


In most cases, you'll want to provide some special setups to profile your application. This means setting up features in Performance Explorer to ensure the profile works as anticipated. If you haven't already created a performance session using the Performance Wizard as described in the "Launching the Performance Wizard" section of this chapter, you'll need to create a new session using the technique described in the "Starting a New Performance Session" section that follows.
Once you have a performance session in place, you can configure the individual targets to provide specific input to the applications. It's also possible to limit the amount of data the instrumentation approach collects. Finally, if you really want to check out one of the more interesting features of the performance session, try connecting to a running application. The following sections describe how to perform these setups.
If you don't use the Performance Wizard to create a new performance session, you must create one manually. The following steps describe how to create a performance session manually.
Choose Analyzer
Right-click the Targets folder and choose one of the options on the context menu. You have the following choices:
Add Target Binary: Adds the current project, as shown in Figure 19-4. You don't have to supply any additional information when adding this option.
Add Target Project: Displays an Add Target Binary dialog box where you can choose the executable that you want to target. Simply select the EXE, DLL, or OCX file that you want to work with.
Add Existing Web Site: Displays an Add Existing Web Site dialog box where you type the URL for the Web site you want to test.
Perform Step 2 as often as necessary to add all the targets you want to monitor. That's right; you can add as many targets as desired and profile them all. Of course, the targets should be part of one application.
Choose either Sampling or Instrumentation in the Method drop-down list box. The performance session is now ready to configure.

If you highlight a target in the Performance Explorer window, the Properties window will show you some information about it, but won't let you modify any of the characteristics of that target. In order to change the characteristics of a target, right-click its entry and choose Properties from the context menu. You'll see a <Target> Property Pages dialog box like the one shown in Figure 19-6. This dialog box contains three pages you can use to configure the target, including the way that Visual Studio launches the target. This particular feature is especially important for console applications, because you have to provide command line arguments to obtain useful information from a console application. The default setting simply executes the application. To add command line arguments, check Override Project settings, as shown in Figure 19-6, and type the arguments in the Arguments field. You can also change the working directory, as needed, to ensure that the executable can access its data as intended (some applications require a specific working directory).

If you're using the sampling approach, the Launch page is the only one you should change, because the other settings don't matter. However, if you're using Instrumentation, you'll want to view the settings on the Instrumentation and Advanced pages. Figure 19-7 shows the basic instrumentation settings.
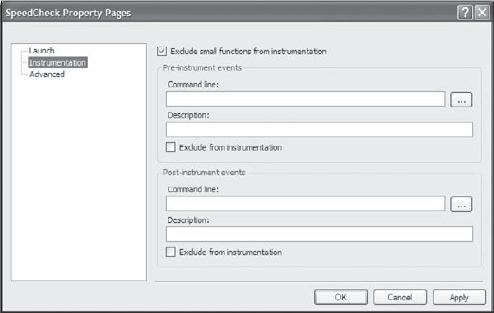
When you use the instrumentation approach, the IDE checks the Exclude Small Functions from Instrumentation option by default. Unfortunately, nowhere does Microsoft define small. You won't find anything that specifies small in the documentation or online. However, this blog entry gives the best description of the setting:http://blogs.msdn.com/profiler/archive/2008/07/08/excluding-small-functions-from-instrumentation.aspx. Essentially, the setting excludes any small function (method) that doesn't make calls — it's a leaf function. Consequently, when you check this option, the instrumentation approach normally won't record data for property getters and setters, among other small functions.
The other entries on the Instrumentation page are for pre-instrumentation and post-instrumentation events. The pre-instrumentation events occur before you begin the instrumentation monitoring and the post-instrumentation events occur after you stop monitoring. In both cases, the system lets you specify special commands to run. By checking Exclude from Instrumentation, you can prevent these commands from appearing as part of the report.
The Advanced page contains a single field where you type special options that Visual Studio uses to fine-tune the instrumentation approach. These settings won't affect the sampling approach results. The basic use of these options is to control the amount of data that appears in the instrumentation report as described in the article entitled, "How to: Specify Additional Instrumentation Options" (http://msdn.microsoft.com/en-us/library/ms182382.aspx). The options you can provide are the same as those supported by the VSInstr command line tool. You can find a listing of these options at http://msdn.microsoft.com/en-us/library/ms182402.aspx.
Now that you have a profiling session configured, you can run it. Performance Explorer provides two options for running your profile:
Launch with Profiling: The logger engine starts immediately recording performance data from your application, which means that you see all the startup code associated with your application as part of the profile report.
Launch with Profiling Paused: The application starts, but the logger engine doesn't. Data logging doesn't begin until you specifically start it by clicking Resume Collection in the Data Collection Control window. Using this option lets you obtain a subset of the normal performance data, making it easier to locate precisely what you need, but making the report less useful for long-term analysis.
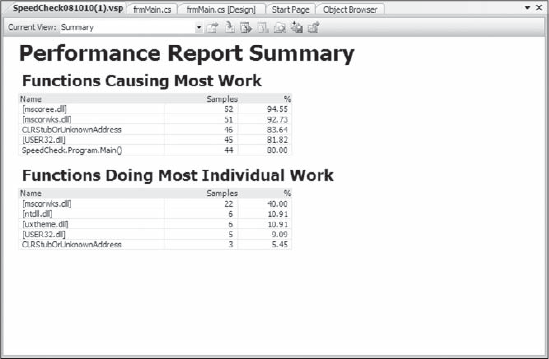
Choose either of these options from the drop-down list box associated with the Launch with Profiling button on the Performance Explorer toolbar. To start the process, choose either of these options. You can exercise your application at this point to see how things work. When you get done, you can close the application as usual. At this point, you'll see a report appear on screen. Figure 19-8 shows the Summary page of this report, which is the first page you see. The "Viewing Performance Results" section of the chapter describes how to work with the report.
The Data Collection Control window is an integral part of performance monitoring within Visual Studio. However, when you first view it, you might be distrustful about the value of this feature because its value isn't evident. In addition, Microsoft stuffs the window with useless entries that don't tell you anything about using the window. The Data Collection Control window always appears with Performance Explorer as a second tab. The IDE automatically selects this window for you when you launch the performance session.
However, before you run anything, you should configure this window with something more useful than what Microsoft has provided, as shown in Figure 19-9, for the sample application. In this case, you see the three method names that you'll see filtered in the "Viewing Performance Results" section of the chapter. These entries represent marks that you'll place inside the performance report as described later in this section. For now, remove all the marks that Microsoft provides by highlighting the mark and clicking Remove Row (the red X). Add the three rows shown (or any rows required for your application) by clicking Add Row (the yellow plus sign) and typing the name of the mark. It's a good idea to use something you recognize, such as a method name.

You need to know what the sample application looks like to understand how the marks are used. Figure 19-10 shows the sample used for this example. It contains three buttons, as shown, which call the methods shown in Figure 19-9. The list box displays the application output.

Now that you know about the marks and the application features, you need to know how to connect them. Here's how you'd use these marks for the sample application shown in Figure 19-10.
Start the application by clicking Start with Profiling in the Performance Explorer window.
Highlight
btnTest_Click()in the Data Collection Control window and click Insert Mark (the blue right-pointing arrow). Notice that the count for thebtnTest_Click()mark increases by one.Click Test in the Performance Checking application. When you see the results dialog box, click OK.
Highlight
btnTest2_Click()in the Data Collection Control window and click Insert mark. The count for thebtnTest2_Click()mark increases by one.Click Test 2 in the Performance Checking application. When you see the results dialog box, click OK.
Highlight
btnQuit()in the Data Collection Control window and click Insert mark. The count for thebtnQuit()mark increases by one.Click Quit. The application ends and you see the report. At this point, you can filter the report using the marks you creating as described in the "Viewing Performance Results" section of the chapter.
You don't have to rely on starting your application in Visual Studio to use performance monitoring. It's possible to attach to any running application and monitor its performance. Simply click Attach/Detach in either the Performance Explorer or Data Collection Control windows. You'll see the Attach Profiler to Process dialog box shown in Figure 19-11.

When you get done profiling the application, you can close the application and see the report as usual. As an alternative, you can reopen the Attach Profiler to Process dialog box, highlight the application entry, and click Detach. Even though the application is still running, you'll see a report of the application's performance. When using this approach, you still have full access to the filtering and other features of Performance Explorer.
At this point, you have a report sitting in front of you. Visual Studio selects the Summary page, as shown in Figure 19-8, by default. However, the report contains a wealth of other pages as described in the following list:
Summary: Presents an overview of the application, showing which methods cause the most work and which functions perform the most work.
Call Tree: Displays a list of the calls made during the performance evaluation. Interestingly enough, the report includes both managed- and native-code modules. For example, you'll see calls to
User32.DLL. Consequently, this report is helpful in seeing how your application interacts with Windows.Modules: Shows all the modules called by the application, including native-code modules. For example, you won't be surprised to learn that your application calls on
ComCtl32.DLLfor any common controls that it uses. However, it's interesting to know how much time your application spends working withComCtl32.DLL.Caller/Callee: Helps you see the relationship between callers and callees in the application. You start at the top of the stack. Double-clicking an entry in the Functions That Were Called By list takes you down one level in the stack, while double-clicking an entry in the Functions That Called list takes you up one level. In the center, you see the Current Function list, which always contains a single entry for the module you've selected.
Functions: Displays a list of all of the functions called by a particular application. When the profiler can't determine a specific function name (as with a native code module), it shows the module name instead. When you double-click one of these entries, the IDE presents the Caller / Callee page so that you can see the relationship between the selected function and other functions that application accesses.
Marks: Presents a list of the marks you made within the profiler file and when you made them. You can use this part of the report when creating filters for making the report more readable.
Process: Shows a list of the processes used to execute the application. Of course, your application is one process. However, you'll normally see
_CorExeMain(seehttp://msdn.microsoft.com/en-us/library/xh0859k0.aspxfor a description of this entry) andMSCorWks.DLL(part of the Common Language Runtime, CLR) as well. The entries tell the process identifier (PID), start time, and end time.If you're interested in how the low-level hosting works for CLR, the article at
http://msdn.microsoft.com/en-us/magazine/cc301479.aspxdescribes how to create a custom host. Even if you don't implement a custom host, the article is helpful in explaining how hosting works.Lines: Displays a list of source lines executed during sample profiling. This particular page isn't useful when using the sampling approach because the sampling approach looks at the whole application. You may not even see some methods listed in the report.
IPs: Displays a list of specific instructions executed during sample profiling. This particular page isn't useful when using the sampling approach because the sampling approach looks at the whole application. You may not even see some methods listed in the report.
When you start looking through a report, the first thing that will hit you is that it contains a lot of information, probably more information than you ever wanted to see.
Filters are an essential part of working with the reports generated by the profiler. Without filters, you can spend hours trying to find what you need and still not find it. Visual Studio supports a wealth of filters, but you use them in the same way:
Click Show Filter on the report's toolbar. You'll see a new pane in the report window, as shown in Figure 19-12. The figure shows the filtering criteria used for the sample application.
Enter the filtering criteria. You have a lot of choices. The example uses the Mark Name field (see the "Using the Data Collection Control" section of this chapter for details). However, you can also filter by specifics such as the process or thread identifier, as well as by statistics, such as the time as a percentage.
Click Execute Filter. This act applies the filter to the report so that you see only the data you want. In this case, the report has far fewer items to consider in the Call Tree report shown in Figure 19-12. Filtering eliminates unneeded data, even though the data still exists in the background.
Choose the report page you want to review from the Current View drop-down list.

The Call Tree page is probably the most difficult to use because it contains an exceptional amount of information. Visual Studio provides a special feature to help with this particular page. Click Expand Hot Path and you'll see the focal point of the report, as shown in Figure 19-13. The flames next to btnTest2_Click() and btnTest_Click() show that these are the hot-path items. You can remove the highlighting shown in Figure 19-13 by clicking Show Hot Path Highlighting.
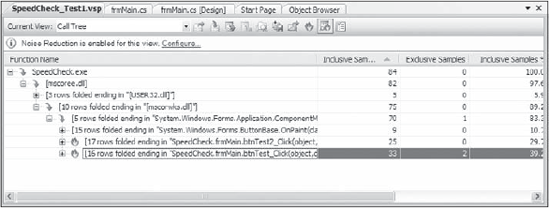
By default, Visual Studio enables a feature called noise reduction for your reports. Noise reduction removes entries that fall below a certain threshold, so you don't have to wade through reams of useless information. In fact, the top of the report includes a notice: Noise Reduction is Enabled for this View. It also has a Configure link. When you click the link or choose Analyze

As shown in Figure 19-14, noise reduction involves two kinds of special filtering. First, you can enable trimming, which removes any entries that fall below a certain threshold value. The default setting removes entries whose Inclusive Samples % value falls below 3 percent. Unfortunately, the only Value entry is Inclusive Samples %, so you have to wonder why Microsoft even included the drop-down list box. Perhaps they plan to allow other options later. In most cases, you won't disable this option unless you really want to delve into the innermost workings of your application.
Second, you can enable folding. Folding merges entries that fall below the Inclusive Samples % level. Merging means that you're really seeing the output of multiple entries as a single entry. In some cases, you want to see these entries (such as when you're relying on native-code modules to perform certain tasks), so you'll clear the Enable Folding option. As with Enable Trimming, you don't have any options other than Inclusive Samples %.
As you work with your code, you'll want to see how the changes you make are affecting speed. Of course, you could go through the mind-numbing process of comparing numbers manually, but Visual Studio offers a better option. You can use Visual Studio to perform the task for you. To start this process, choose Analyze

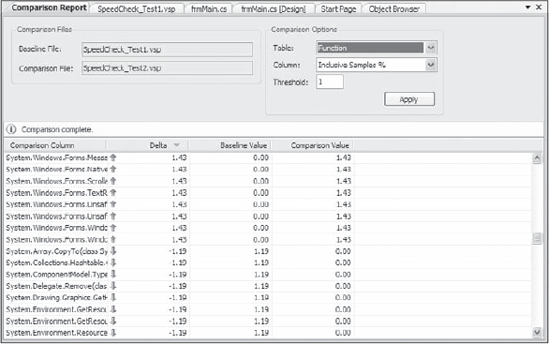
The Baseline File entry is the file you saved from your first run of the profiler. The Comparison File entry is the current run, the one that has the improvements you made. After you add the two files, click OK and Visual Studio creates a report similar to the one shown in Figure 19-16.
The comparison shows only the items that have changed. An up arrow shows an improvement, while a down arrow shows a place where application performance needs to improve. You can choose one of four tables to view:
Function
Module
Line
IP
These tables correspond to the pages of the report with the same name. You can also choose the column to use for comparison purposes and the threshold to use for the delta between two tests. The Threshold field is exceptionally important. If you set this value too low, you'll see items that vary only because of a natural variance during tests — in short, you're seeing noise. If you set the value too high, the comparison won't show you places where you really have experienced a positive change. In some cases, you'll need to set the threshold at 10 or so in order to filter out enough noise to obtain a useful comparison.
This chapter considers the role of speed during the development phase of your application. It demonstrates techniques you can use to sample the application to determine whether you have the correct mixture of elements in place to produce an overall pleasing application. However, it's important to remember that sampling takes time and too much sampling is as bad as not enough. In most cases, you want to sample the application enough to ensure that when you begin the testing phase you won't encounter any nasty surprises.
Sampling the speed of the modules that will eventually make up the application you're building is important. Of course, you want to satisfy your curiosity, but it's also important to verify that your application is on track. Sampling serves a social function as well as a technical need. People want to demonstrate that they are creative and that they're finding new techniques that serve the project and the organization as a whole. When you create the schedule for your application, make sure you set aside sampling time. Otherwise, you may find that your development team is significantly less creative than it could be.
It's important to remember that this chapter is the first of three components of your performance triangle. Speed is important, but not to the detriment of the other two performance components. Chapter 20 presents the second leg of the triangle, reliability. In most cases, you must measure speed against reliability to ensure that changes you make don't cause your application to fail. Speed is useful only when it doesn't affect application output and won't create unsafe situations for your data. Chapter 20 helps you understand this relationship and shows how to move your application in the right direction.