
Chapter 5
Shopper Nation: Why We Buy or Don't Buy
We are a nation that likes to shop. Consumer spending represents about 70 percent of the annual U.S. gross domestic product of $16 trillion, the largest in the world.
Americans purchase all sorts of goods, such as vehicles, computers, houses, and clothing. But we also buy services such as health care, hotel rooms, and restaurant meals. In fact, two-thirds of all spending and over 45 percent of the economy consists of purchases of services.1
But the decision whether to buy something is complex. Anyone making a purchase has to decide if they can afford it. When was the last time the boss promised a raise? If there isn't enough money in the wallet or checking account, is it worth pulling out the credit card?
The decision to use the credit card or taking out a loan to buy a car may entail how confident the consumer is in having a job in the future. Or maybe the purchaser has assets that are rising in value—a stock market portfolio or a house—so the job may not be as important. And if the consumer is approaching the so-called golden years, perhaps more of the spending will go toward health care or cruises and less on new sports cars or the latest smartphone.
In this chapter, we look at how the economic environment interacts with this critical part of the economy.
What Causes the Itch to Spend?
At 10:30 A.M. on a steamy mid-July day, consumers are starting to stream into Macy's Herald Square flagship store in midtown Manhattan. Some head for the men's floors, where Polo shirts, Calvin Klein shorts, and Alfani T-shirts are reduced by 25 to 40 percent. Others head for the women's floors, where the savings on such brands as DKNY, Ralph Lauren, and Style & Co. are equally as tempting.
Are the buyers in the store because the major retailer is holding a big well-advertised annual summer sale to make room for fall sweaters and jackets? Or are consumers shopping because they feel better about their own personal economic prospects?
Economic theory tells us for most consumers, what matters the most when considering purchases is wage and salary gains. The faster worker compensation rises, the better off households will be and the more they can spend. That would trigger more demand and more hiring, and you would think the economy would be off to the races. However, that's not what's been happening in the United States since the economic downturn.
One organization that has been chronicling eroding wages is the National Employment Law Project (NELP), which has a relatively long history of involvement in labor issues. NELP was founded in 1969 to provide legal assistance on employment issues as social changes began to convulse the nation. The organization then evolved into a legal services backup center that provided legal expertise on specific issues such as jobs for health care workers. But President Reagan went after such legal groups who received taxpayer funding. And after Congress took an axe to paying for the law groups, NELP evolved even more into a center that received a lot of its funding from foundations and did labor research and assisted grassroots groups involved in labor issues such as helping vulnerable immigrant day workers.
For the period 2009 to 2012, NELP found that real median hourly wages declined by 2.8 percent across 785 occupations. Even the workers in the highest-paying occupations, where median hourly wages ranged from $30.47 for the lowest-paying job category to $83.33 for the job that paid the most, saw their wages drop by 1.8 percent over the time period.
However, it was far worse for lower and mid-range occupations such as hairdressers, butchers, and school crossing guards. In the quintile of occupations where median wages ranged from $10.61 per hour for the lowest-paid position to $14.21 per hour in the highest-paid occupation, real wages fell by 4.1 percent between 2009 and 2012.2
Ironically, while wages were falling the most for lower- and midrange workers, another NELP analysis looked at where the new jobs were being created. In the first two years of the economic recovery, low-wage occupations accounted for 21 percent of job losses but 58 percent of the jobs added. By way of contrast, mid-wage occupations such as municipal employees had 60 percent of the recession losses but only 22 percent of the jobs created in the recovery.3
“So what our studies show is that at the same time that we have disproportionate job creation in low-wage jobs, we've also seen the wages decline in these low-wage jobs,” says Christine Owens, executive director of NELP
Owens's pathway to NELP has taken her from the University of Virginia Law School to civil rights battles and women's issues. She eventually ended up at the AFL-CIO, where she became director of public policy. But she says her special concern has been low-wage and unemployed workers, which led her to NELP in 2007, when they were looking for a new executive director.
From her perspective, one of the major reasons why there has been a significant increase in people working in low-wage jobs is the oversupply of people desperate for income and willing to do any work. “It is just a matter of economics; the large number of people looking for work will drive down wages,” she says. And when they do find work, many are starting at either the minimum wage or a wage that uses the minimum wage as a base.
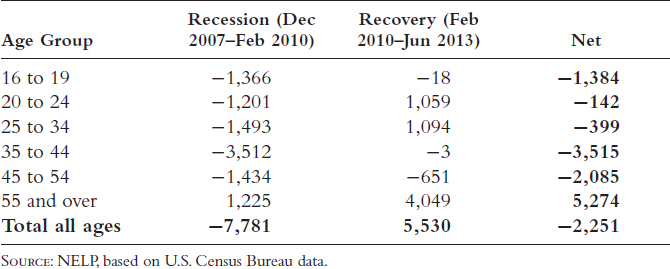
Table 5.1 Older Workers Get the Jobs
Owens, who has been arguing for an increase in the minimum wage for years, notes the lowest of wages—$7.25 per hour as of mid-2013—has not kept up with inflation or productivity. “So that basic wage floor has eroded,” she says. “It does not create that kind of upward lift that is needed to keep wages at the bottom of the labor market up.”
Who is taking many of those low wage jobs? Most of the job gains since the recession have gone to people aged 55 and older who have seen a 20 percent net increase in jobs between December 2007 and June 2013—a period that includes the recession and recovery—according to a NELP analysis of U.S. Census Bureau data (see Table 5.1). The older workers are the only age group that has gained ground since 2007. They are showing up in grocery stores, retail chains, and fast food establishments.
Seniors Get the Jobs but the Pay Leaves Many Cold
Griffin Coxey is a 57-year-old who drives a forklift, and his situation is an example of what has happened to many people 55 or older who have lost their jobs.
Coxey has worn a white collar for most of his work life as an accountant and company controller (basically, the chief accounting officer) in the Sheboygan County, Wisconsin, area. He has both a bachelor's degree and a master's in business administration. But despite his long experience and education, after he got laid off from his last full-time controller's job in October 2010, he says he could not find anything until he landed a $9.25 an hour job at Home Depot. “Eventually you just get tired of sitting around,” he says.
But there is a cost to taking a relatively low-paying part-time job. He estimates his family income—his wife works, too—has dwindled from $60,000 to $35,000 to $40,000. The shrinking of their income means they have to be very careful how they spend their money. “It is almost like going on retirement, living on a fixed income is what it is,” he says. “You know we never did live extravagantly anyway, so we can keep our house, but the vacation that we wanted to take—we can't take the vacation.”
But it goes beyond vacations. His son is getting married in 2014, and he won't be able to help out financially as much as he would like. His 2005 Hyundai has 110,000 miles on it, and he's not sure how he will pay for a car to replace it. Eating out a restaurant and going to movies are rare occurrences. “We make just enough to get by, but there's no extras,” he says.
And Coxey is far from alone—especially where he works. He says his Home Depot is stocked with lots of people who are starting to get silver hair. “You would not believe how many people are like me—and I'm not criticizing Home Depot because they gave me a job when no one else would,” he says. “I actually really love the work. I learned to drive a forklift, and I never thought I would be driving a forklift. The store treats you really good, but the only thing I don't like is the money.”
All that we need for a great economy is for businesses to pay their workers more and more, right? Not so fast. There is a natural tension between corporate earnings and wages. The more workers are paid, the less that is left over for profits, everything else held constant.
That is where the business cycle comes in. When growth is strong and unemployment rates are low, there are not a lot of people out there looking for work who have the skills a company wants. Expanding the workforce becomes difficult. Consequently, firms have to bid up wages to get the employees they want and need. They often have to pay up for workers employed in other companies in order to get them to switch positions. That is when workers do really well. Labor has the upper hand, and workers shop their skills around, getting the best deal they can.
But the pendulum swings, and when the economy is expanding modestly and unemployment rates are fairly high, there is little reason for businesses to pay their workers a top salary. There are also a lot of skilled, experienced people beating the bushes for jobs. Businesses have the upper hand when there are many applicants for any position. Firms make use of that power position to limit labor income growth.
The importance of where you are in the business cycle, or context of economic activity, was no clearer than in the recovery from the Great Recession. Unemployment rates hit double digits, and the slow recovery kept rates high for an extended period. There were so many people looking for work that firms could essentially pick and choose as they pleased. Essentially, a job candidate had to have the right skills and enough experience to warrant an interview, let alone get an offer. There was minimal pressure on businesses to raise wages, and they didn't.
If businesses don't give their workers salary increases, there are real costs to the economy. Even with the prices of things people buy rising very slowly (i.e., inflation), people could not afford a lot of additional goods because of the stagnant income growth. Household buying power, which is compensation after price increases are taken into consideration, grew at an extremely sluggish pace.
Indeed, after declining in 2009, real or inflation-adjusted compensation per hour was essentially flat for four years. It is hard to generate strong growth, which would be above 3 percent if incomes and purchasing power are going nowhere.4
So why don't firms simply raise wages, since it will cause the economy to grow faster and ultimately help the company? There is a little issue that we can ascribe to what economists call “The Free Rider Problem”: that is, if everyone else does something and I don't, I will benefit the most without paying the cost.
Basically, it could be really great for the economy if all firms gave bigger pay increases. As wages rise, so would consumer demand, output, and ultimately employment. But if I were a business owner or executive, it would be very beneficial if I held my costs down and did not pay higher wages. That would give me a competitive advantage. So my best move would be not to raise wages. Essentially, I get for free what every other firm gets by paying higher wages.
Clearly, that is not sustainable. Each firm acting individually would make that same calculation. Indeed, if just one company raises wages and no one else follows, that company will lose. It will be paying higher wages, but it will have no impact on national income. Meanwhile, competitive companies will have lower costs, giving them a cost advantage. Since it makes no sense for any one firm to start raising wages faster unless circumstances require them to, wages will not rise faster. That creates a Fallacy of Composition: what is good for one firm (not raising wages) is not good for the economy as a whole.
Sluggish economic growth leads to limited job gains, which causes the unemployment rate to decline minimally which keeps wages down. Limited wage increases produce lackluster consumer spending, which gets us back to the beginning—sluggish economic growth. The only way out of this “growth trap” is for the unemployment rate to fall over time to a level where labor becomes scarce and firms must bid up wages. As we saw in the first half of the 2010s, that could take a long time.
If anyone is wondering why the recovery from the Great Recession was so tepid, one place to look is at the growth trap. Yet the economy continued to expand despite the issues with limited income growth. Consequently, there must be other factors involved with household decisions about how much to spend.
The reality is that two households, even if they have the same income, may buy different things and spend different amounts. Income just provides a baseline for spending. It is those variations between individuals and income groups that drive the economy. This is where factors such as confidence, wealth, and debt come into play.
That it is not just the money you make that determines what you spend is a reminder that context is the most important factor in economic activity. Thus, in order to understand if people want to shop till they drop or drop shopping, we need to look at things such as consumer attitudes, what is happening to the value of their investments, including the prices of their homes and where people may be in their lives. All these come together to determine consumer spending and ultimately, for a consumer-based economy, economic growth.
“Charg-It”
Income is only one aspect of the ability to purchase things. Despite worker income's falling during the recovery from the recession, the economy continued to grow. Consequently, there must be other factors involved with household decisions about how much to spend.
One of those factors is debt.
The bank-issued credit card has changed the way many of us live. But, who created it and where did they do it?
Try a young banker from Brooklyn.
Anyone who wants to find the birthplace of the first bank credit card type of system has to go to Flatbush Avenue, deep in a neighborhood full of Caribbean accents.
Looking for a bank? Long gone. Instead, search for a store that sells furniture and appliances.
Inside the Fulton Stores on Flatbush Avenue is an artifact that gives a clue as to what used to be in the building: a large, round, steel bank vault—the type featured in bank robbery movies and still used by fiduciary organizations to illustrate the safety of their deposits. Instead of money and valuables, the vault holds a queen-sized bed with tan-and-red-striped reading pillows and assorted vanities and dressers—all for sale, of course.
The vault once belonged to Flatbush National Bank, which proudly ran ads in the spring of 1945, calling itself “the only independent commercial bank in Flatbush.”5 The Flatbush bank was run by John Biggins, a manufacturer who went into banking in 1927, only two years before the great stock market crash and the Great Depression.6
Around 1946, Biggins's son, John C., came up with the idea that changed personal finance: merchants and customers could sign up for something called “Charg-It.” He had observed that local merchants were losing business to the downtown department stores, which offered credit. So why not offer a system that the smaller local merchants could use to entice consumers to shop local and the bank could supply the credit instead of the shop?
If bank retail customers passed a credit bureau check, they would receive a “Charga-Plate,” writes Louis Hyman, the author of the book Debtor Nation: The History of America in Red Ink. They could use the Charga-Plate at any store that took it. The merchant sent the receipts to the bank and received their money the same day. If consumers did not pay their total bill, they were charged an annual rate of 6 percent, Hyman writes. Merchants gave up 8 percent of each purchase to the bank.7
Yes, a credit card system that worked at more than one establishment had been born. Fast-forward from Charg-It to 2013. About 75 percent of Americans have a credit card. Consumer revolving debt—in large part, credit card debt—was over $850.00 billion in 2013, according to the Federal Reserve Board.8 Divided by the population of 315 million, this comes to almost $2,700 dollars for woman, man and child in America.
When we look at just households, the numbers are even more amazing. The average American credit card-holding household has credit card debt of about $10,550. Finally, if you really dig deeply into the number, as some analysts have done, and look only at households that carry balances, he average outstanding balance could be over $15,000.9
For those who do have a credit card, there are myriad options. There are standard credit cards available from most banks. There are credit cards with rewards programs such as cash back or cards that allow a user to earn points for an airline or hotel. Places such as Disney have cards that require points to be redeemed at specific retailers. There are even cards for people with bad credit or for students who have a short credit history.
By 2000 there were so many different variations on cards that John Oldshue, a meteorologist for an Alabama television station, decided to try to make it easier for consumers to compare interest rates and card terms by developing a web site called LowCards.com. While it may seem like a strange business for a weatherman, Oldshue had done the same thing in 1999 for long distance telephone plans.
Oldshue and his wife needed a long-distance calling plan and found there were 200 options out there, recalls.
Bill Hardekopf, a partner at LowCards, which is based in Birmingham, Alabama. “He researched what the best plan was and put that up on a web site so he could share it with his friends. That developed into a business that was called SaveOnPhone.com.”
Within a year, Oldshue and Hardekopf were analyzing the growing credit card business, looking at about 1,000 credit cards to see what was new and what trends might be developing. From some 14 years of studying the industry, Hardekopf thinks the main reasons why people carry credit cards is to avoid the need to carry lots of cash and to buy things that they may not have the money for at that moment.
But he thinks there are yet other reasons people are pulling out the plastic: some like the rewards, such as cash back or the possibility of air travel; others like the protections that come with using a credit card. And at the end of the year, he says, “It's a great accounting system, since at the end of each month you get an accounting of all the purchases you have made on your credit card, so it makes it easier to do your taxes or keep a budget.”
But does their credit card usage vary depending on the state of the economy? In other words, do people look around themselves and ask, “Is this a good time to charge something?” Probably not directly, says Hardekopf. Instead, he thinks credit card usage relates more to how people view their own personal finances.
“I think people make decisions based on their own personal financial scenarios,” he says, but adds, “the overall economy can affect their personal finances.” For example, if a worker has had his or her hours cut back or been laid off, the odds are good they will cut back on their credit card use.
And, indeed, that is what has happened since the economic downturn. Between 2008 (the peak in credit card usage) and 2011 (the bottom), the total amount of revolving debt (mostly charges on credit cards) had dropped 17.5 percent, according to Federal Reserve statistics.10
“I think people have tightened their belts,” says Hardekopf, “And I think people got used to not putting a lot of transactions on their credit card or running up a lot of credit card debt.”
Back in Brooklyn, Biggins's effort to market Charg-It was shortlived. In 1946, his father sold Flatbush National to Manufacturers Trust, which promptly shut down the card system, according to Hyman's book. The son moved to New Jersey and restarted the credit card scheme at Paterson Savings and Trust Company, where Biggins became head of the personal loan department.11
Manufacturers Trust later became Manufacturers Hanover Corporation, which was then purchased by Chemical Banking Corporation. Chemical in turn was bought by Chase Manhattan Bank. Chase later purchased J. P. Morgan & Company to become J. P. Morgan Chase, which is one of the largest credit card issuers in the nation.
Why Debt Is Good—or Bad
We know that people love to use their credit cards and borrow money for not just small purchases but big ones as well. But is that a good thing? The typical answer is yes, but in reality, the answer is that it depends on how much is borrowed and where the economy is going. In other words, it is all about context.
Economic theory tells us debt is a boon to commercial activity. Early in an economic slowdown, people look to their savings for support, but when that runs out, they turn to debt. When people are stretched, they borrow in order to maintain their standard of living.
Typically, people start out optimistic about the future, no matter what the circumstance. The philosophy is that a financial setback is only temporary, so if I borrow a little now, I will be able to keep going. When I get my job back, I will pay off the debt. Sounds great, right? Maybe. Whom you borrow from matters, and for many people, the choice is limited: It's the credit card or nothing. It's hard to get a loan from a bank if you don't have a job.
As long as the financial problems that households face are relatively short term, going into debt makes sense. While that is good, as it limits the extent of the downturn, it sets the stage for problems later on, especially since credit card debt is expensive.
The longer the slowdown, the weaker the recovery, the greater the future problems. After a while, households become maxed out. Ultimately, they use up all their savings and cannot repay their loans. That leads to a collapse in spending. If that occurs after the recovery begins, the expansion is weakened.
But it doesn't stop there. Eventually, people start reducing their borrowing in order to lower their debt loads and improve their personal balance sheets. Even when they are working again, they need to pay down the debt they accumulated. That stretches out the recovery as households, even if their wages are rising again, use some of those gains to get their financial houses in order.
Reducing debt burdens may be good for the individual, but if lots of households do it, it is not good for the economy. That is another example of the Fallacy of Composition.
Debt is not just a concern when economic conditions falter. Some of the biggest problems are created when the economy is booming. People feel that the good times will never end and they borrow like crazy. The ratio of debt to income rises during good times, indicating that people are piling on the borrowing.
But the good times don't last forever, and when households get overextended, an economic slowdown leads to an inability to pay back the debt and ultimately a drop in spending, which raises the question: is frugality better than debt?
Without borrowing, economic growth is limited to income growth. Too much borrowing, though, leads to huge upswings in demand, which is usually followed by a large cratering in spending when the pendulum swings back as people stop borrowing and start rebuilding their balance sheets. Like everything, debt is good as long as it is done in moderation.
If too much of a good thing is not good, what factors drive all that borrowing? One thing that leads the debt boom is wealth. When your stock market account is surging, you might feel comfortable about putting more charges on your credit card. So you have to take into account the stock market and home values when it comes to consumption.
The Rich Worry, Too
How many people do you know who are worth $10 million or more? Unless you work on Wall Street or hang around the right country clubs, the answer is probably not very many. But as Parker, a wealth management adviser, sits in a “client room” on Fifth Avenue, he reels off story after story about people who are worth millions and millions of dollars.12 Their view of the economy is different than most middle-class Americans, whose main dream of getting rich involves picking the winning lottery ticket.
To illustrate a point that wealth is relative—that you can have a lot of money but not feel rich—he recounts how he was driving with a friend who had just received a check for just under $1 million for a partnership he's involved with.
“I say to him that you must feel really great about that—and he's sitting there holding the check,” says Parker. “And a plane takes off from Westchester County Airport right where we are driving, and it's a private jet, and he goes, ‘You know, the guy who handed me this check got $4 million.’”
Despite getting the big check, Parker says his buddy still mows his own lawn—of course, it is 10 acres in a very upscale suburb and he rides a big tractor. But why not hire someone else to do it? Because, Parker says, his friend does not feel wealthy.
“As I think about the folks I work with, I have plenty of clients who have $10 million, $20 million, $30 million,” says Parker. “They certainly have a lot of money, but they don't have what I would view as a wealthy lifestyle. Oh, they have a bunch of homes, but they don't have time to live in them. And, they are always sort of paranoid about running out of money and all that stuff.”
Rich people paranoid?
Yes, indeed, says Parker, recounting how he has a client who used to have in excess of $100 million. Parker managed only a piece of it—maybe a little over $10 million. The rest was run by Bernard Madoff, who was running a Ponzi scheme with the money and will spend the rest of his life in jail for the swindle, which took in billions.
“And I am sitting there post-Madoff, and the family still has $10 million or $11 million, which by most definitions means you are well off, and the patriarch of the family is telling me, ‘This is worse than death.’”
Beg your pardon?
“Well, I was having a hard time understanding it, too,” confesses Parker. “But it just meant that on $100 million, you could generate $4 million to $5 million a year in income to maintain your lifestyle— the plane, the houses, all that. But, on $10 million, you can't do that anymore, so they had to get rid of the plane, some of the houses, and cut the living expenses, so everything they had become accustomed to no longer works.”
From his experience with the wealthy, Parker has had a number of clients who never quite got into acting like the Great Gatsby even if they were wealthy. He recounts how he has a client whose worth is in the $20 million range. “He hates spending money,” says Parker. “He has a boat on the Jersey shore, which keeps breaking down. He could probably afford a $150,000 boat but he just keeps fixing the old one.”
That particular client earned most of his money through his acumen. But Parker says the clients who have the most difficulty with wealth are those who have inherited large sums “because they don't have the experience, they don't understand the grind to save and build,” he explains. “They have the money, and they are incredibly insecure about it.”
On second thought, maybe the insecurity is somewhat understandable given Parker's experience with some old New England families that had large holdings of inherited IBM shares. Back in the 1980s, IBM was the darling of Wall Street. The stock sold for as much as $160 a share, and the company would declare an annual dividend of 5 percent to 6 percent—enough to afford the winter vacation in Gstaad or spend a few weeks at St. Bart's—and still put the children through private school. Oh, and not have to hold a nine-to-five job. Parker would argue in vain for them to diversify, sell some of the stock.
“It represented a disproportionate amount of people's wealth, and there was this notion that we would never invade the principal, we'll just live off the dividend,” says Parker. “And, then IBM went from $160 to $40 a share and they cut the dividend, and these people's lives were devastated.”
In his experience, what happened to the IBM families is not unique.
Parker knows financial executives—in theory, sophisticated investors—who rode their Bear Stearns stock or Lehman Brothers stock all the way to zero. “Now, you have a bunch of these guys walking around with worthless Lehman stock. I would suggest they have the company that issues the physical stock certificates send them some so they can hang them on the wall as a reminder.”
And he wonders if Apple, Inc. is the next IBM in regard to the wealthy. “At the end of 2012, it was selling at $700 a share, and the next year it traded below $400 a share,” he says. “So, look, there are a lot of people who owned it on the way up, would not part with it, and in the summer of 2013 it's at $450 a share, a 40 percent drop, and it's represented a third to a half of some people's liquid net worth.”
What is that these wealthy people want to use their money for?
Parker says from his experience the rich have four things that really concern them. The first is making sure they take care of themselves for the foreseeable future. Second is to take care of their family, their children, and grandchildren. Third is having enough money for their charitable interests. And fourth is having enough money to pay their taxes.
However, people's priorities may not always fit neatly into this order. For example, Parker has a client—a former executive—who gives away a couple of million dollars per year to his philanthropic interests. “We got together and he drew this hill, which represented his wealth,” says Parker. “And he said his goal was to give away everything he has. He has four or five kids, all well educated, but he said, ‘They have to do it on their own.’”
Although some metrics seem to indicate the rich are just getting richer, Parker thinks being wealthy has now become more stressful. Many of the rich saw their net worth sag sharply in the Great Recession—as both their home prices and stock portfolios fell. “So 2008 was a panic of mass proportions,” he says. “Affluent people felt incredibly vulnerable, and on top of that, the institutions they trusted and relied upon got themselves in trouble and sold them a bunch of stuff that Warren Buffett has described as “weapons of mass destruction.”
Add the possibility of losing money to yet another Madoff, says Parker, and life is just more stressful. “You think if I had $10 million, all my problems would be solved,” he concludes. “My experience has been, yeah, not the case. Everything is context.”
Economic Theory of Wealth
Economic theory views wealth differently. When your 401(k) is growing like crazy, you feel comfortable about your retirement. The future is supposedly secure, and as a result, people start to spend, spend, spend, and then borrow so they can spend more. You have to take into account the stock market when it comes to consumption.
Equity markets, and to the extent they raise or lower wealth, affect household spending regardless of the changes they may be seeing in their incomes. When people feel that their futures are set and they don't have to worry about it, they spend more.
The best example of the impact of the equity market on consumer spending occurred during the dot-com bubble in the 1990s and the rebound in stocks in the middle of the 2000s. With all the equity markets hitting record highs, people saw their retirement plan values soar. They felt they could spend all they wanted, and this even spilled into borrowing. With the wealth being built up in their stock holdings, they could take it to the bank and get loans. And they did that.
Of course, when the stock bubbles burst, so did wealth and spending. The result was a recession that began within a year of the peaking of the stock markets in both 2001 and 2007.
If you think stocks matter when it comes to debt and spending, consider the impact of housing. Home equity comprises about one-quarter of household wealth, and many have considered the value of the house a “savings account.” When prices rose, people felt good about their financial situation. This wealth effect, especially during the period from 2004 to 2007, when prices rose sharply in many metropolitan areas, contributed to the boom in the economy.
Housing, though, had an added impact on consumer spending. The advent of readily available home equity loans and lines of credit allowed people to use their houses essentially as piggy banks that they could break into anytime they wanted to, and which they did. So households not only felt good about the future but also were able to readily translate those euphoric feelings into spending in the here and now. This led to a surge in consumption and powered the strong growth in the middle part of the decade.
The economy went into recession when the housing bubble burst, just like with the tech bubble. Wealth collapsed, and so did the feeling of comfort. But things got even worse as the ability to borrow from the house disappeared. That exacerbated the slowdown.
When you add the decline in wealth due to the collapse of the stock markets and the housing markets to the inability to borrow from credit cards, from banks, or from home equity, is it any surprise that the economy went into such a deep decline that the downturn has been nicknamed the “Great Recession”? And given that it takes a long time to rebuild that wealth, is it any surprise that the recovery was so slow? And is it any surprise that when stocks and housing prices recovered, so did growth?
We know that you cannot just look at income; you have to look at wealth and a household's balance sheet. Indeed, the changes in wealth and income have impacts separate from the levels of income and wealth, as that is what affects perception of their well-being. People worry about whether the future looks brighter or darker. And that is where consumer confidence comes in.
Feeling Good? Buy a Car
Anyone who has sat through a basic macroeconomic course will know that you cannot just look at income, debt, and wealth to understand the consumer. You have to know what people think and feel, not just what they have, when it comes to consumer demand. That is where consumer confidence comes in.
What are the key factors that drive consumer confidence? Maybe most important is the perception of job security. If you think you will be losing your job, it is not likely you will be going out and spending lots of time at the mall. Alternatively, when your company is expanding and hiring lots of people and you think that the good times are here to stay, it is easy to open the wallet really wide.
How do people come to the conclusion that they have, or don't have, job security? They look at the economy. Are jobs being created or destroyed, and what is happening to the unemployment rate? The labor market is clearly key.
Was it a surprise to anyone that consumer confidence collapsed in late 2008 and early 2009? The economy was losing hundreds of thousands of jobs each month and the unemployment rate rose to double digits, so it only made sense that people assumed the turtle position and stopped buying. Fear, which is another way of saying “I have no confidence,” drove household buying decisions regardless of household incomes. Basically, if you think you are going to lose your job, nothing else matters.
In December 2008, during the dregs of the recession, the Gallup Economic Confidence Index, which polls 1,700 adults on a daily basis, found that over 60 percent had a net negative view of the U.S. economy's current state and future direction.13 (By way of contrast, by midyear 2013, there was a considerable improvement, with a net negative view of the economy by 7 percent of those polled, though it has continued to bounce up and down)
The auto industry is a good example of what happens when confidence tumbles. During the worst months of the Great Recession, the nation's automobile showrooms were quiet places. Many consumers had trouble getting loans, and yet others were not sure if they would still have a job to pay off a loan. Gasoline prices were rising even though people were driving less.
As a result, many people put off buying new cars. One of those procrastinators was Kathy Simmons of New York City. In 2012, Simmons owned a 1995 Honda Accord station wagon, a dependable car, but as it aged, mechanical issues started to crop up. A simple oil change was costing over $1,000 as the Honda specialists kept finding issues such as important bolts or bushings that needed to be replaced. Spending the money was a necessity since the Honda service representative insisted whatever needed to be done was a safety issue. On top of that, like many people, her stock portfolio had gotten “dinged up,” as her investment manager termed it. So why spend $30,000 on a new car when it would only cost a few thousand dollars per year to keep it running?
It was a situation lots of other people were facing as they tried to tease more mileage out of their clunkers or they decided they couldn't afford a new car. The procrastination or hesitation at buying a new car showed up in the numbers. In 2005, the automobile industry sold 17 million cars and light trucks, according to the U.S Bureau of Economic Analysis. But in 2009, that was down to 10.4 million. Even in 2013, well after the end of the Great Recession, the industry was still not fully recovered, with sales of about 15.5 million units.
In yet another way to look at the auto slowdown, the number of total registered vehicles declined between 2008 and 2011, says Dan Meckstroth, an industrial economist at Manufacturers Alliance for Productivity and Innovation (MAPI), an education, research, and professional organization. Citing private databases, he notes that car registrations continued to decline into 2013 even though the auto companies were selling more light-, medium-, and heavy-duty trucks.
“The drop in car registrations really reflects the poor financial condition of consumers and the fact they have postponed spending as well as a preference for utility vehicles,” he says.
Although the auto industry is cyclical, in the past it had one metric going for it: the natural increase in the population, which results in more teenagers' getting their driver's licenses. In theory, the new drivers should become car buyers. Historically, points out Meckstroth, the driving-age population increases by about 0.9 percent per year. However, even that's changing, moderating in recent years to 0.6 percent. “It is decelerating but it's still growing,” says Meckstroth.
Some of the decrease in car buying may be associated with the difficulty young people were having getting jobs. Even by the end of 2013 the unemployment rate for ages 16 to 19 was still over 20 percent on a seasonally adjusted basis. Young adults could not afford the payments on a car or just did not have the credit rating for a loan.
At some point, consumers will begin to feel better about their economic situation, which should help car sales, says Meckstroth. “There is plenty of pent-up demand,” he says in mid-2013. “People who kept their cars and did not replace them will be replacing them more,” he says.
That turned out to be the case for Simmons. By the end of 2012, her stock portfolio had recovered significantly. Consumer confidence by then had improved considerably, with the Gallup poll showing a net negative of 13 percent. That's when Simmons purchased a new station wagon. “It gets to the point where the cost of repair is more than the market value of the car,” says Meckstroth.
The impact of wealth on confidence is important, but not the end of the story about how the consumer spends. There are other factors that can affect confidence, and most of them have to do with income. For example, if inflation surges, that is not good news for spending. Why? People are worried that their costs are rising faster than their income and they will not be able to sustain their standard of living.
In contrast, other, non-income-related issues don't have a major effect on spending decisions. Political uncertainty caused by crazy doings in Washington, D.C., may drive people bananas and cause confidence to decline. But being disturbed that Congress has gone over the edge and sharp changes in the willingness to spend just don't necessarily go together.
Over time, people worry more about their incomes than anything else. Factors that threaten their jobs or their wealth are translated into lower spending. Positive events that cause people to believe their salaries will rise will loosen the purse string. Those positive and negative factors are the ones that we need to look at if we are to understand the direction of consumer purchases, and as we have shown, that means understanding the context in which those decisions are being made.
Thus, we have seen that income, wealth, and debt play a huge role in consumer spending. Changes in those do affect confidence, a wild card in any discussion about where retail and vehicle sales or even the housing market will go. But those factors still don't tell us the whole story. One other issue must be considered: changes in the patterns of spending as people age.
Where a person is in his or her life cycle not only cannot be dismissed, but with the aging of the Baby Boomers, it might have to be considered almost critical. A person's propensity or willingness to spend changes with age.
When you are young and carefree, you make money and you spend it. As you age and start a family, you begin to concentrate on the future. Instead of spending, you start saving and investing. After you've reached your peak earning years and put away all the money you need, you think about retiring, during which time you start drawing down on your wealth.
Why does that matter? Because of demographics. The U.S. economy has been a captive of the Baby Boomers, those born between 1946 and 1964, for least the past 60 years. They have been the largest age group their whole lives and have been catered to because if you can get Boomers to buy something, you have a great market for your product no matter what other age groups want or need.
That has had enormous implications. As Boomers' preferences have changed, so has production, be it for clothing, homes or vehicles. Fast food became popular for lots of reasons, one of which was the Boomer generation hitting their teens and young adult status.
As Boomers have aged, their tastes and income levels have changed as well. Small cars became luxury vehicles. Apartments in the city became McMansions in the far-out suburbs. And now that they are beginning to retire, the next change is occurring. They are looking for high-density, amenity-rich locations in order to retire and are therefore changing their location patterns. As any Boomer will tell you, their aging is creating rapidly increasing demand for health services.
Similarly, as Generation X hits middle age and the Millennials take their role in the economy, patterns of spending and production will continue to be altered in order to account for these groups. And as Boomers pass on, their importance in the economy will wane, and spending patterns will change once again.
Will consumers shop till they drop or drop spending? It depends. It depends on their incomes and wealth, their debt levels and their willingness to take on debt, confidence, and where they are in their lives. And that means that context is critical in any discussion about consumption. All of these are factors that businesses have to watch closely when they determine their business plans and that corporate sector is what we will look at in the next chapter.
Notes
1. U.S. Bureau of Economic Analysis, GDP report. www.bea.gov/newsreleases/national/gdp/gdpnewsrelease.htm and Naroff Economic Advisors, Inc. December 20, 2013.
2. National Employment Law Project, “The Inequality of Declining Wages during the Recovery,” July 2013. www.nelp.org/page/-/Job_Creation/NELP-Fact-Sheet-Inequality-Declining-Wages.pdf.
3. National Employment Law Project, “The Low-Wage Recovery and Growing Inequality,” August 2012. www.nelp.org/page/-/Job_Creation/LowWageRecovery2012.pdf.
4. U.S. Bureau of Labor Statistics, Productivity and Costs release, and Naroff Economic Advisors, Inc. December 6, 2013. www.bls.gov/news.release/prod2.nr0.htm.
5. Flatbush Magazine, published by the Flatbush Chamber of Commerce, March 1945.
6. Clipping from the Brooklyn Daily Eagle, 1927, exact date indecipherable.
7. Louis Hyman, Debtor Nation: The History of America in Red Ink (Princeton, NJ: Princeton University Press, 2011), 146–148.
8. Federal Reserve Board. January, 2014. www.federalreserve.gov/releases/g19/Current/
9. Nerdwallet, a commercial web site. January, 2014. www.nerdwallet.com/blog/credit-card-data/average-credit-card-debt-household/
10. Federal Reserve Board. January, 2014. www.federalreserve.gov/releases/g19/Current/
11. Hyman, Debtor Nation; Flatbush Magazine reports sale of the bank in its June 1946 issue.
12. Parker is a real person, but his name and some other personal details have been changed.
13. www.gallup.com/poll/122840/gallup-daily-economic-indexes.aspx, January 9, 2014.