
Chapter 8
Program Metrics
Metrics are powerful. The effective use of metrics can help senior managers understand their position relative to specific competitors as well as the overall market. They can help portfolio managers evaluate investment effectiveness as well as opportunities relative to organizational capacity. They can help program managers better understand the implication of forecasted problems as well as better articulate successes. They can also serve project teams within programs to assure alignment and performance excellence amid complex interdependencies. In short, metrics are powerful; or perhaps more precise, for better or worse metrics are powerful.
Metrics are part of a larger organizational construct—the performance management system—and if not used properly, they can do as much harm as good. Hence, the “for better or worse” caveat noted above.
Most organizations struggle with performance management. Common errors include measuring too much, measuring not enough, measuring the wrong things, using measures as absolutes rather than indicators, measures that are not timely, measures that are not aligned to strategic objectives, measures that create bureaucracy, measures that are not agreed to nor regularly used by senior managers, and the list goes on. While performance management is hard, it is a discriminating factor separating industry leaders from followers, those that are noted as best-in-class as compared to the rest in class. According to the research findings from Mollie Lombardi and Jayson Saba, top performing organizations use assessments to gather metrics more broadly, more frequently, and more consistently for decision making than their lower-performing competitors.1
This chapter provides detail that allows program managers to move toward the effective use of metrics as a powerful resource within their programs and organizations. To do so, we first want to make sense of metrics. With an understanding of metrics in place we will then explain why program management metrics are needed and explain various types of metrics and how to determine which program metrics are important based on organizational strategy.
Making Sense of Metrics
It is interesting that performance management is so hard, especially since we manage performance all the time. Each of us uses performance indicators, measures, and metrics every day and we do so relative to a baseline or set of expectations. For example, if you drive a car, you are constantly evaluating your use of the accelerator as indicated by the measure miles (or kilometers) traveled per hour, as illustrated on your dashboard, and against the baseline or expectation of allotted legal speed on the roadway. For another example, let's look at the human body. Measures of body temperature, blood pressure, body mass index, cholesterol count, and blood sugar level reflect a state of overall health. When evaluating businesses, as yet another example of measuring performance, analysts are often interested in knowing about percent of market share, return on assets, cost of goods sold, customer satisfaction, and cash flow, all of which explain organizational health relative to competitors and the overall industry. In short, we all manage performance and do so with performance indicators, measures, and metrics.
Program managers use metrics to assess program health relative to progress toward achieving business goals, value creation, and organizational benefit. In particular, using performance metrics help program managers and their sponsors understand how well a program is performing, where and why a program has problems, and tailor actions to eliminate the problems. This will, in turn, improve the program and bring it closer to its goals. Therefore, devising and employing appropriate metrics should aim to improve business results of the organization.
Program metrics not only measure the health of individual programs, but also show the effectiveness of program management-related processes, such as strategic management and portfolio management. In this manner, program management metrics are an effective means to integrate and synchronize strategic, portfolio, planning, and execution activities.
The Confusion Surrounding Metrics
While most organizations and program managers specifically, recognize the importance of metrics in general terms, the lack of use and inconsistency of use is more prevalent in practice. We have observed what Norman Fenton and Martin Neil noted in their research, which is that metrics and activities associated with metrics “have not addressed their most important requirement: to provide information to support quantitative managerial decision-making.”2 So why not? The answer is confusion. It is easy to get overwhelmed by the complexity of metrics, especially now with data becoming easier to obtain. Just because data are easy to obtain does not mean they are useful. We will make sense of translating data into useful information in the coming sections. For now, let's address the confusion as it pertains to nomenclature.
Much of the challenge in designing, developing, and establishing a useful performance management system is in part due to confusion in using performance terms such as objective, metric, measure, indicator, critical success factor, and more. Some authors use these performance management terms seemingly interchangeably, while others delineate them with a level of sterile technicality. Although authors may not agree, effectively establishing a performance management system in an organization requires a common language of terms and meanings. The following defines and explains key performance management system terms.
Objective: A specific target to be achieved most often associated with a goal or strategy. A major league baseball player may have, as an example, an objective to achieve a .300 batting average or hit 40 home runs and steal 40 bases. From a business perspective, an objective may be to achieve 10 percent new market penetration in each of the next three years.
Business Success Factor: Many practitioners use the term critical success factor (CSF). D. Robert Daniel, of McKinsey & Company, introduced the term in 1961 when his article “Management Information Crisis” appeared in Harvard Business Review.3 We, however, use the term business success factor (BSF) so as to keep focus on business outcomes—it's all about the business. This approach is consistent with Daniel's work in that he highlighted CSFs as types of data useful in measuring and informing top management activities. Therefore, critical business success factors are organizational conditions, practices, or elements necessary for success. For example, a critical business success factor may be to acquire new customers by expanding use of social media.
Metric: A quantitative measure with an agreed-upon dimension. One inch, 132 pounds, and 4 meters are all examples of metrics. Each is specific and has an agreed-upon quantitative meaning. An inch, for example, is one-twelfth of a foot or 2.54 centimeters. From a business perspective, return on investment (ROI) of 14 percent, market penetration of 21 percent, and deliverable efficiency to schedule of 98 percent, are examples of metrics.
Measurement: A quantification process, calculation, or algorithm that yields a numeric score. For effectiveness, a measurement yields not only the score, but aligns that score back to strategy and objectives. Business leaders and investment analysts are often measuring organizational return on assets, market share, and cash flow regarding organizational performance and alignment with strategy and objectives. Again, for clarity purposes, measurement is the process of measuring metrics (the actual performance) and relating them to strategy and objectives (the performance target).
Indicator: A prescribed state(s) to notify, alarm, or warn of conditions. The use of a household smoke detector is an indicator. Another example of an indicator is the engine light on the dashboard instrument panel of a car. The indicators may go off by signaling an alarm (visually or audibly), which prompts action. From a business perspective, examples include cost or schedule overruns or underruns relative to prescribed thresholds. Early warning systems such as the program strike zone and program indicators (Chapter 9) are valuable—the earlier the warning, the better.
Rationale for Using Metrics
There is one main, often cited, and logical reason for using metrics. It is common knowledge that “what gets measured gets managed; and what gets managed gets improved.” All organizations want to achieve continuous improvement. Those actively, and effectively, using performance metrics are more likely to succeed with continuous improvement. John Hauser and Gerald Katz illustrated this quite nicely in their article “Metrics: You Are What You Measure!” Here is how they explained it:
The link is simple. If a firm measures a, b, and c, but not x, y, and z, then managers begin to pay more attention to a, b, and c. Soon those managers who do well on a, b, and c are promoted or are given more responsibilities. Increased pay and bonuses follow. Recognizing these rewards, managers start asking their employees to make decisions and take actions that improve the metrics. (Often, they don't even need to ask!) Soon the entire organization is focused on ways to improve the metrics. The firm gains core strengths in producing a, b, and c. The firm becomes what it measures.4
As illustrated in Figure 8.1, metrics measure performance, and that performance yields output of work effort and resource investment, which in turn determines business results. The results measure the degree to which a mission is accomplished or not.

Figure 8.1 Performance management system process.
In particular, using a performance management system helps program managers and their sponsors understand the health of a program. Metrics quantify the degree to which objectives and overall strategy are being achieved. Indicators help to pinpoint if, where, and why a program has problems, which also helps to understand root causes of problems to tailor specific actions to further mitigate or eliminate them. Therefore, when done properly, devising a performance management system and employing appropriate metrics improve the probability of program success and business benefit.
It is important to note that metrics can only tell part of the story. They cannot fully identify, explain, or predict what will happen. Most potential problems need more than one metric or source of information to properly characterize or understand an issue or problem. It is a situation analogous to assembling the pieces of a puzzle. One piece of the puzzle does not depict the image of the whole puzzle.
A useful and effective metric should be timely, accurate, relevant, objective, and presented in a useful format to aid in management and decision making. Metrics should support, not replace, good management judgment.
Metrics and Program Governance
Metrics play a role in support of the organization's governance processes and procedures. As pointed out in PMI's The Standard for Program Management, “To support the organization's ability to monitor program progress and strengthen the organization's ability to assess program status and conformance with organization's controls, many organizations define standardized reporting and control processes applicable to all programs.”5 Metrics identified and developed jointly between the senior management team and the program governance personnel are used as part of the monitoring and control for each program and represent the unique needs for that organization.
Those governance metrics and measures, some of which are identified in this chapter, will be normally categorized to cover:
- Planning: priority setting, funding allocation
- Execution: progress tracking, early warning indication
- Completion: assessment of deliverables, benefits
- Results Evaluation: closed loop correction, strategy assessment
Every firm's senior management, along with personnel responsible for administering their governance processes, is faced with the challenge of identifying the right metrics and achieving balance between effective control and monitoring with the overhead cost required to administer them. The investment in time needed to capture data and use meaningful metrics must be balanced against the value obtained. If, as stated earlier in the chapter, what gets measured gets improved, organizations must guard against measuring and monitoring the wrong or superfluous aspects of the program.
A Systems Approach to Metrics
The research from John Hauser and Florian Zettelmeyer concluded that the use of metrics is key to program and project success.6 Companies using consistent, balanced, and mutually aligned metrics outperform companies who use sporadic, schedule-oriented, and nonaligned metrics. The use of program metrics is an institutionalized practice of leading companies. They focus on regular, planned, and periodic measurements of program and business performance. So what does it mean to have a balanced and aligned set of metrics?
To accomplish this, one must take a systematic approach to designing a performance management system and choosing the metrics to use. In Chapter 3 we introduced the integrated management system (IMS), which describes the critical management functions used to conceive and deliver new capabilities to realize the mission, strategic goals, and business benefits of an enterprise. The IMS provides an effective framework for defining the business- and execution-focused metrics needed to measure the performance of an organization's management functions in a balanced and aligned manner (Figure 8.2).
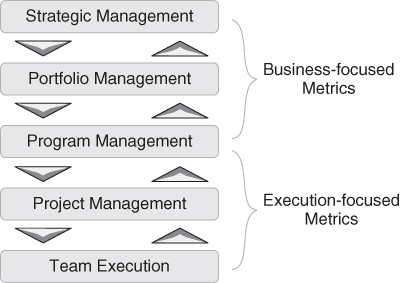
Figure 8.2 Using the IMS to balance and align metrics.
Metrics in support of the strategic management activities indicate performance toward achieving the strategic business goals desired. These metrics are highly business-focused and are used as input for business planning and setting of long-term strategy.
Portfolio management metrics are also highly business-focused and provide information on the effectiveness of the portfolio of programs and indicate if a business's capital and human resources are invested and allocated properly for the achievement of the business returns desired.
Metrics at the program level are a mixture of both business- and execution-focus, which indicates the role of program management as the glue that binds execution and strategy. In general, program management metrics provide an indication of performance against achievement of both the business benefits desired and the program objectives established during program definition.
Project management and team execution metrics are primarily execution-focused and provide information on performance toward the planning and execution of their deliverables. They are typically focused on measuring project-level triple constraints and discipline-specific outcomes.
There are a seemingly infinite number of metrics that can be employed. For a quick reference, Table 8.1 provides a list of the most common metric types for each IMS management function.
Table 8.1 Aligning metric types to IMS management functions
| IMS Management Function | Metric Types |
| Strategic Management | Revenue growth—from existing products Revenue growth—from new products Revenue growth—in existing markets Revenue growth—in new markets Product patents per year Reputation—Net Promoter Score® Employee engagement Most/Least effective product Most/Least effective market Most/Least costly customer Operational efficiency |
| Portfolio Management | Capacity—Number of programs and projects Average return on investment Pipeline throughput Complete versus canceled programs and projects Diversification of programs—by risk (portfolio risk index) Diversification of programs—by product type Diversification of programs—by customer targets Development turnover rate—Approval rating at each phase Ideas to market completion rate |
| Program Management | Staffing—Actual versus planned Funding—Actual versus planned Funding—Estimate to complete Timeliness/Schedule—Percent of deliverables met on time Complexity—Number of interdependencies Time-to-Market (timeliness target) Time-to-Volume (market share target) Time-to-Payback (financial return target) Projected future income from program Projected customer adoption (rate of new market share) Risk exposure—probability of realizing expected business benefit |
| Project Management | Requirements traceability index (from plan through test) Performance against cost Performance against budget Performance against quality Performance against schedule Risk—probability of achieving deliverables on time, in budget |
Companies that proactively and methodically design their program management approach, and corresponding set of program metrics, are what we refer to as best-in-class companies. Conversely, those that take an ad hoc, inconsistent approach are referred to as rest-in-class companies. Best-in-class companies experience a higher rate of program goal accomplishment and also produce a higher quality metric set—quality that is quantified by usefulness.
A detailed comparison between best-in-class and rest-in-class companies reveals that the best companies engineered and installed the use of metrics as part of a performance management system; the metrics were balanced and mutually aligned. Balanced metrics are those that cover all dimensions of a program, including schedule-oriented metrics, as well as those for financial, customer, process, and human resource utilization. Balanced metrics also include both leading and lagging indicators. Leading indicators are forward looking, such as a projected finish date based upon the rate of milestone completion. Lagging indicators, such as percentage of deliverables completed on time, are most valuable for a retrospective view of program performance. Both leading and lagging indicators are important and useful.
Mutually aligned means that metrics are compatible and use the same baseline information—for example, performance to planned schedule, probability of completing the program by a certain date, and the cumulative percentage of milestones that are accomplished are all based on the same baseline: the program timeline.
Literature claims that this behavior, using balanced and mutually aligned metrics, is not by chance, but rather is by design and is aimed toward enhancing success in terms of accomplishing the program goals.7 Consequently, best-in-class companies translate program and business success factors into specific metrics the program team can act on and also create incentives for accomplishment of the metrics. For example, the executive team at Lucent Technologies studies the best time-to-market performance measures in the industry, which are turned into targets for their own teams to beat. This is a culture of continual improvement by making program targets highly aggressive.8
In summary, best-in-class organizations carefully build metric systems that align program execution with the organization's business strategy. In that effort, the emphasis is on using metrics to measure performance on a consistent basis from inception to completion of the program. They insist on measuring multiple facets, balancing metrics to obtain a holistic picture of program health, and selecting metrics that are aligned and compatible.
Measuring Business Benefit
If the primary reason for program management is the delivery of business benefits, then program management metrics need to be concentrated toward measuring business results. This is the main reason why we make the distinction between business success factors and critical success factors.
In practice, we have observed that there is a strong tendency to use execution-focused measures when program managers first begin identifying their business factors. Examples are performance against schedule and performance against budget. This mistake is certainly understandable because many program managers are former project managers where the measurement focus is on execution, not necessarily on business performance. Additionally, current literature is dominated by reference to execution-focused measures and metrics.
Keep in mind, however, that a program manager serves as the business manager's proxy, and a business manager is most interested in measuring business results. When defining program-level metrics, we always recommend that a program manager focus on business metrics first, and then identify the critical operational metrics needed.
For clarification, consider the following example. Liberty Tax is a tax preparation and planning company operating in North America. The company funded a program named Sapphire to develop a new web-based tax preparation service for small business clients. The market introduction or go-live date was a critical business success factor. If the service was late to market, Liberty would miss all or part of the tax preparation cycle for the year. This would have a negative impact on the business benefits anticipated such as new customer acquisition and increased revenue (top line growth). In this example, as noted, the market introduction date is a business success factor for the Sapphire program. Additionally, the project managers chose to use performance against schedule as a key performance metric to provide cross-program concentration on timeline performance at the operational level. This demonstrates an alignment of metrics at the program and project level.
Program-level metrics are driven by the business benefits desired, so they will be unique for each program. Table 8.2 provides a catalog of program metrics that we commonly observe organizations utilizing in their practices.
Table 8.2 Metric options relative to business benefits
| Business Benefit | Metric | Measurement |
| Financial | Return on Investment | (Gain from investment minus cost of investment) divided by cost of investment |
| Return on Capital | Net income divided by (interest bearing debt plus stockholders' equity) | |
| Return on Assets | Net income divided by total assets | |
| Return on Net Assets | Net income divided by net assets | |
| Return on Sales | Net profit after taxes divided by net sales | |
| Net Operating Revenues Ratio | Income before other items divided by adjusted net operating revenues | |
| Profitability Index | Present value of future cash flows divided by initial investment | |
| Inventory Turnover | Cost of goods sold divided by inventory | |
| Gross Margin | (Sales minus cost of goods sold) divided by sales | |
| Net Margin | Net income divided by sales | |
| Market | Market Share | Total company sales divided by total industry sales |
| Target Market Index | Relative market size divided by (1 plus relative market growth rate) | |
| Market Coverage Index | Number of countries the organization sells in weighted by size of revenue) divided by target global market revenue | |
| Customer Fallout | Number of failed sales conversions divided by total possible sales | |
| Customer Acquisition Cost | All sales and marketing costs for a specific period of time divided by the number of new customers in the same period of time | |
| Time to Payback | Customer acquisition cost divided by how much the customers paid on average per month | |
| Incremental Sales | Revenue generated by marketing initiatives divided by baseline sales | |
| Net Marketing Contribution | (Sales revenue times percent gross margin) divided by marketing and sales expense | |
| Customer Satisfaction | On-Time Delivery | Number of orders delivered on time divided by the total number of orders received |
| Customer Satisfaction | Number of customers noting complete satisfaction divided by total number of customers | |
| Net Promoter Score | Number of customers likely to recommend our company to a friend or colleague divided by number of customers asked | |
| Quality | Product Defect Rate Assessment | Total number of products completed in a specific period of time divided by number of rejected products due to defects over the same period of time |
| Defects Per Unit | Total number of defects found on all units divided by the total number of units | |
| Material Quality | Total orders with material quality within agreed tolerances divided by total number of orders | |
| Perfect Order Index | Percent on time multiplied by percent complete multiplied by percent damage free multiplied by accurate documentation | |
| Business Productivity | Time-to-market | Average time from approval to launch for each product |
| R&D Success | Number of new products launched over a specific time divided by the number of projects developed in that same period of time | |
| Cost Performance Index | Earned value divided by actual cost | |
| Schedule Performance Index | Earned value divided by planned value | |
| Percent of New Technologies | Number of new technologies produced divided by the number of planned technologies for the period |
It is easy to see how one can get overwhelmed by metrics. The metrics introduced thus far are simply a listing of those most commonly used. There are hundreds of metrics available for use. We are often asked, “How many metrics do I need for my program?” The answer is: It depends. A study by BusinessWeek and Boston Group shows that the sweet spot is somewhere between 8 and 12 metrics (see “How Many Metrics Do You Need?”).9 Our experience in managing both small and large programs supports this assertion. At the program level, using more than 12 metrics can cause more information overload than value.
Choosing Metrics That Matter
Each company will have a distinct set of metrics depending on its business strategy and goals. Therefore, a set of metrics will vary by the type of industry the company is part of and by its business strategy (for example, differentiation, cost leadership, quality, etc.). The job of customizing a metrics set falls to the senior leaders of an organization and is often negotiated with program managers.
As an example, Frog (a leading product strategy and design firm) uses four common success metrics for their programs:10
- Ability to bring a design to market
- Client satisfaction
- Profitability
- How the program team feels about the work completed
While the job is ultimately that of senior management, when a business determines its own distinct set of metrics, it should do so in collaboration with company stakeholders and be in sync with the organization's governance process, procedures, and other requirements. Each stakeholder will emphasize different metrics according to their needs.
- The board of directors, financial community, and CEO will primarily be interested in the strategic metrics (see “I Have Only Three Minutes a Month!”).
- Business managers will show a strong interest in metrics that assess the strategic health of the business, the alignment of programs with the business strategy, and the balance of the program portfolio relative to the business needs.
- Program management directors and governance board members will be concerned with metrics assessing the achievement of business benefits and operational health of a program and its constituent projects.
- Members of the IPT core team and the project teams will be most keenly interested in metrics about project management and team execution.
The variation in stakeholder needs has to be considered and comprehended when choosing program metrics. At times, trade-offs have to be made in the choice of metrics to prevent an overburden of information capture and dissemination.
Using Strategy as a Compass
As noted, metrics must be aligned with the specific strategy and objectives of the firm to be effective. As a reminder, it is the business strategy that dictates the configuration and focus of a company's program management function. This means that each element of program management needs to be aligned with the business strategy and reflected by the program management metrics used. To illustrate this alignment, we will look at three companies with three different business strategies as defined by Michael Porter's model, and demonstrate how the strategy drives the selection of the metrics.11
Company A in Table 8.3 uses a differentiation strategy to offer its customers something different from their competitors. In particular, Company A focuses on technology innovation and fast time-to-market to achieve differentiation and gain higher profits and market share. Secondarily, Company A strives to achieve high quality and does not allow runaway cost. To measure performance to their strategy, Company A selects metrics for measuring time-to-market, percentage of new technologies developed, profitability index, and market share. Additionally, they choose customer fallout and development cost metrics to measure their secondary strategy of providing high quality and cost containment.
Table 8.3 Strategy drives metric decision—differentiation strategy
| Company A | |
| Company Business | High-tech electronics |
| Business Strategy | Differentiation |
| Type of Programs | New product development |
| Metrics (First Priority) | Time-to-market |
| Percentage of new technologies | |
| Profitability index | |
| Market share | |
| Metrics (Second Priority) | Customer fall-out |
| Manufacturing cost | |
| Development cost |
Company B focuses on a low-cost strategy aimed at establishing a sustainable cost advantage over its rivals. It competes in the manufacturing of fasteners used in building construction and uses a low-cost strategy to underprice rivals and capture market share. This strategy will leave Company B with a small gross profit margin per product, but profit can be achieved through a large volume of sales and lean staffing. Metrics to support this business strategy should measure development and manufacturing costs, market share, program staffing level, gross profit margin, and sales volume. Secondary objectives are to bring the product to the market in an average industry standard time and with average quality. This is complemented with the secondary priority metric of development time and defect assessment rate. Table 8.4 summarizes the alignment of strategy and metrics.
Table 8.4 Strategy drives metric decision—low-cost strategy
| Company B | |
| Company Business | Commodity fastener manufacturing |
| Business Strategy | Cost leadership |
| Type of Programs | Development programs focused on cost reduction and module integration |
| Metrics (First Priority) | Development cost |
| Manufacturing cost | |
| Market share | |
| Staffing level | |
| Gross profit margin | |
| Sales volume | |
| Metrics (Second Priority) | Development time |
| Defect rate assessment |
Company C aims to become a low-cost provider with high-quality features and focuses on a best-cost strategy by combining upscale features with low cost. A secondary strategy is to develop innovative information technologies within reasonable time frames. Primary metrics to measure this strategy should include defect rate assessment, customer fallout, development cost, and manufacturing cost. Secondary metrics could include percent of new technologies delivered and development time. Table 8.5 summarizes the alignment of strategy and metrics.
Table 8.5 Strategy drives metric decision—low-cost/high-feature strategy
| Company C | ||
| Company Business | Provider of automotive information technology | |
| Business Strategy | Best cost and innovation | |
| Type of Programs | Hardware and application SW supporting automotive features | |
| Metrics (First Priority) | Defect rate assessment | |
| Customer fall-out | ||
| Development cost | ||
| Manufacturing cost | ||
| Metrics (Second Priority) | Development time | |
| Percent of new technologies to company | ||
These examples illustrate how business strategy drives the choice of metrics. We have shown three examples of companies with different strategies and the corresponding sets of metrics chosen. Each company in the world will have its own business strategy and set of metrics to measure the effectiveness and achievement of its strategy.
Metrics Quality
As noted at the beginning of this chapter, metrics can do as much harm as they can good if they are not chosen and used properly. We express the need for quality when using metrics in order to overcome the common errors of metrics management and performance management systems. Best practice companies design their metrics systems as minimalistic and simple as possible; yet balance few and simple with the need for decision-making information. Sometimes, few are trumped by many because of the program and business need for the metrics.
As a quick reference guide (and mnemonic tool) to help overcome limitations associated with metrics, follow these “SMART” guidelines from George T. Doran.12
Specific: Objectives and metrics need to be clear and unambiguous. All stakeholders should be able to (consistently) define the metric relative to what is expected, why it is important, and how it is measured.
Measurable: The objectives must be timely and measurable. Therefore, data must be available for use and consistent to track (and trend) over time.
Attainable: Objectives must be realistic. Goals and objectives should include some that are high probability of occurrence and some that are a stretch for achievement.
Relevant: Goals, objectives, and metrics must be aligned from strategy through execution. In other words, they must be relevant. Additionally, to be relevant, metrics must be regularly used, otherwise the time to collect and illustrate metrics is not worth the investment of time and energy.
Time-Bound: Metrics must be grounded and the most natural way to do so is by time. Time provides a sense of urgency, especially if corrective action is needed in between metric reports.
Many organizations over-compensate when using metrics. Organizations not “SMART” about using metrics often find they are committing one or more of the common errors noted at the beginning of the chapter. When the errors occur, frustrations cascade from projects to programs to the organization at large. Quality in the use of metrics relates to those that are the fewest needed, the simplest to manage, and are used regularly in discussions and for decision making. Additionally, quality in metrics includes those that have a clear owner and point of responsibility.
Metrics and Decision Making
There are hundreds of decisions to be made during the course of a program—some large and significant, some small and incremental, and some that fall between these two extremes. It is well documented that having access to the right data at the right time facilitates effective decision making.13 Difficulty in finding information to support a decision, or even the perception of difficulty, can affect decision quality on a program. Decision makers often trade off decision quality versus time to find the information needed.
Having an effective metric system for a program serves to bring the data and information needed close to the people in charge of making decisions on a program. Having the right metrics is critically important, however.
Selecting the metrics to use to drive information-based decisions involves determining the data needed to measure and quantify a decision—or more accurately, the decision criteria. Further, decisions at the program level must support the business goals and program objectives. Therefore, a tried and true approach for selecting one's metrics remains valid for program management.14
- Establish the goals and objectives.
- Determine the necessary decisions and decision criteria.
- Select metrics that will measure the criteria.
Utilizing this approach ensures that both program decisions and metrics support the goals and objectives of the program.