3
Gas Power Cycles
3.1 Overview
Gas power cycles use air as the working fluid; there are two main categories of gas power cycles, namely, gas turbines and gas engines. Both internal combustion and external combustion types are discussed in this chapter.
Enhancement to power cycles will be reviewed and calculations will demonstrate the increase in efficiency of some key changes to the basic cycles.
Learning Outcomes
- To understand the basic gas turbine cycle processes.
- To understand the practical amendments employed to improve the basic gas turbine cycle efficiency, for example, intercooling, reheating and regeneration.
- To be able to appraise the efficiency of a gas turbine power plant.
- To be familiar with Otto, Diesel, dual combustion and Stirling engine cycles.
- To be able to solve problems related to gas power cycles.
3.2 Introduction to Gas Turbines
Gas turbines utilize the principles of gas compression, heat addition and gas expansion to generate power. Gas turbines used in smaller energy utilities can provide a fast response and high efficiency coupled with low emissions.
3.3 Gas Turbine Cycle
The closed‐cycle ideal gas turbine plant is shown in Figure 3.1. The figure also shows the temperature–entropy diagram of the thermodynamic cycle, comprising four processes:
- Process 1–2: An ideal compression (isentropic process, i.e.
 ).
). - Process 2–3: The fuel is burnt with the air at constant pressure.
- Process 3–4: The high‐energy gas is allowed to expand against the turbine blades, producing useful work. This process ideally runs at constant entropy (i.e.
 ).
). - Process 4–1: The working gas is cooled back to T1 at constant pressure.

Figure 3.1 Ideal gas turbine cycle.
3.3.1 Irreversibilities in Gas Turbine Processes
Thermodynamic realities, for example, friction and heat transfer, introduce some deviation from the ideal isentropic paths taken by the compression and the expansion processes discussed previously. There is also a pressure drop during heat addition, due to friction between the combustion gases and the surfaces. The pressure at the end of expansion is slightly higher than atmospheric to ensure the free flow of the system. Figure 3.2 highlights these real processes.

Figure 3.2 Real gas turbine processes.
3.3.2 The Compressor Unit
If there is little change in velocity and if the compressor is mounted horizontally then both kinetic energy and potential energy terms are negligible. Assuming the compression is adiabatic, the Steady Flow Energy Equation (conservation of energy) will reduce to:
As before, the frictionless, adiabatic (i.e. isentropic) temperature at the end of the compression is calculated using:

(For an isentropic process, the value of n is given by the ratio of the specific heats, i.e. ![]() , and in some texts is represented by the symbol γ).
, and in some texts is represented by the symbol γ).
The connection between the frictionless, adiabatic compression temperature, T2, and the real compression temperature, T2a, is indicated by rearranging the isentropic efficiency equation (Equation (1.8)):
Therefore, the actual work of compression in Equation will become:
3.3.3 The Combustion Chamber
The compressed gas enters a combustion chamber devoted to increasing the internal energy of the gas. Energy is supplied to the gas in the form of fuel, which is burnt at a given rate. The combustion process 2–3 is shown in Figure 3.2. The heat provided by combustion of the fuel is:
This heat transferred to the gas increases its temperature from T2a to T3, therefore:
It is possible to combine these two equations to predict the combustor's outlet temperature, T3.
3.3.4 The Turbine Unit
A similar analogy to that used for the compressor is applied to the turbine, with its temperature dropping to T4a at the outlet.

The isentropic turbine exit temperature is given by:

Note that the actual exhaust temperature, T4a, from the turbine will be above the frictionless, adiabatic exhaust temperature, T4, as a result of irreversibilities in the turbine.
The actual temperature is given by (from Equation (1.10)):
The net work output is given by the expansion work minus the work provided to the compressor:
3.3.5 Overall Performance of Gas Turbine Plants
- The compressor work,
 (3.11)
- The heat provided by combustion of the fuel:
(3.12)or
 (3.13)
- The turbine work, Wt(3.14)

- Net work output:
(3.15)

- Thermal efficiency:
 (3.16)
- Work ratio:
 (3.17)
3.4 Modifications to the Simple Gas Turbine Cycle
The performance of a gas turbine operating on the basic Joule cycle can be improved by employing one or more of the following modifications:
- Incorporating a heat exchanger.
- Splitting the compression process with ‘intercooling’ between stages.
- Splitting the expansion process with ‘reheating’ between stages.
- A compound system which incorporate all three modifications above.
These are discussed further in the following sections.
3.4.1 Heat Exchanger
The temperature of the exhaust gases leaving the turbine (T4a) is higher than that at the end of the compression (T2a) (see Figure 3.3). Hence, it is logical to reclaim the energy possessed by these gases before they are allowed to pass to the atmosphere. Thus, the energy consumption in the combustor is reduced and the thermal efficiency of the cycle is increased. A heat exchanger is a simple unit allowing the exchange of heat between the gases at T4a with those at T2a, resulting in a temperature rise of the compressed air to T2b (see Figure 3.3). The heat exchanger effectiveness ![]() is defined as:
is defined as:


Figure 3.3 Regenerative gas turbine.
If the mass flow of air is much higher than that of the fuel, as is usually the case in gas turbines ![]() and assuming that differences in the specific heat capacity are very small (i.e.
and assuming that differences in the specific heat capacity are very small (i.e. ![]() ) then the heat exchanger effectiveness
) then the heat exchanger effectiveness ![]() may be given by the following simple expression:
may be given by the following simple expression:

3.4.2 Intercooling
The compression process may be divided into two or more stages. If the gas between stages is cooled down to the original inlet temperature, the work input for a given pressure ratio is reduced, as indicated in Figure 3.4. Notice isentropic processes have been assumed for clarity. (Remember that isobars are diverging as s is increased.)

Figure 3.4 Gas turbine with intercooling.
Hence, ![]() first stage +
first stage + ![]() second stage <
second stage < ![]() single stage; if both compressors have the same isentropic efficiency then
single stage; if both compressors have the same isentropic efficiency then ![]() .
.
The intermediate pressure, PI, for optimal work is given by differentiating the net work output (with respect to the intermediate pressure, PI,) and equating to zero, resulting in:
where PL and PH are the low and high pressures, respectively.
3.4.3 Reheating
The expansion process, like compression, may also be performed in two or more turbine stages (see Figure 3.5). Usually, the high‐pressure turbine (HPT) drives the compressor and the low‐pressure turbine (LPT) provides the useful power output. This useful output is increased by reheating (RH) the gas before entering the LPT. By analogy with intercooling in the compressor, it can easily be shown that:

Figure 3.5 Gas turbine with reheating.
![]() first stage +
first stage + ![]() second stage >
second stage > ![]() single stage and again:
single stage and again:
The intermediate pressure, PI, produces the optimal power output, and ![]() if both stages have the same isentropic efficiencies.
if both stages have the same isentropic efficiencies.
Using a reheat option increases the work output but the heat input is increased, which reduces the cycle efficiency. On the other hand, the temperature of the gases leaving the low‐pressure turbine is relatively higher when reheating is used, and consequently a heat exchanger will produce better heat reclaim of the gases before they disappear to the atmosphere.
3.4.4 Compound System
Such a system includes all of the three modifications described above, as shown in Figure 3.6.

Figure 3.6 Compound gas turbine cycle.
In order to find the optimal intermediate pressure, consider the gas turbine cycle shown in Figure 3.7 (isentropic processes assumed).

Figure 3.7 Optimal intermediate pressures for expansion and compression.
Since process 6–7 is reheating at constant pressure until ![]() , the turbine work can be found as:
, the turbine work can be found as:

But

Therefore

To find the maximum parameters:

Therefore
Hence
3.4.5 Combined Gas Turbine/Steam Turbine Cycle
A combined‐cycle power system typically uses a gas turbine to drive an electrical generator and recovers waste heat from the gas turbine exhaust to generate steam, which, in turn, is used to drive a steam turbine, also connected to an electrical generator. The overall electrical efficiency of a combined‐cycle power system is, not surprisingly, higher than the simple gas turbine cycle due to the utilization of otherwise waste heat. This type of arrangement is sensible since gas turbines operate at higher temperatures than steam turbines due to the direct combustion process, and therefore the exit temperature of a gas turbine unit is usually about 500 °C, which has a fair amount of potential thermal energy to run a steam turbine Rankine cycle with moderate superheat condition.
In Figure 3.8, the Brayton gas turbine cycle processes are: 1–2–3–4, and the Rankine steam cycle processes are: 11–12–13–14.

Figure 3.8 Combined gas turbine/steam turbine system.
Gas turbine calculations follow the normal Brayton cycle. Hence, it can be assumed that calculating the gas turbine cycle power output and cycle efficiency is an easy task. The waste heat recovery unit function is to allow the transfer of heat from the gas turbine unit to the steam turbine unit, converting water into steam from state 12 to state 13. Hence,
where Hlf is the heat loss factor of the heat recovery unit, with a typical value of 0.95.
The process of estimation of the enthalpy values at points 11, 12, 13 and 14 was discussed in the previous relevant sections.
Once again, the calculations of the power output from the steam turbine and the steam cycle efficiency are straightforward.
The combined cycle calculation is the sum of the two cycles; hence, the combined cycle power output is:
and the combined cycle efficiency is:


3.5 Gas Engines
There are two categories of engine in use in the power industry. They are classified according to the supply of heat to produce the mechanical power that, in turn, is converted into electrical energy. These are:
- Internal combustion engines: These use either the standard Otto cycle or the Diesel cycle.
- External combustion engines: This type mainly relies on the Stirling engine.
3.5.1 Internal Combustion Engines
An internal combustion engine converts fuel into mechanical energy. The most common fuel is liquid, such as petrol (gasoline) or diesel. There are distinct differences in the design and operation of these two fuels and the engine design necessary to utilize them. There are also two thermodynamic cycles to describe the behaviour of these two engines.
The applications of internal combustion engines include the provision of the mechanical power source for most transport whether by road, rail, sea or air, as well as for industrial equipment such as air compressors and pumps, and for the provision of electrical energy, as in the case of portable power generators.
3.5.2 The Otto Cycle
This practical cycle applies to the petrol or spark‐ignition engine, which is perhaps the most common heat engine in popular use. The cycle was originally proposed in 1862 but was made practicable by the German scientist Nikolaus Otto in 1876.
The Otto cycle is an ideal air standard cycle, which approximates the actual cycle. Figure 3.9 illustrates the Otto cycle on a P–v diagram.

Figure 3.9 The Otto cycle P–v diagram.
The cycle consists of four non‐flow processes.
In state 1, the engine cylinder is assumed to be full of air at approximately atmospheric pressure and temperature. The piston is at the bottom dead centre (BDC) position.
Process 1–2 is an isentropic (adiabatic and reversible) compression of the air. The piston moves to top dead centre (TDC), compressing the air into the clearance volume and so raising its pressure and temperature.
Process 2–3 is heat addition at constant volume. The piston remains at TDC whilst the heat is supplied from the surroundings and the pressure and temperature are raised to their maximum values in the cycle.
Process 3–4 is an isentropic expansion. The hot high‐pressure air forces the piston down the cylinder to BDC, thus producing useful work.
Process 4–1 is heat rejection at constant volume. The piston remains at BDC whilst the heat is transferred to the surroundings and the air returns to its original state at 1.
3.5.2.1 Analysis of the Otto Cycle
The air standard efficiency of the Otto cycle may be defined as:

If m is the mass of air in the cylinder and Cv is the specific heat capacity of air at constant volume, then:
Heat supplied:
![]()
Heat rejected: ![]()
Applying the first law of thermodynamics:
Net work output: ![]()
It can be shown that the efficiency of the Otto cycle is:
 (3.26)
It is often more convenient to express the air standard cycle efficiency in terms of the volume ratio. The compression ratio (rv) is defined as:
where V1 = cylinder volume at BDC = swept volume + clearance volume.
V2 = cylinder volume at TDC = clearance volume.
Using the process equations to replace temperatures by volumetric ratios:

Using these definitions one can express the efficiency in terms of compression ratio only:

3.5.3 The Diesel Cycle
Rudolf Diesel invented the ‘Diesel’ cycle around 1892. This is the cycle used by the older type of diesel engine in which the fuel was injected into the cylinder by a blast of compressed air. The diesel fuel is injected into the cylinder at a temperature sufficient to initiate combustion; hence, the cycle is described as compression ignition and works at higher pressures than a petrol engine. Combustion therefore takes place at almost constant pressure, as opposed to the constant volume combustion of the Otto cycle. This difference in the heat supply process is the only difference in the air standard cycle for the two engines. Figure 3.10 shows the air standard Diesel cycle on a P–v diagram.
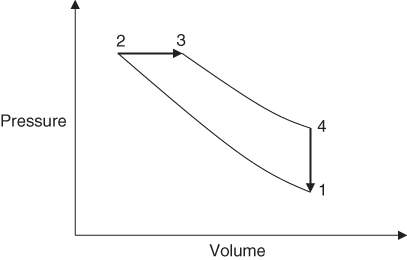
Figure 3.10 The Diesel cycle P–v diagram.
The cycle consists of four non‐flow processes.
In state 1, the cylinder is assumed to be full of air at atmospheric pressure and temperature, and the piston is at BDC.
Process 1–2 is an isentropic compression of the air. The piston moves to TDC, compressing the air into the clearance volume and so raising its pressure and temperature.
Process 2–3 is heat addition at constant pressure. Heat is supplied to the air, resulting in a further increase in air temperature to its maximum at 3. This produces an increase in volume until the heat supply is cut off at 3.
Process 3–4 is an isentropic expansion of the air (product of combustion) during the remainder of the stroke until the piston reaches BDC at 4.
Process 4–1 is heat rejection at constant volume. The piston remains at BDC whilst the heat is transferred to the surroundings and the air returns to its original state at 1.
3.5.3.1 Analysis of the Diesel Cycle
The air standard Diesel cycle efficiency may be defined as:

If m is the mass of air in the cylinder and the specific heat capacities of air at constant pressure and constant volume are Cp and Cv respectively, then:
Applying the first law of thermodynamics:
It can be shown that the efficiency of the Diesel cycle is:

An alternative expression for the air standard efficiency of the Diesel cycle may be determined from certain volume ratios for the cycle. As with the Otto cycle, the compression ratio is defined as:
The cut‐off ratio is defined as:
Since the process 2–3 takes place at constant pressure:

Using the volume ratios, the air standard efficiency of the Diesel cycle becomes:

Since n is a constant for air and rv is a constant for a given engine construction, the cycle efficiency clearly depends on rc. An increase in the load on the engine necessitates increasing rc, which results in a decrease of efficiency, and this is one of the reasons why the Diesel cycle has been replaced for modern diesel engines by the dual combustion cycle.
3.5.4 The Dual Combustion Cycle
This cycle, sometimes known as the mixed cycle or semi‐diesel cycle, closely approximates the working cycle of modern diesel engines. It is derived from an engine invented in the last quarter of the 19th century by British engineer Herbert Ackroyd‐Stuart. It is, effectively, a combination of the Otto and Diesel cycles.
In the modern diesel engine, the fuel is forced into the cylinder in a high‐pressure spray, with injection taking place both before and after the piston reaches top dead centre. Fuel injected before TDC ignites and burns instantaneously, producing a constant‐volume combustion process. Subsequent fuel entering the cylinder burns as soon as it leaves the injection nozzle, with the piston moving down the cylinder again, thus producing a constant‐pressure combustion process. The engine uses liquid fuel injection (i.e. unmixed liquid diesel oil) as opposed to the previous cycle in which the diesel was blown into the cylinder mixed with compressed air.
The cycle consists of five non‐flow processes (see Figure 3.11).

Figure 3.11 The dual combustion cycle P–v diagram.
In state 1, the cylinder is assumed to be full of air at approximately atmospheric pressure and temperature, and the piston is at the bottom dead centre (BDC) position.
Process 1–2 is an isentropic compression of the air. The piston moves to TDC, compressing the air into the clearance volume and so raising its pressure and temperature.
Process 2–3 is heat addition at constant volume supplied to the air, resulting in a further increase in both the pressure and temperature of the air.
Process 3–4 is heat addition at constant pressure. This causes an increase in volume and a further increase in the temperature of the air. The heat supply is cut off at 4 and the temperature of the air is at the maximum value attained during the cycle.
Process 4–5 is an isentropic expansion through the remainder of the stroke until the piston reaches BDC at 5.
Process 5–1 is heat rejection at constant volume. The piston remains at BDC whilst the heat is transferred to the surroundings and the air returns to its original state at 1.
3.5.4.1 Analysis of the Dual Cycle
If m is the mass of air in the cylinder and the specific heat capacities of air at constant pressure and constant volume are Cp and Cv respectively, then:
Applying the first law of thermodynamics:
Hence, the efficiency of the dual cycle is found to be:

An alternative expression for the air standard cycle efficiency can be derived in terms of certain volume and pressure ratios. However, the equation is rather too cumbersome to use. It is preferable to determine the work output and the heat supplied to evaluate the cycle efficiency, or to determine the temperature at each cycle point.
3.5.5 Diesel Engine Power Plants
Diesels are internal combustion reciprocating engines. They were developed primarily for marine propulsion and stationary service. The size of these units, in power output, is relatively small for power generation, but physically very large per unit of output, as compared to other types of generation.
They still have a place in smaller stationary power plant applications, performing emergency standby and peak load lopping duties. Additionally, they have the advantages of quick starting, relatively high efficiency and lower (CO2) emissions. At the time of writing, however, their particulate and nitrogen oxide emission levels are coming under scrutiny.
The components of a typical diesel power plant are shown in Figure 3.12.

Figure 3.12 Diesel engine power plant.
3.5.6 External Combustion Engines – The Stirling Engine
In a Stirling engine, a fixed amount of gas is enclosed in a working volume. The operation of a Stirling cycle is shown in Figure 3.13 on a P–v basis. It comprises two isothermal (1–2 and 3–4) and two isochoric (2–3 and 4–1) processes, which combine to form a closed working cycle. Heat addition takes place between 2 and 3.

Figure 3.13 Ideal Stirling cycle.
The theoretical cycle efficiency of a Stirling engine is equal to that of the Carnot, and, like the Carnot, is impossible to achieve because ideal processes are impractical.
Applying the first law of thermodynamics:
For the isothermal compression process 1–2:
Hence

Similarly, the process 3–4 is an isothermal expansion for which:

Hence, the efficiency can be written as:

which is identical to the Carnot efficiency.
In a real Stirling cycle, a regenerator is used to remove heat during process 4–1 and return it during process 2–3. So, the net heat input, qsup = q23 – q41.
Since the heat input is lower, the cycle efficiency is improved by regeneration.
There are three types of Stirling engine configuration:
- The alpha type has two cylinders containing expansion and compression spaces with a regenerator at the interface.
- The beta type has one cylinder and a displacer piston that moves the working fluid back and forth between the hot and cold heat exchangers.
- The gamma type has a displacer and a power piston, each working in their own separate cylinders (see Figure 3.14).

Figure 3.14 Stirling engine types.
3.6 Worked Examples
3.7 Tutorial Problems
- 3.1
A gas turbine unit has a pressure ratio of 6:1 and minimum and maximum cycle temperatures of 27 °C and 927 °C, respectively. The air enters the compressor at the rate of 1 kg/s and the combustor has an air‐to‐fuel ratio of 100:1. The isentropic efficiencies of the compressor and turbine are 100%. Assume combustion efficiency is 100% and the pressure drop in the combustor is negligible. Take Cp = 1.0 kJ/kg K and n = 1.4 to be constant throughout. Calculate:
- The net work output.
- The cycle efficiency.
- The work ratio of the plant.
- 3.2 Calculate the effect of isentropic efficiencies on the overall cycle efficiency of the plant in Problem 3.1. Take the isentropic efficiencies of the compressor and turbine to be 80% and 90%, respectively. Assume combustion efficiency is 100% and the pressure drop in the combustor is negligible. [Answers: 186 kW, 28.70%, 0.426]
- 3.3 Calculate the effect of a pressure drop in the combustor on the cycle efficiency of the system described in Problem 3.1. Consider the pressure drop to be 10%. [Answer: 263 kW, 37.58%, 0.567]
- 3.4 The gas turbine unit in Problem 3.1 is now fitted with a heat exchanger, with an effectiveness of 0.7. Calculate the reduction in the heat supply needed and the change in cycle efficiency. [Answers: 153 kW, +12%]
- 3.5 A gas turbine unit takes in air at 27 °C, has an air flow of 1 kg/s through a pressure ratio of 16:1 and a maximum cycle temperature of 927 °C. The compression takes place in one stage, while expansion is split into two stages, with optimal condition intermediate pressure and reheating at the intermediate pressure to 927 °C. The isentropic efficiency of the compressor, HPT and LPT turbines is 100%. Assume the combustion process to be 100% efficient and losses in pressure to be negligible. Assume the air‐to‐fuel ratio is 100:1. Take Cp = 1.0 kJ/kg K and n = 1.4 to be constant throughout. Calculate the net power output and the cycle efficiency of the plant. [Answers: 430 kW, 46%]
- 3.6 An engine working on the Otto cycle has a compression ratio of 9:1. At the beginning of the compression stroke, the temperature of the air is 0 °C and the pressure is 1 bar. 500 kJ/kg of heat is added at constant volume per cycle. Determine:
- The temperature at the remaining points in the cycle.
- The efficiency of the cycle.
[Answers: (a) T2 = 657 K, T3 = 1354 K, T4 = 562 K; (b) 58.47%]
- 3.7 An air standard Diesel cycle has a compression ratio of 9:1. 500 kJ/kg of heat is supplied to the working fluid per cycle. At the beginning of the compression process, the pressure and temperature are 1.0 bar and 0 °C, respectively. Determine the air standard thermal efficiency. For air, assume n = 1.4, Cp = 1.005 kJ/kg K, Cv = 0.718 kJ/kg K.
[Answer: 52.9%]
- 3.8 A diesel engine works on the dual combustion cycle and has a compression ratio of 9:1. At the start of compression, the air is at a temperature of 0 °C and the pressure is 1 bar. In the cycle, 250 kJ/kg heat is added at constant volume and a further 250 kJ/kg at constant pressure. Calculate the air standard efficiency of the cycle. For air, assume n = 1.4, Cp = 1.005 kJ/kg K, Cv = 0.718 kJ/kg K.
Assume a clearance volume of 10% of the total cylinder volume.
[Answer: 57.5%]
- 3.9 A Stirling engine uses air as the working fluid, operating with an isothermal compression at a temperature TC = 20 °C and an isothermal expansion process at temperature Th = 200 °C. It has a maximum volume of 600 cm3 and a minimum volume of 550 cm3. The lowest pressure in the cycle is 1 bar. Estimate the cycle efficiency (%) and the net power output (W) when the engine speed is 50 cycles/s.
For air, take R = 287 J/kg K and Cv = 718 J/kg K.
[Answers: 38%, 160 W]
- 3.10 A diesel engine with a compression ratio of 17:1 is to operate on biodiesel fuel. If the ambient temperature is 27 °C and the maximum temperature is 1227 °C, calculate:
- The temperatures at the end of the compression and expansion processes.
- The net work output.
- The thermal efficiency of the cycle.
[Answers: 931.7 K, 584 K, 296 kJ/kg, 64%]