CHAPTER 2
A Summary of the Current State of Risk Management
People who don't take risks generally make about two big mistakes a year. People who do take risks generally make about two big mistakes a year.
—PETER DRUCKER
Before we start changing any system, it's a good idea to get a reading on its current state and to figure out how it got that way. Risk management is a very old idea that has changed dramatically just in the past few decades.
The history of any idea brings its own baggage that often limits our current thinking on the concept and risk management is no exception. Institutions evolve, standards are codified, and professions mature in such a way that it causes all of us to think in more limited ways than we need to. So before we consider the current state, let's see how we got here.
A SHORT AND ENTIRELY-TOO-SUPERFICIAL HISTORY OF RISK
Organizational risk management could be said to have existed at least as early as the first time a king or chieftain decided to fortify walls, make security alliances, or store extra provisions in case of famine. Even more formalized risk management by agreement among parties seems to be a feature of the earliest civilizations. Since ancient Babylon, traders managed the risks of transporting goods great distances by having the buyers provide loans to the sellers that would be repaid with interest only when the goods arrived safely. The Code of Hammurabi by the Babylonian king of that name provided certain compensations or indemnifications for those harmed by bandits or floods. Babylon was also the birthplace of banking, where lenders managed risks starting with the careful selection of debtors.
But throughout most of human history, risk management was an unguided mitigation of risks. Choosing what risks to prepare for was always a matter of gut feel. What differentiates risk management since the start of the Age of Enlightenment is a more systematic approach to assessing the risk. The development of probability theory and statistics in the seventeenth century enabled risk to be quantified in a meaningful way. However, the typical context of these mathematical investigations were well-defined games of chance. These powerful new tools would be adopted only in select industries for select applications and, even then, only slowly.
From the eighteenth century to the beginning of the twentieth century, the quantitative assessment of risk was exemplified in—and largely limited to—insurance and banking. Although the term actuary predates even probability theory, it was not until the mid-nineteenth century that actuaries became an established profession with accreditation requirements and their methods had risen to earn the title of actuarial science.
Later in that period, we see quantitative risk analysis applied to financial markets and perhaps certain government agencies dealing with public health. Still, until the mid-twentieth century, the idea of a retailer or manufacturer using similar methods to assess risk in operations, new products, marketing campaigns, or major acquisitions was not seriously considered. For this reason, the executives in many firms may have treated risk management as synonymous with insurance or making sure the simplest and most obvious precautions are taken (and many still do today). At most, it was effectively a checklist approach in, for example, areas where safety was a key driver (aviation, mining, etc.).
By the 1960s, new methods and tools were being adopted by professionals outside of traditional insurance: engineers and economists. The emergence of computers and the ability to generate thousands of random scenarios with quantitative models made it possible to do the math with uncertain inputs. Engineers in nuclear power and oil and gas were among the first to adopt methods like this outside of insurance. Economists were influenced more by mathematical fields of game theory and decision theory, which provided for the mathematical description of common decision problems, especially decisions under uncertainty. The methods of engineers and economists were both connected to the fundamental ideas of probability theory, and they were largely developed in isolation from actuarial science.
By the end of the twentieth century, a fourth independent set of methods were being used as part of risk management, and these methods had almost no connection to the previous ideas developed by actuaries, economists, or engineers. Struggling to keep track of emerging risks, executives were hungry for a simple way to summarize the risk landscape, without necessarily adopting the more quantitative (and, at the time, more obscure) methods that came before them.
By the 1990s the major consulting firms promoted an early version of a common risk communication tool known as the risk matrix as well as various qualitative risk ranking or risk scoring methods. These were simple to use and simple to communicate. In some cases, pressure to adopt some sort of risk analysis method quickly encouraged the adoption of the simplest method without regard to its effectiveness. Once one approach gains momentum, prudent executives had a growing interest in using a method that everyone else was using. Every shock to the system, such as natural disasters, recessions, terrorism, emerging cybersecurity threats, and more, encouraged wider adoption of whatever simple method was gaining a foothold.
Firms were caught up in a growing “risk culture.” In response to demand for more clarity, several attempts to make so-called formal methodologies for risk assessment and risk management have evolved. Some of these methods are codified in influential standards such as the International Standards Organization (ISO) and the National Institute of Standards & Technology (NIST) in the US. More variations on these have been developed by numerous consulting firms, and many companies created customized approaches based on the same ideas.
If executives needed any more incentive to adopt risk management, new regulations continue to provide the extra push. Since 1988, the Basel I, II, and III Accords created new international standards and requirements for risk management in banking. In the United States, the Sarbanes-Oxley Act of 2002 and the President's Management Agenda (PMA) under Bush in 2001 stated sweeping requirements for risk analysis of all major government programs. All of these regulations required different organizations to adopt risk analysis methods, but without much detail, risk analysis was usually interpreted to be the simpler, qualitative methods. The European Union's General Data Protection Regulation (GDPR) in 2018 provided for the possibility of enormous potential fines for companies who have experienced breaches of personal data of the public. But its requirements for risk assessment specify only qualitative designations such as “high risk.” The Dodd-Frank Wall Street Reform and Consumer Protection Act (2009) specifically required that the Federal Deposit Insurance Commission (FDIC) use a risk matrix.
The need for risk assessment has grown much faster than the awareness of relative performance of solutions. The most popular, newer methods don't necessarily build on the foundation of earlier methods that have stood up to scientific and historical scrutiny. However, even the quantitative risk management methods used in finance revealed cracks under the light of the 2008/2009 financial crisis.
So let's try to map out this rapidly expanding “Wild West” frontier of risk management solutions. Things are moving fast, so this description will probably soon be incomplete. For now, we can examine how risk management is adopted in the modern organization, the risk assessment methods used, and the types of risk mitigation methods used.
CURRENT STATE OF RISK MANAGEMENT IN THE ORGANIZATION
Writing about the “current state” of anything in a book that gets a new edition once a decade may seem like a very low-resolution picture of reality. But the (unfortunate) slow pace of change makes the current state of risk management easier to capture even with such infrequent updates.
To get a finger on the pulse of the current state of risk management, we could rely on the anecdotes of my network of connections in risk management. And I do to some degree. But the best tool we have is structured surveys of various levels of management in organizations. My firm, Hubbard Decision Research (HDR), collaborated with The Netherlands office of the consulting firm KPMG to survey 283 organizations and risk experts from fifty-three countries across many industries. Organizations ranged in size: eighty-four had less than one hundred employees and seventy had more than ten thousand employees. Respondents represented analysts, risk managers, CEOs, and many levels in between. Our focus was to investigate details about how organizations and risk professionals actually assessed and managed risks and what the effect of those efforts were.
In addition to this survey, I have updated a summary of three major sources of surveys mentioned in the first edition of this book. We will look at some surveys conducted between 2007 and 2018 by The Economist Intelligence Unit (EIU),1 Aon Global Risk Consulting,2 and Protiviti.3 And I will throw in some related observations from two other smaller surveys conducted by HDR, which asked risk management–related questions: a 2015 survey of 173 cybersecurity experts and a 2018 survey of eighty project managers. All of the surveys included responses from organizations around the world, from small to Fortune 500 companies in many industries as well as large government agencies. Here is a summary of findings:
- Growth in risk management was fast but may have cooled off: In 2007, the Aon survey said 50 percent reported having a formal risk management function and 88 percent said the board was engaged in risk issues. The growth was apparently fast, for a while. The Aon 2017 survey says that 66 percent now have a formal risk function—down slightly from 2015. These numbers don't quite align with the findings of the HDR/KPMG survey, which found that of those who currently have a risk management function, 65 percent say they implemented it since 2007. (That difference could be a difference in the respondent population.) Furthermore, growth in the number of staff in those departments has leveled off according to the Aon survey.
- There is support for risk management—mostly: The 2017 EIU report states that lack of support from senior management was a concern of only 21 percent in the previous year and only 15 percent expect it to be a concern in the next year. However, the HDR/KPMG survey finds that a higher proportion (31 percent) believe there is “no recognition by top management in the importance of risk assessment.”
- Influence of risk management is not as high as it could be: Regarding influence, the HDR/KPMG survey finds that 67 percent say risk assessment is used to provide “some guidance” or “significant guidance” in “major decisions” whereas the 2017 EIU finds that only 47 percent say the risk function plays a role in strategic decisions.
CURRENT RISKS AND HOW THEY ARE ASSESSED
The Aon, Protiviti, and EIU surveys all asked respondents about their biggest risks. Of course, any survey about the perception regarding the biggest risks are probably transient, but here is the current snapshot.
Exhibit 2.1 summarizes the top five risks in each of these surveys. All three surveys were different but note that there is a bit more agreement between Aon and Protiviti than either of those have with EIU. This may be because EIU was asking specifically about risks in the next twelve months and the other two organizations didn't specify a time frame. Perhaps the EIU respondents felt that these risks were more relevant in the very near term.
These risk-ranking surveys have been taking place for many years and will probably go on for the foreseeable future but we should also ask how organizations determined these risks were their main concerns. On that question, these three surveys did not get into many specifics. That is where the HDR/KPMG surveys tried to fill the gap. Armed with all of this research, here is what we found:
EXHIBIT 2.1 Current Top Risks According to Three Surveys
| Protiviti | Aon | EIU |
| Disruptive technologies | Damage to reputation | Weak demand |
| Internal resistance to change | Economic slowdown | Market instability within own industry |
| Cyber threats | Increasing competition | Difficulty raising financing |
| Regulatory changes | Regulatory changes | Labor (skills shortage, strikes, etc.) |
| Timely identification and escalation of risks | Cyber threats | Exchange rate fluctuation |
- Respondents would mostly say their methods are “formal:” The 2017 Aon study found that 60 percent state they have adopted formal or partially formal approaches to risk management. The share that say they have a formalized risk management approach goes up with the size of the firm—96 percent of firms with revenue over $10 billion say they use a formalized approach. About 70 percent overall would claim to have a formal or partially formal approach.
- Formal mostly means “qualitative procedure” not quantitative: The HDR/KPMG survey found that what these $10 billion firms mean by formal is mostly (74 percent) a qualitative ranking or scoring method, perhaps using a form of the qualitative risk matrix. This is about the same for companies under that revenue threshold (78 percent). Only 16 percent of firms with revenue over $10 billion (and 20 percent of firms of all sizes) say they use quantitative methods—that is, they use explicit probabilities derived from mathematical and empirical methods using tools such as simulations and tools familiar to actuaries, statisticians, or quantitative risk analysts. Of those who use quantitative methods, the most common is Monte Carlo simulations (85 percent) followed by statistical analysis of historical data (77 percent). Less common are methods such as Bayesian statistics (56 percent) or utility theory (17 percent).
- There are obstacles to the adoption of quantitative methods, but adoption is feasible: In the 2007 Protiviti survey, 57 percent said they quantify risks “to the fullest extent possible,” up from 41 percent in 2006. Because, as we noted, only 20 percent of all firms use some form of actual probabilistic methods, it would seem that most respondents in the Protiviti survey would not consider these methods possible. In fact, our survey found that 42 percent said an obstacle to the adoption of quantitative methods was “skepticism about the practicality and effectiveness.” Yet our survey showed that those who use quantitative methods such as simulations and statistical methods come from a variety of industries and company sizes. Even though quantitative methods are common in some industries (finance, insurance, etc.), the users outside of those industries are arguably as diverse as the users of qualitative methods. Apparently, there will be active users of these methods in the same industries and contexts where there are also skeptics.
These surveys agree with my personal experience on some key points. I see that most organizations who say they follow a formal method are merely saying they follow a defined procedure. Whether that defined procedure is based on mathematically and scientifically sound principles—what has been measured to work—is another question altogether. (More on that later.) Exhibit 2.2 provides a summary of what risk assessment methods are used, according to the HDR/KPMG survey.
Each of the categories in exhibit 2.2 contains many specific variations. So, let's dive into each of them in more detail.
EXHIBIT 2.2 Summary of Risk Assessment Methods Used According to the HDR/KPMG Survey
| Method | Percentage of Respondents Using |
| Risk matrix based on a standard (ISO, NIST, etc.) | 14 |
| Internally developed risk matrix | 27 |
| Other qualitative scoring or ranking method | 32 |
| Probabilistic methods (e.g., math based including, simulations, statistical empirical methods, etc.) | 20 |
| Everything else (including expert intuition and various auditing methods) | 7 |
Expert Intuition, Checklists, and Audits
The most basic of these is part of the “everything else” category in exhibit 2.2—expert intuition. This is a sort of baseline of risk management methods. This is pure gut feel unencumbered by structured rating or evaluation systems of any kind. There are no points, probabilities, scales, or even standardized categories. There are shortcomings to this but there is also lot of value. Experts do know something, especially if we can adjust for various biases and common errors. In order for other methods to be of any value at all, they must show a measurable improvement on gut feel. (In fact, we will show later that unaided expert intuition isn't the worst of them.)
Other approaches that we lumped into the “everything else” category are various forms of audits and checklists. They don't do any structured prioritization of risks based on real measurements. They just make sure you don't forget something important and systematically search for problems. You definitely want your pilot and surgeon to use checklists and to guard against fraud or mistakes; you want your firm's books to be audited. I mention them here because it could be argued that checklists sometimes perform a pure assessment role in risk management. Most organizations will use audits and checklists of some sort even if they don't fall under the sort of issues risk managers may concern themselves with.
The Risk Matrix
The most common risk assessment method is some form of a risk matrix. A total of 41 percent of respondents in the HDR/KPMG survey say they use a risk matrix—14 percent use a risk matrix based on one of the major standards (e.g., NIST, ISO, COSO, etc.) and 27 percent use an internally developed risk matrix. Internally developed risk matrices are most common in firms with revenue over $10 billion, where 39 percent say that is the method they use.
Risk matrices are among the simplest of the risk assessment methods and this is one reason they are popular. Sometimes referred to as heat map or risk map, they also provide the type of visual display often considered necessary for communication to upper management. See exhibit 2.3 for an example of a risk map for both verbal categories and numerical scores.
As the exhibit shows, a risk matrix has two dimensions, usually labeled as likelihood on one axis and an impact on the other. Typically, likelihood and impact are then evaluated on a scale with verbal labels. For example, different levels of likelihood might be called likely, unlikely, extremely unlikely, and so on. Impact might be moderate or critical. Sometimes, the scales are numbered, most commonly on a scale of 1 to 5, where 1 is the lowest value for likelihood or impact and 5 is the highest. Sometimes these scores are multiplied together to get a “risk score” between 1 and 25. The risk matrix is often further divided into zones where total risk, as a function of likelihood and impact, is classified as high-medium-low or red-yellow-green.
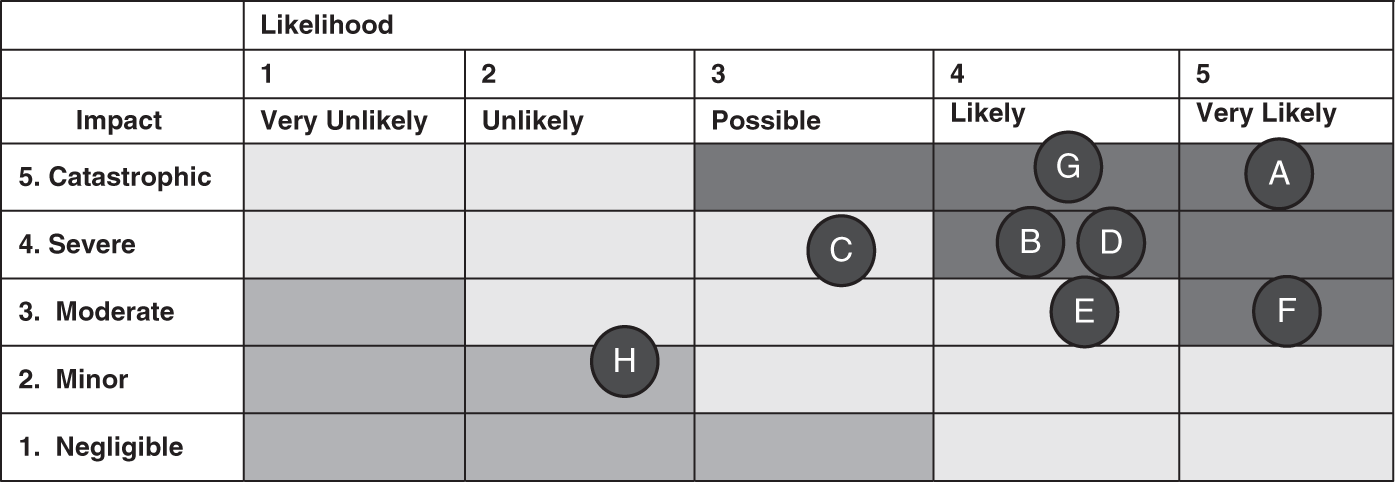
EXHIBIT 2.3 Does This Work? One Version of a Risk Map Using Either Numerical or Verbal Scales
There are many variations of risk matrices in many fields. They may differ in the verbal labels used, the point scale, whether the point scales are themselves defined quantitatively, and so on. Chapter 8 will have a lot more on this.
Other Qualitative Methods
The next most common risk assessment method is a qualitative approach other than the risk matrix. These include simply categorizing risks as high, medium, or low without even the step of first assessing likelihood and impact, as with the risk matrix. These also include more elaborate weighted scoring schemes in which the user scores several risk indicators in a situation, multiplies each by a weight, then adds them up. For example, in a safety risk assessment, users might score a particular task based on whether it involves dangerous substances, high temperatures, heavy weights, restricted movement, and so on. Each of these situations would be scored on some scale (e.g., 1 to 5) and multiplied by their weights. The result is a weighted risk score, which is further divided into risk categories (e.g., a total score of 20 to 30 is high and over 30 is critical). This sort of method can sometimes be informed by the previously mentioned checklists and audits.
Mathematical and Scientific Methods
The most sophisticated risk analysts will eventually use some form of probabilistic models in which the odds of various losses and their magnitudes are computed mathematically. It is the basis for modeling risk in the insurance industry and much of the financial industry. It has its own flaws but just as Newton was a starting point for Einstein, it is the best opportunity for continued improvement. It could use subjective inputs, as do the other methods, but it is also well-suited to accept historical data or the results of empirical measurements. This includes the probabilistic risk analysis used in engineering as well as quantitative methods used in finance and insurance. This means that uncertainties are quantified as a probability distribution. A probability distribution is a way of showing the probability of various possible outcomes. For example, there may be a 5 percent chance per year of a major data breach. If the breach occurs, there is a 90 percent chance the impact is somewhere between $1 million and $20 million.
As the previous survey showed, quantitative methods usually involve Monte Carlo simulations. This is simply a way of doing calculations when the inputs themselves are uncertain—that is, expressed as probability distributions. Thousands of random samples are run on a computer to determine the probability distribution of an output (say, the total losses due to cyberattacks) from the inputs (the various possible individual types of cyberattacks and their impacts).
These methods also include various types of statistical analysis of historical data. Although the lack of data is sometimes perceived as a problem in risk analysis (16 percent of HDR/KPMG survey respondents said this was a problem), statistical methods show you need less data than you think, and, if we are resourceful, you have more data than you think. There are a couple of categories of methods that are not strictly based on statistical methods or probabilities, but may get lumped in with mathematical or scientific methods, at least by their proponents. One is deterministic financial analysis. By deterministic I mean that uncertainties are not explicitly stated as probabilities. Readers may be familiar with this as the conventional cost-benefit analysis in a spreadsheet. All the inputs, although they may be only estimates, are stated as exact numbers, but there are sometimes attempts to capture risk analysis. For example, a discount rate is used to adjust future cash flows to reflect the lower value of risky investments. One might also work out best-case and worst-case scenarios for costs and benefits of various decisions.
One final approach that sometimes gets grouped together with mathematical methods in risk management includes expected utility theory, which gives us a way to mathematically make trade-offs between risk and return. These methods combine to create a quantitative method broader than risk analysis: decision analysis. As mentioned in chapter 1, risk analysis is only part of decision analysis. We will be spending a lot more time discussing these approaches.
Other methods under the umbrella of “preference theory” were originally created as derivatives of the previously mentioned expected utility theory, but instead of trading off risk and return, they purport to mathematically assist in the trade-offs of multiple different objectives. Variously named but similar methods include multi-attribute utility theory (MAUT), multi-criteria decision-making (MCDM), and analytic hierarchy process (AHP). They claim more mathematical validity than simple weighted scores but ultimately rely on statements of preferences, not forecasts or estimates, of experts. In the case of AHP, a more sophisticated method is used to determine whether the expert judgments are at least internally consistent. As with the other methods listed so far, these have been used on lots of decision analysis problems that might not strictly be risk assessments, but they are included here because they have been used to evaluate decisions according to their risks.
Whatever the chosen method may be, it should be used to inform specific actions. Many of those actions will involve choices regarding whether and how to mitigate risk in some way. You may decide to invest in new cybersecurity controls, keep tighter control over your supply chain, diversify production processes, increase the number of auditors, require new training, and so on. If they were free you would do them all. If all risk mitigation options were equally costly and equally effective, you could do them in any random order you like. But neither of those is the case. You will have more risks than you can realistically control for and the bang for the buck will vary widely. You will have to prioritize and make choices.
If these methods were used for no more than assessing corporate art for the reception area or where to have the company picnic, then the urgency of this evaluation would not be nearly as high. But, as I have already pointed out, these methods are being used for many of the biggest and riskiest decisions in the corporate world and government. Fortunately, some of these can be modified to produce an approach that can be shown to be a significant improvement on the baseline condition of expert intuition alone. Instead of improving on expert intuition, some apparently add error to expert intuition. Until this gets sorted out, improvements in risk management will not be possible.
NOTES
- 1. “Fall Guys: Risk Management in the Front Line,” Economist Intelligence Unit, 2010, https://advisory.kpmg.us/content/dam/advisory/en/pdfs/risk-assurance/risk-management-front-line.pdf; “Best Practice in Risk Management: A Function Comes of Age,” Economist Intelligence Unit, 2007, http://graphics.eiu.com/files/ad_pdfs/eiu_Risk_Management.pdf.
- 2. “Global Risk Management Survey 2017,” Aon Corporation, 2017; “Global Enterprise Risk Management Survey,” Aon Corporation, 2010; “Global Risk Management Survey 2007,” Aon Corporation, 2007, https://www.aon.com/getmedia/d95563c6-a3b8-4ff1-bb45-0ed511c78f72/2017-Global-Risk-Management-Survey-Report-rev-120318.aspx.
- 3. “Executive Perspectives on Top Risks for 2018,” Protiviti & NC State Poole College of Management, 2018; “2007 U.S. Risk Barometer: Survey of C-Level Executives with the Nation's Largest Companies,” Protiviti, 2007, https://www.protiviti.com/sites/default/files/united_states/insights/nc-state-protiviti-survey-top-risks-2018.pdf.