
CHAPTER 13
Reporting
In this chapter, we investigate reporting tools that empower the operational risk function with the opportunity to contribute to the business decision making at the firm. We consider loss data reporting in some depth and also discuss reporting on the other elements in the framework, including risk and control self-assessment, key risk indicators, and scenario analysis. Examples of fictional data are used to demonstrate how risk analysis can be applied to raw data in order to provide relevant reporting conclusions that can drive business decision making.
ROLE OF REPORTING
An operational risk framework is designed to identify, assess, monitor, control, and mitigate operational risk. All of the elements of the framework contribute to these goals, but without effective reporting even the best of programs will be ineffective in changing the risk culture of the firm. The place of reporting in the operational risk framework is illustrated in Figure 13.1.
The reporting of operational risk is key to the program's success. There are many ways to ensure that the reporting of each element drives action and to protect against the danger of producing reporting that receives a “so what?” response.
Generally, an operational risk department will be looking to report on several things, including:
- Operational risk event (loss) data for the previous period
- Remediation action being taken
- Key risk indicators (KRIs)
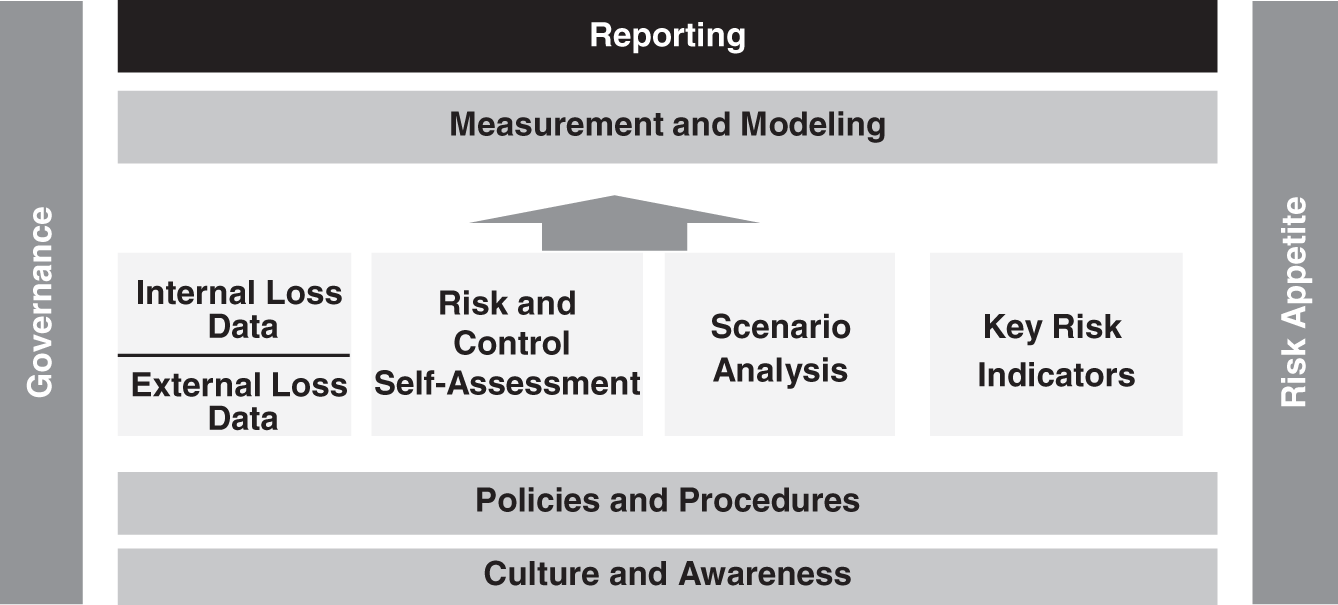
FIGURE 13.1 The Role of Reporting in the Operational Risk Framework
- Results of risk and control self-assessment (RCSA)
- Results of scenario analysis
- Capital calculation
- Whether the operational risk department is on track with its deliverables
However, the chief risk officer (CRO), risk committee, or other executive management may have different expectations, and they are more likely to be looking for reporting that addresses:
- Where is our risk?
- What action do we need to take?
- Who is under control?
- Who is not?
- Are we meeting our regulatory requirements?
Effective reporting is presented in a way that demonstrates the risk analyst role of the operational risk department. Just as market and credit risk specialists are focused on risk analysis, so too operational risk specialists should be risk analysts. Market risk and credit analysts:
- Analyze raw data
- Analyze trends and predictors
- Follow news articles
- Present opinions
- Present capital at risk (value at risk [VaR] and stressed VaR)
- Recommend action and hedging strategies
In the same way, operational risk managers should take on the same responsibilities for operational risk and should not just be data gatherers but should also:
- Analyze raw data
- Analyze trends and predictors (KRIs)
- Follow news articles
- Present opinions
- Present capital at risk
- Recommend action and mitigating strategies
OPERATIONAL RISK EVENT REPORTING
Operational risk event (loss) data reporting is often the central reporting activity in an operational risk function. Operational risk event data can be a mine of vital information that can contribute to effective operational risk management and measurement. However, it can also be redundant data if it is not properly presented in a way that can drive decision making.
Operational risk event data reporting typically looks something like the fictional example seen in Table 13.1.
While these data are somewhat self-explanatory, the method of collection and underlying assumptions might lead to a misinterpretation of the data. Therefore, it is important to ensure that the recipients of the event data reporting understand the background.
Impact of Gains on Internal Event Reporting
For example, in Table 13.1 the data may actually contain gains as well as losses. It may be an operational risk event report rather than a losses report. Table 13.1 shows that there were eight events in Investment Banking in December 2020 and that the net value of events was $10,000. However, there is no more detail provided on the nature of those eight events, and there may be significant information that is being masked from view.
An example of the underlying data for investment banking is seen in Table 13.2.
From the underlying data it is clear that one of the events was a gain of $12,500 and this gain is skewing the net events so that they total $10,000, when in fact operational risk losses totaled $22,500 if gains are excluded. The amount at risk might actually be $35,000—the absolute value of the events, as it was probably only luck that the seventh event was a gain instead of a loss.
TABLE 13.1 Example Operational Risk Event Data Table
| December 2020 | 12-Month Total | ||||||||
|---|---|---|---|---|---|---|---|---|---|
| Business Line | Absolute $ Value of Events | # Events | Gross $ Value of Events | $ Recovery | Net $ Value of Events | Trend | # Events | Gross $ Value of Events | Net $ Value of Events |
| Fixed Income | 150,000 | 10 | (65,000) | 5,000 | (60,000) | 185 | (650,000) | (350,000) | |
| Investment Banking | 35,000 | 8 | (10,000) | (10,000) | 65 | (435,000) | (400,000) | ||
| Equities | 250,000 | 65 | (208,000) | 55,000 | (153,000) | 450 | (8,500,000) | (2,500,000) | |
| Asset Management | 120,000 | 28 | (120,000) | 25,000 | (95,000) | 235 | (11,350,000) | (5,500,000) | |
| Private Wealth Management | 70,000 | 35 | (70,000) | (70,000) | 625 | (12,560,000) | (2,000,000) | ||
| Total | 625,000 | 146 | (473,000) | 85,000 | (388,000) | 1560 | (33,495,000) | (10,750,000) | |
TABLE 13.2 Example Investment Banking Operational Risk Event Detail
| Investment Banking Events in $, December 2020 | |||||
|---|---|---|---|---|---|
| Absolute | Gross | Recovery | Net | Total Net Loss | |
| Event 1 | 2,000 | (2,000) | 0 | (2,000) | (2,000) |
| Event 2 | 2,000 | (2,000) | 0 | (2,000) | (2,000) |
| Event 3 | 4,000 | (4,000) | 0 | (4,000) | (4,000) |
| Event 4 | 2,000 | (2,000) | 0 | (2,000) | (2,000) |
| Event 5 | 5,000 | (5,000) | 0 | (5,000) | (5,000) |
| Event 6 | 2,000 | (2,000) | 0 | (2,000) | (2,000) |
| Event 7 | 12,500 | 12,500 | 0 | 12,500 | 0 |
| Event 8 | 5,500 | (5,500) | 0 | (5,500) | (5,500) |
| Total | 35,000 | (10,000) | 0 | (10,000) | (22,500) |
Therefore, it is important to ensure that the recipients of a report such as Table 13.1 are aware of whether gains are being netted against losses. Perhaps this nuance would be lost on the audience. If so, the absolute dollar value of the events might be a better indicator of operational risk and the report might be changed to reflect that.
Trends in Internal Losses
The fictional operational risk data Table 13.1 includes a trend column. This trend needs more explanation in order to be informative. The presenter of the report will need to clarify whether the trend relates to month-on-month changes, changes relative to the average over the past year, or some other benchmark. The trend could also relate to any of the previous columns, and so clarification is needed as to whether it relates to the number of events or to the dollar amount of the absolute, gross, or net amount.
Trends can be helpful, as they can indicate a changing risk environment that may require action. Trends of loss size against number of events might provide insight into improving or worsening control environments. An example of using trends to compare events and net losses is provided in Figure 13.2.
It can also be helpful to compare trends in business lines and in risk categories to see where the risks are elevated. This information is particularly helpful when considering entering into a new business. Trends and history from similar business lines can be used to help with the assessment of the likely operational risk exposures that may arise in this new business line.
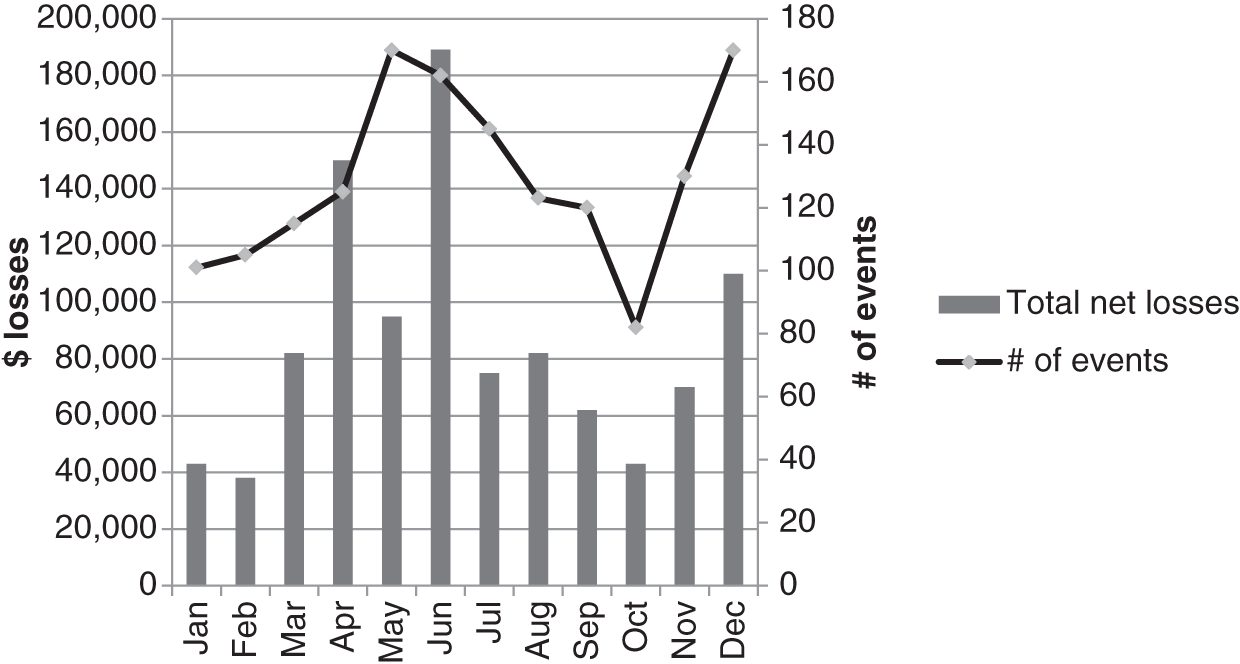
FIGURE 13.2 Trending Loss Amount vs. Number of Events
Risk Analysis of Table 13.1
There may be a story behind the raw numbers that is not apparent without explanation and analysis from the operational risk department. Looking again at the fictional operational risk event in Table 13.1, it is clear that there is a large difference between the total gross amount of losses ($33,495,000) and the total net amount ($10,750,000) of losses for the past 12 months.
This difference begs for analysis and explanation and suggests that this firm is very good at recovering amounts lost in operational risk events. Recoveries are usually achieved through expert employees who intervene and recover some, or all, of the initial loss amount. Recoveries are more often driven by people than by automated systems, suggesting that the excellent recovery rate reflected in this data is dependent on experienced personnel.
This analysis takes on significance if the firm is currently downsizing or has experienced a significant structural change in its staffing model, such as all of the employees working remotely due to a global pandemic. An operational risk manager could use this loss data to alert senior management that they might experience an increase in net losses due to weaker recovery rates as a result of the current downsizing or remote working strategy of the firm.
The recovery rate might also be used to drive a discussion about what efforts could be made to further improve the recovery rates and what the cost benefit might be of such initiatives.
This type of analysis, linking operational risk data to the business activities and strategies of the firm, demonstrates the relevance and importance of the operational risk function and properly provides increased transparency into operational risk exposures.
Internal Losses by Risk Category
The same operational risk event data can also be presented by risk category rather than by business line, as follows. The fictional data in Table 13.1 provides a view into how each business is doing compared to the other business lines. There may be opportunities for more analysis if the data are cut differently, by risk category, as in Table 13.3.
Risk Analysis of Table 13.3
Several stories can be told from this cut of the data. It is clear that most of the events occur in the Execution, Delivery, and Process Management category as it has experienced 1,100 events over the past 12 months—significantly higher than any other category.
However, the highest loss amounts occur in the Clients, Products, and Business Practices category, which has the lion's share of the dollar value of the losses at $18.5 million over the past year. This suggests that the latter are more prone to fat-tail events.
The firm will want to confirm whether this pattern of losses is to be expected, and it can be helpful to compare risk category data to external benchmarks. The data can be compared to benchmarks from sources such as the ORX consortium data discussed in Chapter 8.
Further analysis of these data shows that this firm has a good experience with recoveries from fraud events. They have experienced 32 internal events and two external events, but the net losses are small compared to the gross losses, indicating that there have been successful recoveries in these cases.
Timeliness
A report that tracks the timeliness of reporting of internal loss data events can be a powerful tool in driving culture change within a firm. Transparent reporting of loss reporting behavior can be very effective in inspiring better behavior and can drive reporting times down.
If loss data is reported late, it not only exposes the firm to unmitigated risks, but it may also impact the capital calculation if the firm has an AMA or Standardized Approach that uses loss data as a direct input into the model.
Timeliness can be tracked in several ways:
- Time from occurrence to identification
- Time from identification to entry in the loss database
- Time from entry to sign-off
It should be noted that legal losses often have a long time lag between occurrence and identification, and this needs to be handled thoughtfully when tracking timeliness of loss data. Any combination of the above criteria can be used to drive better reporting behavior. Timeliness can often be adversely impacted due the slow response of another department, and this can also be reflected in reporting statistics. For example, the front office areas might complain that the finance department is very slow to complete their portion of the data when accounting issues are involved. Tracking the timeliness of all events that impact the finance department can be made transparent and encourage more efficiencies in the finance area.
TABLE 13.3 Example Operational Risk Event Data Cut by Risk Category
| December 2020 | 12-Month Total | ||||||||
|---|---|---|---|---|---|---|---|---|---|
| Risk Category | Absolute $ Value of Events | # Events | Gross $ Value of Events | $ Recovery | Net $ Value of Events | Trend | # Events | Gross $ Value of Events | Net $ Value of Events |
| Business Disruption and System Failure | 5,000 | 8 | (5,000) | $5,000 | 0 | 45 | (650,000) | (150,000) | |
| Clients, Products, and Business Practices | 265,000 | 28 | (158,000) | 0 | (158,000) | 88 | (18,500,000) | (7,450,000) | |
| Execution, Delivery, and Process Management | 190,000 | 97 | (145,000) | 80,000 | (65,000) | 1,100 | (6,540,000) | (2,400,000) | |
| Damage to Physical Assets | 20,000 | 10 | (20,000) | 0 | (20,000) | 235 | (1,200,000) | (200,000) | |
| Employment Practices and Workplace Safety | 120,000 | 2 | (120,000) | 0 | (120,000) | 56 | (3,450,000) | (500,000) | |
| Internal Fraud | 25,000 | 1 | (25,000) | 0 | (25,000) | 32 | (2,655,000) | (50,000) | |
| External Fraud | 0 | 0 | 0 | 0 | 0 | 4 | (500,000) | 0 | |
| Total | 625,000 | 146 | (473,000) | 85,000 | (388,000) | 1560 | (33,495,000) | (10,750,000) | |
External Loss Data Reporting
Operational risk reporting often includes a summary and analysis of relevant external events over the past reporting period. These should be reviewed for relevance and lessons learned. It is always more popular to discuss bad things that have happened to competitors than it is to talk about bad things that have happened at the firm. Significant external events offer an opportunity to consider “could it happen here?”
Senior management are often very engaged in such discussions, and this can lead to proactive operational risk mitigation activities that can be led by the operational risk function or kicked off and tracked by that function.
Any emerging trends, such as an increase in regulatory fines in a particular area, should be compared to the firm's internal experience and current risk and control environment.
For example, if external data indicate that there has been an increase in the levying of regulatory fines for breaches in the Foreign Corrupt Practices Act (FCPA), then the operational risk manager might propose a review of the firm’s current FCPA training and awareness to ensure that these controls are functioning at peak levels of effectiveness.
If the firm is a member of a consortium of loss data, then the internal loss results should be compared to the benchmarking results that the consortium makes available. Comparisons between external and internal data should always be treated with caution, as there may be significant differences in the business models, products, and control environments that could lead to incorrect conclusions.
However, as discussed earlier, external data can provide helpful awareness of risks that may not yet have occurred at the firm but that should be seriously addressed.
RISK AND CONTROL SELF-ASSESSMENT REPORTING
The output from RCSAs is generally reported in detail to the participating department and in summary or thematic form to senior management. While the full RCSA output demonstrates that analysis and recommendations are based on strong underlying data, the details themselves are rarely of interest to the risk committee or CRO.
Instead, the operational risk department can analyze the RCSA output and identify areas that require escalation and raise themes that are best addressed on a firm-wide basis.
For example, if multiple departments have identified through RCSAs that their employee training is weak, then a firm-wide training and development initiative might be a more appropriate response than many individual training programs.
The operational risk department might also have noticed underlying themes during their facilitation of the RCSA exercise, such as a lack of awareness of appropriate fraud controls. This might give rise to a firm-wide initiative to raise awareness of appropriate fraud risk mitigation activities.
RCSA thematic data might also be enhanced by regular monitoring of triggers that have been identified as requiring a reassessment of all or part of an RCSA. A large internal or external event might result in a recommendation by the operational risk department that the firm, or one division of the firm, revalidate the risk and control scores for that particular risk. For example, a sudden increase in fines for FCPA breaches might result in the next operational risk report to senior management including a request to reassess all corruption and bribery risks in the firm.
KEY RISK INDICATOR REPORTING
KRIs are particularly well suited to dashboard-type reporting. There are many tools available to present data to management in a way that highlights red flags and allows for drill-down capabilities to review the underlying sources of data.
However, complex and comprehensive KRI reports are often provided to senior management without sufficient analysis and explanation, leaving the audience with a “so what?” response. For this reason, an operational risk department might decide to review all KRI reports with the departments that own the data and only provide a summary to senior management. Exception reporting of red flags that require escalation might be more valuable than a comprehensive KRI report that shows all KRIs for the firm.
KRI reports are often designed to use color to indicate whether there is a concern, with different thresholds for red, yellow, or green.
The dangers with KRI reporting are that a sea of green might give a false sense of security and a sea of red might produce panic, when the underlying KRIs and thresholds have not yet been proven to be indicative of raised or lowered risk.
Careful explanation and analysis must therefore accompany any KRI dashboard reporting that is provided to senior management.
SCENARIO ANALYSIS REPORTING
The results of the scenario analysis program may drive changes to any Advanced Measurement Approach (AMA) to calculating operational risk capital. They may also produce important mitigating actions that require escalation to senior management.
While the details of the scenario analysis output are unlikely to be of interest to senior management, the implications of those results and their impact on capital will certainly be of interest. In the same way, any proposed mitigating actions may need to be presented to senior management for approval and funding. Scenario analysis results can also give an organization's senior management a good indication of the firm's “top risks” and help the firm manage against them.
The scenario detail will be of importance to any department that is impacted by the results and should be included in their department-level reporting. The form of scenario analysis reporting will depend on the type of program that is in place.
CAPITAL REPORTING
Operational risk capital will need to be reported to senior management and the board, who are likely to be very interested in the drivers of capital and, if an AMA model is in place, any reporting of capital will need to be accompanied by a simple, but complete, explanation of the model and its drivers. As operational risk capital is a direct and sometimes significant driver of risk-weighted assets (RWA), senior management would benefit from understanding how operational risk capital drives RWA. Also, firms can do informative peer analysis of operational risk capital by leveraging public information (e.g., Bloomberg) or data provided from a consortium like ORX to create useful peer comparison. Key metrics to compare across the industry can include:
- Op Risk RWA as a percentage of total RWA
- Op Risk RWA as a percentage of total revenue
Finally, but importantly, looking at operational risk RWA by business unit can help drive business decisions. If the BIA or TSA approach is being used for capital calculation, then it may be prudent to include a reminder of the method being used. Capital calculation methodologies will soon be simplified when the new Standardized Approach becomes mandatory. As firms prepare for this transition they should use the reporting forum to explain how the capital calculation will be impacted and to share a parallel run calculation to ensure that senior management is prepared for the change.
ACTION TRACKING REPORTING
There are usually many action items generated by an operational risk management framework. Actions arise from operational risk events that require actions to ensure a recovery of the lost amount, or to prevent a repeat of the same event. Actions arise during an RCSA as control improvements are identified and mitigating actions are agreed upon. Actions arise during scenario analysis as fat-tail events are discussed and firm-wide mitigating actions proposed.
In addition to all of the action items that arise in the operational risk framework, there are usually other action items that are operational risk–related but are owned by other areas of the firm. For example, the Sarbanes-Oxley team and the audit department will be tracking their own set of action items, most of which are in fact operational risk related.
Some firms integrate all action tracking into one tool and one business process; this is discussed further under “Governance, Risk, and Compliance” in Chapter 16. However, many firms still do not yet have an integrated action tracking process. This does not prevent the operational risk department from adding value to the organization by bringing the reporting of those action items into one report so that management can have a clearer view of the operational risk of the firm.
For example, an integrated report could look like something like the example in Table 13.4.
An integrated action table is helpful in assessing which business lines or support areas are managing their risks effectively. The example in Table 13.4 shows the output at a firm where there are different action tracking methods in operational risk, in audit, and in Sarbanes-Oxley (SOX). Operational risk is tracking all completed open and past due items, audit only tracks past due items once they are more than 90 days late, and SOX only tracks whether items are open.
Ideally, all groups will eventually align to one action tracking method, but even though there are different approaches, reporting can still occur and can still be helpful. All departments have action items to track, both support areas and front office business lines. This is unlike operational risk data reporting, where Table 13.1 showed only the front office business lines, as they own the loss. In loss data reporting, some firms do also track events by cause and so may have results for support areas also.
TABLE 13.4 Example of Integrated Action Tracking Reporting
| Operational Risk | Internal Audit | SOX | Total | ||||
|---|---|---|---|---|---|---|---|
| Business Unit | Completed | Open | Past Due | Open | > 90 Days Past Due | Open | Open Action Items |
| Finance | 25 | 5 | 2 | 6 | 3 | 8 | 19 |
| Human Resources | 20 | 2 | 2 | 3 | 0 | 0 | 5 |
| Legal | 10 | 0 | 0 | 2 | 2 | 0 | 2 |
| Operations | 45 | 5 | 4 | 8 | 3 | 1 | 14 |
| Technology | 28 | 8 | 2 | 7 | 1 | 5 | 20 |
| Fixed Income | 10 | 2 | 0 | 5 | 1 | 2 | 9 |
| Investment Banking | 8 | 1 | 1 | 8 | 1 | 0 | 9 |
| Equities | 5 | 1 | 1 | 12 | 2 | 5 | 18 |
| Asset Management | 14 | 2 | 1 | 12 | 7 | 0 | 14 |
| Private Wealth Management | 13 | 5 | 5 | 2 | 2 | 1 | 8 |
| Total | 178 | 31 | 18 | 65 | 22 | 22 | 118 |
Risk Analysis of Table 13.4
As a raw table of data, this report does leave the observer wondering “so what?” Where is there an area of concern or a need for escalation? Further analysis is helpful to present the information in a way that supports business decision making.
Table 13.4 suggests that the finance, technology, and equities departments need to move more urgently to address the outstanding action items in their areas as they have the highest number of open action items.
If the operational risk department has been successful in partnering with the SOX and audit departments to such a degree that all three are categorizing their action items by the same risk categories, then it is also possible to produce a risk category cut of the same data.
Such a cut might produce data that could populate a pie chart such as the one shown in Figure 13.3.
From this view we can see that the majority of open action items in this fictional set are in the execution, delivery, and process management category. However, perhaps the late action items tell a different and more compelling story, as shown in Figure 13.4.
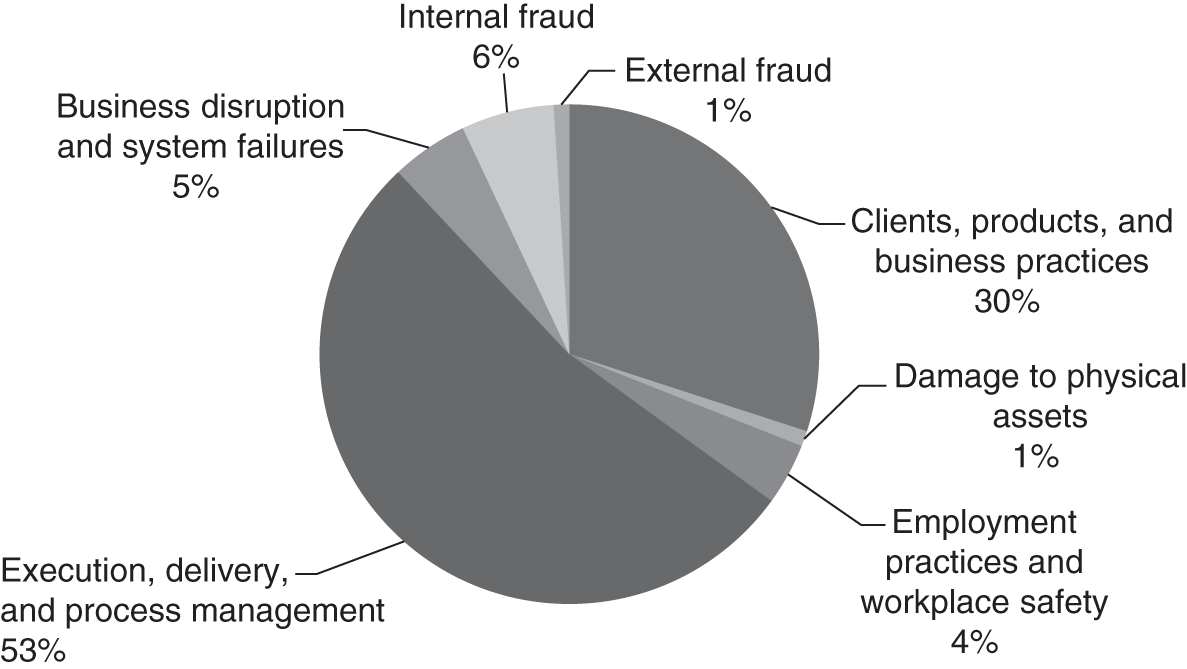
FIGURE 13.3 Fictional Action Open Items by Risk Category, Pie Chart

FIGURE 13.4 Fictional Late Action Items by Risk Category, Pie Chart
From this view it is clear that the real concern should be around the resolution of the many late Clients, Products, and Business Practices items, as these relate to a risk category that is prone to fat-tail events.
This demonstrates how analysis and explanation by the operational risk department can lead to decision points for senior management. This chart would best be presented along with a request to follow up on all late Clients, Products, and Business Practices action items in the firm, to ensure they are reprioritized as high priority and addressed as soon as possible.
A CONSOLIDATED VIEW
All of this operational risk data can be brought together into one view, to provide a snapshot of the current overall risk profile for each department. Just one example of how this might be done is shown in Table 13.5. If this report is for the CRO, risk committee, or board, then the overall risk rating should be the independent view of the corporate operational risk function, acting in its role as a second line of defense.
DASHBOARDS
Some firms bring together all of their reporting into one view so that the total risk exposure for each department can be clearly seen and compared. There are many sophisticated software solutions for this type of reporting. Some have drill-down capabilities so that an area of interest can be clicked on in order to see the underlying data.
KEY POINTS
- Strong, analytical reporting is fundamental to a successful operational risk framework and provides the opportunity to drive business decision making.
- Reporting will usually include analysis of internal loss data, external loss data, risk and control self-assessment results, scenario analysis results, and capital.
- Action tracking across the firm can be consolidated under the operational risk framework.
- A risk profile can be subjectively determined from the underlying data.
- Dashboards are readily available today and provide drill-down capabilities for interactive reporting.
TABLE 13.5 Consolidated View of Operational Risk Outputs to Produce a Risk Profile
| December 2020 Risk Profile | New Losses $m | RCSA Score | Highest Scenario $m | Late Action Items | Overall Risk Rating | |||||||
|---|---|---|---|---|---|---|---|---|---|---|---|---|
| Business Unit | Owned | Caused | CPBP | EDPM | IF | EF | EPWS | DPA | BDSF | |||
| Finance | 2.1 | H | M | M | M | L | L | L | — | 20 | M | |
| Human Resources | 0.4 | L | M | L | L | H | L | L | — | 5 | M | |
| Legal | 1.2 | L | L | L | L | L | L | L | — | 0 | L | |
| Operations | 2.1 | H | H | M | M | L | L | L | — | 16 | H | |
| Technology | 5.0 | L | M | L | H | L | L | L | — | 55 | H | |
| Fixed Income | 11.0 | 2.0 | M | M | M | M | M | L | L | 2,000 | 12 | M |
| Investment Banking | 2.5 | 1.0 | L | L | L | L | L | L | L | 500 | 4 | L |
| Equities | 2.5 | 1.0 | H | M | L | L | L | L | L | 2,500 | 6 | M |
| Asset Management | 0.6 | 2.0 | L | M | L | L | L | L | L | 650 | 18 | L |
| Private Wealth Management | 1.2 | 1.0 | L | L | L | L | L | L | L | 100 | 42 | L |
REVIEW QUESTION
- Which of the following is most likely to generate informed business decisions based on operational risk considerations?
- A table showing raw operational risk loss data
- A table containing the total capital required using the Basic Indicator Approach
- A list of themes raised through the RCSA process with proposed mitigating actions
- A list of the latest scenario analysis maximum loss estimates