
Chapter 9
MARGIN ANALYSIS: STRUCTURE
If financial analysis were a puppet, company strategy would be pulling its strings
An analysis of a company's margins is the first step in any financial analysis. It is a key stage because a company that does not manage to sell its products or services for more than the corresponding production costs is clearly doomed to fail. But, as we shall see, positive margins are not sufficient on their own to create value or to escape bankruptcy.
Net income is what is left after all the revenues and charges shown on the income statement have been taken into account. Readers will not therefore be very surprised to learn that we will not spend too much time on analysing net income as such. A company's performance depends primarily on its operating performance, which explains why recurring operating profit (or EBIT) is the focus of analysts' attention. Financial and non-recurrent items are regarded as “inevitable” or “automatic” and thus less interesting, particularly when it comes to forecasting a company's future prospects.
The first step in margin analysis is to examine the accounting practices used by the company to draw up its income statement. We dealt with this subject in Chapter 8 and shall not restate it here, except to stress how important it is. Given the emphasis placed by analysts on studying operating profit, there is a big temptation for companies to present an attractive recurring operating profit by transferring operating charges to financial or non-recurring items (or a “non-current” category in IFRS).
The next stage involves a trend analysis based on an examination of the revenues and charges that determined the company's operating performance. This is useful only insofar as it sheds light on the past to help predict the future. Therefore, it is based on historical data and should cover several financial years. Naturally, this exercise is based on the assumption that the company's business activities have not altered significantly during the period under consideration.
The main potential pitfall in this exercise is adopting a purely descriptive approach, without much or any analytical input, e.g. statements such as “personnel cost increased by 10%, rising from 100 to 110…”.
Margin trends are a reflection of a company's:
- strategic position, which may be stronger or weaker depending on the scissors effect; and
- risk profile, which may be stronger or weaker depending on the breakeven effect that we will examine in Chapter 10.
As we saw in Chapter 8, analysing a company's operating profit involves assessing what these figures tell us about its strategic position, which directly influences the size of its margins and its profitability:
- a company lacking any strategic power will, sooner or later, post a poor, if not negative, operating performance;
- a company with strategic power will be more profitable than the other companies in its business sector.
In our income statement analysis, our approach therefore needs to be far more qualitative than quantitative.
Section 9.1 HOW OPERATING PROFIT IS FORMED
By-nature format income statements (raw material purchases, personnel cost, etc.), which predominate in Continental Europe, provide a more in-depth analysis than the by-function format developed in the Anglo-Saxon tradition of accounting (cost of sales, selling and marketing costs, research and development costs, etc.). Granted, analysts only have to page through the notes to the accounts for the more detailed information they need to get to grips with. In most cases, they will be able to work back towards EBITDA1 by using the depreciation and amortisation data that must be included in the notes or in the cash flow statement.
1/ SALES
Before sales volumes can be analysed, external growth needs to be separated from the company's organic growth, so that like can be compared with like. This means analysing the company's performance (in terms of its volumes and prices) on a comparable-structure basis and then assessing additions to and withdrawals from the scope of consolidation. In practice, most groups publish pro forma accounts in the notes to their accounts, showing the income statements for the relevant and previous periods based on the same scope of consolidation and using the same consolidation methods.
If a company is experiencing very brisk growth, then analysts will need to look closely at the growth in operating costs and the cash needs generated by this growth.
A company experiencing a period of stagnation will have to scale down its operating costs and financial requirements. As we shall see later in this chapter, production factors do not have the same flexibility profile when sales are growing as when sales are declining.
Where a company sells a single product, volume growth can easily be calculated as the difference between the overall increase in sales and the selling price of its product. Where it sells a variety of different products or services, analysts face a trickier task. In such circumstances, they have the option of either working along the same lines by studying the company's main products or calculating an average price increase, based on which the average growth in volumes can be estimated.
An analysis of price increases provides valuable insight into the extent to which overall growth in sales is attributable to inflation. The analysis can be carried out by comparing trends in the company's prices with those in the general price index for its sector of activity. Account also needs to be taken of currency fluctuations and changes in the product mix, which may sometimes significantly affect sales, especially in consolidated accounts.
In turn, this process helps to shed light on the company's strategy, i.e.:
- whether its prices have increased through efforts to sell higher-value-added products;
- whether prices have been hiked owing to a lack of control on administrative overheads, which will gradually erode sales performance;
- whether the company has lowered its prices in a bid to pass on efficiency gains to customers and thus to strengthen its market position;
- etc.
The impact of changes in exchange rates on business activity should be compared with the exposure of costs to these same currencies. A company producing and selling in the same country will only be exposed on the margin in contrast to an exporting company which is exposed on sales.
2/ PRODUCTION
Sales represent what the company has been able to sell to its customers. Production represents what the company has produced during the year and is computed as follows:
First and foremost, production provides a way of establishing a relationship between the materials used during a given period and the corresponding sales generated. As a result, it is particularly important where the company carries high levels of inventories or work in progress. Unfortunately, production is not entirely consistent insofar as it lumps together:
- production sold (sales), shown at the selling price;
- changes in inventories of finished goods and work in progress and production for own use, stated at cost price.
Consequently, production is primarily an accounting concept that depends on the methods used to value the company's inventories of finished goods and work in progress.
A faster rate of growth in production than in sales may be the result of serious problems:
- overproduction, which the company will have to absorb in the following year thanks to market growth or conversely, by curbing its activities, bringing additional costs;
- overstatement of inventories' value, which will reduce the margins posted by the company in future periods.
Production for own use does not constitute a problem unless its size seems relatively large. From a tax standpoint, it is good practice to maximise the amount of capital expenditure that can be expensed, in which case production for own use is kept to a minimum. An unusually high amount may conceal problems and an effort by management to boost book profit superficially.
3/ GROSS MARGIN
Gross margin is the difference between production and the cost of raw materials used:
It is useful in industrial sectors where it is a crucial indicator and helps to shed light on a company's strategy.
This is another arena in which price and volume effects are at work, but it is almost impossible to separate them out because of the variety of items involved. At this general level, it is very hard to calculate productivity ratios for raw materials. Consequently, analysts may have to make do with a comparison between the growth rate in cost of sales and that in net sales (for by-function income statements), or the growth rate of raw materials and that in production (for by-nature income statements). A sustained difference between these figures may be attributable to changes in the products manufactured by the company or improvements (deterioration) in the production process.
Conversely, internal analysts may be able to calculate productivity ratios based on actual raw material costs used in the operating cycle, since they have access to the company's management accounts.
4/ GROSS TRADING PROFIT
Gross trading profit is the difference between the selling price of goods for sale and their purchase cost:
It is useful only in the retail, wholesale and trading sectors, where it is a crucial indicator and helps to shed light on a company's strategy. It is generally more stable than its components (i.e. sales and the cost of goods for sale sold), with the distributor being able to pass on price increases to the end customer and competition market dynamics imposing a price reduction when the purchase price of goods sold decreases.
5/ VALUE ADDED
This represents the value added by the company to goods and services purchased from third parties through its activities. It is equivalent to the sum of gross trading profit and gross margin used minus other goods and services purchased from third parties.
It may thus be calculated as follows for by-nature income statements:
Other operating costs comprise outsourcing costs, property or equipment rental charges,2 the cost of raw materials and supplies that cannot be held in inventory (i.e. water, energy, small items of equipment, maintenance-related items, administrative supplies, etc.), maintenance and repair work, insurance premiums, studies and research costs, fees payable to intermediaries and professional costs, advertising costs, transportation charges, travel costs, the cost of meetings and receptions, postal charges and bank charges (not interest on bank loans, which is booked under interest expense).
For by-function income statements, value added may be calculated as follows:
At company level, value added is of interest only insofar as it provides valuable insight regarding the degree of a company's integration within its sector.
Besides that, we do not regard the concept of value added as being very useful. In our view, it is not very helpful to make a distinction between what a company adds to a product or service internally and what it buys in from the outside. This is because all the decisions of a company are tailored to the various markets in which it operates, such as the markets for labour, raw materials, capital goods, to cite but a few. Against this backdrop, a company formulates a specific value-creation strategy, i.e. a way of differentiating its offering from that of its rivals in order to generate a revenue stream.
This is what really matters – not the internal/external distinction.
In addition, value added is only useful where a market-based relationship exists between the company and its suppliers in the broad sense of the term, e.g. suppliers of raw materials, and suppliers of labour. In the food sector, food-processing companies usually establish special relationships with the farming industry. As a result, a company with a workforce of 1,000 may actually keep 10,000 farmers in work. This raises the issue of what such a company's real value added is.
6/ PERSONNEL COST
This is a very important item because it is often high in relative terms. Personnel expense and payroll charges also include employee incentive payments, stock options and profit-sharing.
Although personnel cost is theoretically a variable cost, it actually represents a genuinely fixed-cost item from a short-term perspective.
A financial analysis should focus both on volume and price effects (measured by the average total salary cost  ratio) as well as the employee productivity ratio, which is measured by the following ratios:
  or
or ![]() . Since external analysts are unable to make more accurate calculations, they have to make a rough approximation of the actual situation. In general, productivity gains are limited and are thinly spread across most income statement items, making them hard to isolate.
. Since external analysts are unable to make more accurate calculations, they have to make a rough approximation of the actual situation. In general, productivity gains are limited and are thinly spread across most income statement items, making them hard to isolate.
Analysts should not neglect the inertia of personnel cost, as regards either increases or decreases in the headcount. If 100 additional staff members are hired throughout the year, this means that only 50% of their salary costs will appear in the first year, with the full amount showing up in the following period. The same applies if employees are laid off.
7/ EARNINGS BEFORE INTEREST, TAXES, DEPRECIATION AND AMORTISATION (EBITDA)
As we saw in Chapter 3, EBITDA (earnings before interest, taxes, depreciation and amortisation) is a key concept in the analysis of income statements. The concepts we have just examined, i.e. value added and production, have more to do with macroeconomics, whereas EBITDA firmly belongs to the field of microeconomics.
EBITDA is the difference between all operating revenues and all operating expenses that will eventually result in a cash inflow or outflow. It is computed as follows:
Alternatively, for by-nature income statements, EBITDA can be computed as follows:
Other operating costs comprise redundancy payments, recurring restructuring charges, payments relating to patents, licences, concessions, representation agreements and directors' fees. Other operating revenues include payments received in respect of patents, licences, concessions, representation agreements, directors' fees, operating subsidies received.
Impairment losses on current assets include impairment losses related to receivables (doubtful receivables), inventories, work in progress and various other receivables related to the current or previous periods. Additions to provisions primarily include provisions for retirement benefit costs (when not already included in employee salary costs), litigation, major repairs and deferred costs, statutory leave, redundancy or pre-redundancy payments, early retirement, future under-activity and relocation, provided that they relate to the company's normal business activities. In fact, these provisions represent losses for the company and should be deducted from its EBITDA.
Since it is unaffected by non-cash charges – i.e. depreciation, amortisation, impairment charges and provisions, which may leave analysts rather blindsided – trends in the EBITDA/sales ratio, known as the EBITDA margin, form a central part of a financial analysis. All the points we have dealt with so far in this section should enable a financial analyst to explain why a group's EBITDA margin expanded or contracted by x points between one period and the next. The EBITDA margin change can be attributable to an overrun on production costs, to personnel cost, to the price effect on sales or to a combination of all these factors.
Our experience tells us that competitive pressures are making it increasingly hard for companies to keep their EBITDA margin moving in the right direction!
The following table shows trends in the EBITDA margins posted by various sectors in Europe over the 2000–2022 period (2021 and 2022 are Exane BNP Paribas estimates).
| Sector | 2005 | 2010 | 2015 | 2016 | 2017 | 2018 | 2019 | 2020 | 2021e | 2022e |
|---|---|---|---|---|---|---|---|---|---|---|
| Aerospace & Defence | 7% | 5% | 7% | 8% | 7% | 9% | 8% | 4% | 7% | 9% |
| Automotive | 5% | 7% | 7% | 7% | 7% | 7% | 7% | 4% | 7% | 8% |
| Beverages | 19% | 23% | 24% | 24% | 25% | 25% | 24% | 22% | 23% | 23% |
| Building Materials | 12% | 9% | 10% | 11% | 11% | 11% | 11% | 11% | 12% | 13% |
| Business Services | 7% | 7% | 8% | 8% | 8% | 8% | 8% | 7% | 8% | 9% |
| Capital Goods | 5% | 10% | 10% | 10% | 10% | 10% | 10% | 9% | 10% | 12% |
| Chemicals | 12% | 13% | 13% | 14% | 14% | 14% | 13% | 13% | 14% | 15% |
| Consumer Goods | 10% | 11% | 11% | 11% | 11% | 11% | 11% | 10% | 11% | 11% |
| Food & HPC | 13% | 15% | 16% | 16% | 17% | 17% | 17% | 17% | 17% | 17% |
| Food Retail | 4% | 5% | 3% | 3% | 3% | 3% | 3% | 3% | 3% | 4% |
| General Retail | 12% | 12% | 9% | 9% | 8% | 8% | 8% | 5% | 8% | 9% |
| IT Hardware | 13% | 11% | 12% | 8% | 11% | 10% | 12% | 15% | 14% | 17% |
| IT Services | 6% | 9% | 9% | 11% | 12% | 12% | 13% | 11% | 14% | 16% |
| Leisure & Hotels | 7% | 6% | 8% | 8% | 8% | 7% | 7% | -2% | 2% | 6% |
| Luxury Goods | 14% | 19% | 18% | 18% | 19% | 21% | 21% | 16% | 21% | 22% |
| Media | 16% | 18% | 18% | 16% | 16% | 16% | 15% | 14% | 15% | 16% |
| Medtech & Services | 7% | 14% | 15% | 16% | 16% | 16% | 16% | 14% | 16% | 16% |
| Mining | 28% | 19% | 6% | 11% | 13% | 13% | 12% | 18% | 20% | 17% |
| Oil & Gas | 14% | 10% | 3% | 3% | 7% | 9% | 8% | 5% | 7% | 10% |
| Paper & Packaging | 14% | 7% | 8% | 10% | 11% | 13% | 12% | 11% | 12% | 13% |
| Software | 28% | 31% | 28% | 28% | 25% | 27% | 25% | 25% | 22% | 23% |
| Steel | 9% | 4% | 3% | 5% | 6% | 6% | 2% | -3% | 5% | 6% |
| Telecom Operators | 19% | 17% | 13% | 13% | 14% | 13% | 13% | 13% | 14% | 15% |
| Transport & Infrastructure | 7% | 8% | 8% | 9% | 9% | 8% | 8% | 0% | 6% | 9% |
| Utilities | 15% | 13% | 9% | 10% | 9% | 10% | 11% | 10% | 11% | 11% |
Source: Exane BNP Paribas
It clearly shows, among other things, the tiny but stable EBITDA margin of food retailers and the very high EBITDA margin for the telecom operators, which need heavy investment, thus requiring high margins in order to get sufficient returns.
8/ OPERATING PROFIT OR EBIT
Now we come to the operating profit (EBIT), an indicator whose stock is still at the top. Analysts usually refer to the operating profit/sales ratio as the operating margin, trends in which must also be explained.
Operating profit is EBITDA minus non-cash operating costs. It may thus be calculated as follows:
Impairment losses on fixed assets relate to operating assets (brands, purchased goodwill, etc.) and are normally included with depreciation and amortisation by accountants. We beg to differ, as impairment losses are normally non-recurring items and as such should be excluded by the analyst from the operating profit and relegated to the bottom of the income statement. If the impairment of fixed assets were recurrent, one would legitimately have to question the relevance of the valuation of such assets.
As we saw in Chapter 3, the by-function format directly reaches operating profit without passing through EBITDA:
The emphasis placed by analysts on operating performance has led many companies to attempt to boost their operating profit artificially by excluding charges that should logically be included. These charges are usually to be found on the separate “Other income and costs” line, below operating profit, and are, of course, normally negative. For instance, we have seen operating foreign exchange losses, recurring provisions environmental liabilities and anticipated losses on contracts excluded from operating profit. In other cases, capital gains on asset disposals have been included in recurring EBIT.
Other companies publish an operating profit figure and a separate EBIT figure, presented as being more significant than operating profit. Naturally, it is always higher, too.
The following table shows trends in the operating margin posted by various sectors over the 2000–2022 period.
The reader may notice, for example, how cyclical the mining sector is in stark contrast to the food sector.
| Sector | 2005 | 2010 | 2015 | 2016 | 2017 | 2018 | 2019 | 2020 | 2021e | 2022e |
|---|---|---|---|---|---|---|---|---|---|---|
| Aerospace & Defence | 10% | 8% | 10% | 11% | 10% | 12% | 12% | 9% | 11% | 13% |
| Automotive | 10% | 10% | 11% | 11% | 11% | 11% | 11% | 9% | 12% | 13% |
| Beverages | 25% | 29% | 30% | 29% | 31% | 31% | 31% | 30% | 30% | 30% |
| Building Materials | 16% | 14% | 14% | 15% | 15% | 15% | 16% | 16% | 17% | 18% |
| Business Services | 9% | 10% | 11% | 11% | 11% | 11% | 12% | 11% | 12% | 13% |
| Capital Goods | 8% | 13% | 12% | 12% | 12% | 12% | 13% | 12% | 14% | 15% |
| Chemicals | 17% | 18% | 18% | 19% | 20% | 19% | 19% | 21% | 20% | 21% |
| Consumer Goods | 14% | 14% | 14% | 14% | 15% | 14% | 14% | 14% | 15% | 15% |
| Food & HPC | 16% | 18% | 19% | 19% | 20% | 21% | 21% | 21% | 21% | 21% |
| Food Retail | 6% | 7% | 5% | 5% | 5% | 6% | 7% | 7% | 7% | 7% |
| General Retail | 15% | 16% | 12% | 12% | 11% | 11% | 13% | 12% | 14% | 15% |
| IT Hardware | 18% | 13% | 15% | 11% | 14% | 13% | 17% | 20% | 19% | 22% |
| IT Services | 8% | 11% | 12% | 13% | 14% | 15% | 17% | 16% | 18% | 20% |
| Leisure & Hotels | 11% | 9% | 10% | 10% | 10% | 10% | 12% | 7% | 10% | 12% |
| Luxury Goods | 17% | 23% | 23% | 23% | 24% | 25% | 30% | 29% | 32% | 32% |
| Media | 21% | 23% | 22% | 20% | 20% | 20% | 21% | 20% | 21% | 22% |
| Medtech & Services | 12% | 18% | 19% | 19% | 20% | 20% | 22% | 21% | 22% | 23% |
| Mining | 35% | 23% | 14% | 19% | 19% | 19% | 18% | 26% | 27% | 24% |
| Oil & Gas | 16% | 16% | 14% | 13% | 15% | 15% | 16% | 18% | 17% | 19% |
| Paper & Packaging | 25% | 14% | 13% | 16% | 16% | 19% | 18% | 18% | 19% | 19% |
| Software | 29% | 33% | 31% | 31% | 29% | 31% | 29% | 30% | 26% | 28% |
| Steel | 13% | 9% | 7% | 9% | 10% | 10% | 6% | 2% | 9% | 10% |
| Telecom Operators | 35% | 32% | 28% | 29% | 30% | 30% | 33% | 35% | 35% | 36% |
| Transport & Infrastructure | 12% | 14% | 14% | 14% | 14% | 14% | 16% | 10% | 15% | 17% |
| Utilities | 22% | 20% | 15% | 17% | 16% | 18% | 20% | 19% | 20% | 20% |
Source: Exane BNP Paribas
Section 9.2 HOW OPERATING PROFIT IS ALLOCATED
EBIT is divided up among the company's providers of funds: financial earnings for the lenders, net income for the shareholders and corporation tax for the government, which although it does not provide funds, creates and maintains infrastructure and a favourable environment; without forgetting non-recurrent items.
1/ NET FINANCIAL EXPENSE/INCOME
It may seem strange to talk about net financial income for an industrial or service company whose activities are not primarily geared towards generating financial income. Since finance is merely supposed to be a form of financing a company's operating assets, financial items should normally show a negative balance, and this is generally the case. That said, some companies, particularly large groups generating substantial negative working capital (like big retailers, for instance), have financial aspirations and generate net financial income, to which their financial income makes a significant contribution.
Net financial expense thus equals financial expense minus financial income. Where financial income is greater than financial expense, we naturally refer to it as net financial income.
Financial income includes:
- income from securities and from loans recorded as long-term investments (fixed assets). This covers all income received from investments other than participating interests, i.e. dividends and interest on loans;
- other interests and related income, i.e. income from commercial (rare!) and other loans, income from marketable securities, other financial income;
- write-backs of certain provisions and charges transferred, i.e. write-backs of provisions, of impairment losses on financial items and, lastly, write-backs of financial charges transferred;
- foreign exchange gains on debt;
- changes in unrealised capital gains for marketable securities.
Financial expense includes:
- interest and related charges;
- foreign exchange losses on debt;
- net expense on the disposal of marketable securities, i.e. capital losses on the disposal of marketable securities;
- amortisation of bond redemption premiums;
- additions to provisions for financial liabilities and charges and impairment losses on investments.
Net financial expense is not directly related to the operating cycle, but instead reflects the size of the company's debt burden and the level of interest rates. There is no volume or price effect to be seen at this level. Chapter 12, which is devoted to the issue of how companies are financed, covers the analysis of net financial expense in much greater detail.
Profit before tax is the difference between operating profit and financial expense net of financial income.
2/ NON-RECURRING ITEMS
Depending on accounting principles, firms are allowed to include more or fewer items in the exceptional/extraordinary items line. Under IFRS rules, extraordinary and exceptional items are included in operating profit without identifying them as such. Nevertheless, the real need for such a distinction has led a large number of companies reporting in IFRS to present a “recurring operating profit” (or similar term) before the operating profit line.
Non-recurring items should be defined on a case-by-case basis by the analyst.
Without any doubt, extraordinary items and results from discontinued operations are non-recurrent items.
Exceptional items are much trickier to analyse. In large groups, closure of plants, provisions for restructuring, etc. tend to happen more or less every year in different divisions or countries and should consequently be treated as recurring items. In some sectors, exceptional items are an intrinsic part of the business. A car rental company renews its fleet of cars every nine months and regularly registers capital gains. Exceptional items should then be analysed as recurrent items and as such be included in the operating profit. For smaller companies, exceptional items tend to be one-off items and as such should be seen as non-recurrent items.
It makes no sense to assess the current level of non-recurring items from the perspective of the company's profitability or to predict their future trends. Analysts should limit themselves to understanding their origin and why, for example, the company needed to write down the goodwill.
3/ INCOME TAX
The corporate income tax line can be difficult to analyse owing to the effects of deferred taxation, the impact of foreign subsidiaries and tax-loss carryforwards. Analysts usually calculate the group's effective tax rate (i.e. corporate income tax divided by profit before tax), which they monitor over time to assess how well the company has managed its tax affairs. A weak tax rate must be explained. It may be due to the use of tax losses carried forward (due to past difficulties) that will be depleted one day or another. It may also be explained by aggressive tax optimisation schemes which are not risk-free, especially when countries are running high levels of debts and/or deficits and society no longer accepts such behaviour.
In the notes to the accounts, there is a useful table that explains the reconciliation between the theoretical tax rate on companies and the tax rate effectively paid by the company or the group (it is called “tax proof”).
4/ GOODWILL IMPAIRMENT, INCOME FROM ASSOCIATES, MINORITY INTERESTS
Regarding goodwill impairment, the main questions should be: Where does this goodwill come from and why was it depreciated?
Depending on its size, the share of net profits (losses) of associates3 deserves special attention. Where these profits or losses account for a significant part of net income, either they should be separated out into operating, financial and non-recurring items to provide greater insight into the contribution made by the equity-accounted associates, or a separate financial analysis should be carried out of the relevant associate. As a last-resort solution they could be added to EBIT.
Minority interests4 are always an interesting subject and beg the following questions: Where do they come from? Which subsidiaries do they relate to? Do the minority investors finance losses or do they grab a large share of the profits? An analysis of minority interests often proves to be a useful way of working out which subsidiary(ies) generate(s) the group's profits.
Section 9.3 STANDARD INCOME STATEMENTS (INDIVIDUAL AND CONSOLIDATED ACCOUNTS)
The following tables show two model income statements. The first has been adapted to the needs of non-consolidated (individual) company accounts and is based on the by-nature format. The second is based on the by-function format as it is used in the ArcelorMittal group's consolidated accounts.
BY-NATURE INCOME STATEMENT – INDIVIDUAL COMPANY ACCOUNTS
| Periods | 2018 | 2019 | 2020 |
|---|---|---|---|
| NET SALES | |||
| + Changes in inventories of finished goods and work in progress + Production for own use | |||
| = PRODUCTION | |||
| − Raw materials used − Cost of goods for resale sold = GROSS MARGIN or GROSS TRADING PROFIT − Other purchases and external charges | |||
| = VALUE ADDED | |||
| − Personnel cost (incl. employee profit-sharing and incentives) − Taxes other than on net income + Operating subsidies − Change in operating provisions5 + Other operating income and cost | |||
| = EBITDA | |||
| − Depreciation and amortisation | |||
| = EBIT (OPERATING PROFIT) (A) | |||
| Financial expense − Financial income − Net capital gains/(losses) on the disposal of marketable securities + Change in financial provisions | |||
| = NET FINANCIAL EXPENSE (B) (A) − (B) = PROFIT BEFORE TAX AND NON-RECURRING ITEMS | |||
| +/− Non-recurring items including impairment losses on fixed assets − Corporate income tax = NET INCOME (net profit) |
BY-FUNCTION INCOME STATEMENT – CONSOLIDATED ACCOUNTS
| 2016 | 2017 | 2018 | 2019 | 2020 | |||||||
|---|---|---|---|---|---|---|---|---|---|---|---|
| M$ | % | M$ | % | M$ | % | M$ | % | M$ | % | ||
| NET SALES | 56,791 | 100.0% | 68,679 | 100.0% | 76,033 | 100.0% | 70,615 | 100.0% | 53,270 | 100.0% | |
| − Cost of sales | 50,223 | 88.4% | 60,876 | 88.6% | 67,025 | 88.2% | 67,058 | 95.0% | 50,797 | 95.4% | |
| = GROSS MARGIN | 6,568 | 11.6% | 7,803 | 11.4% | 9,008 | 11.8% | 3,557 | 5.0% | 2,473 | 4.6% | |
| − Selling and marketing costs6 |  | 2,202 | 3.9% | 2,369 | 3.4% | 2,469 | 3.2% | 2,355 | 3.3% | 2,022 | 3.8% |
| − General and administrative costs6 | |||||||||||
| ± Other operating income and expense6 | |||||||||||
| = RECURRING OPERATING PROFIT | 4,366 | 7.7% | 5,434 | 7.9% | 6,539 | 8.6% | 1,202 | 1.7% | 451 | 0.8% | |
| − Net financial expenses | 2,056 | 3.6% | 875 | 1.3% | 2,210 | 2.9% | 1,554 | 2.2% | 1,190 | 2.2% | |
| = CURRENT PROFIT BEFORE TAX | 2,310 | 4.1% | 4,559 | 6.6% | 4,329 | 5.7% | (352) | −0.5% | (739) | −1.4% | |
| ± Income from associates | 615 | 1.1% | 448 | 0.7% | 652 | 0.9% | 347 | 0.5% | 234 | 0.4% | |
| ± Non-recurring items | (205) | −0.4% | − | 0.0% | 0.0% | (1,927) | −2.7% | 1,593 | 3.0% | ||
| − Goodwill depreciation | − | 0.0% | − | 0.0% | 0.0% | 0.0% | 0.0% | ||||
| − Income Tax | 986 | 1.7% | 432 | 0.6% | (349) | −0.5% | 459 | 0.7% | 1,666 | 3.1% | |
| = Net PROFIT | 1,734 | 3.1% | 4,575 | 6.7% | 5,330 | 7.0% | (2,391) | −3.4% | (578) | −1.1% | |
| − Minority interests | (45) | −0.1% | 7 | 0.0% | 181 | 0.2% | 63 | 0.1% | 155 | 0.3% | |
| = NET PROFIT ATTRIBUTABLE TO SHAREHOLDERS | 1,779 | 3.1% | 4,568 | 6.7% | 5,149 | 6.8% | (2,454) | −3.5% | (733) | −1.4% | |
| Employees | 199,000 | 197,000 | 209,000 | 191,000 | 168,000 | ||||||
Lines in blue are found only in consolidated accounts.
Section 9.4 FINANCIAL ASSESSMENT
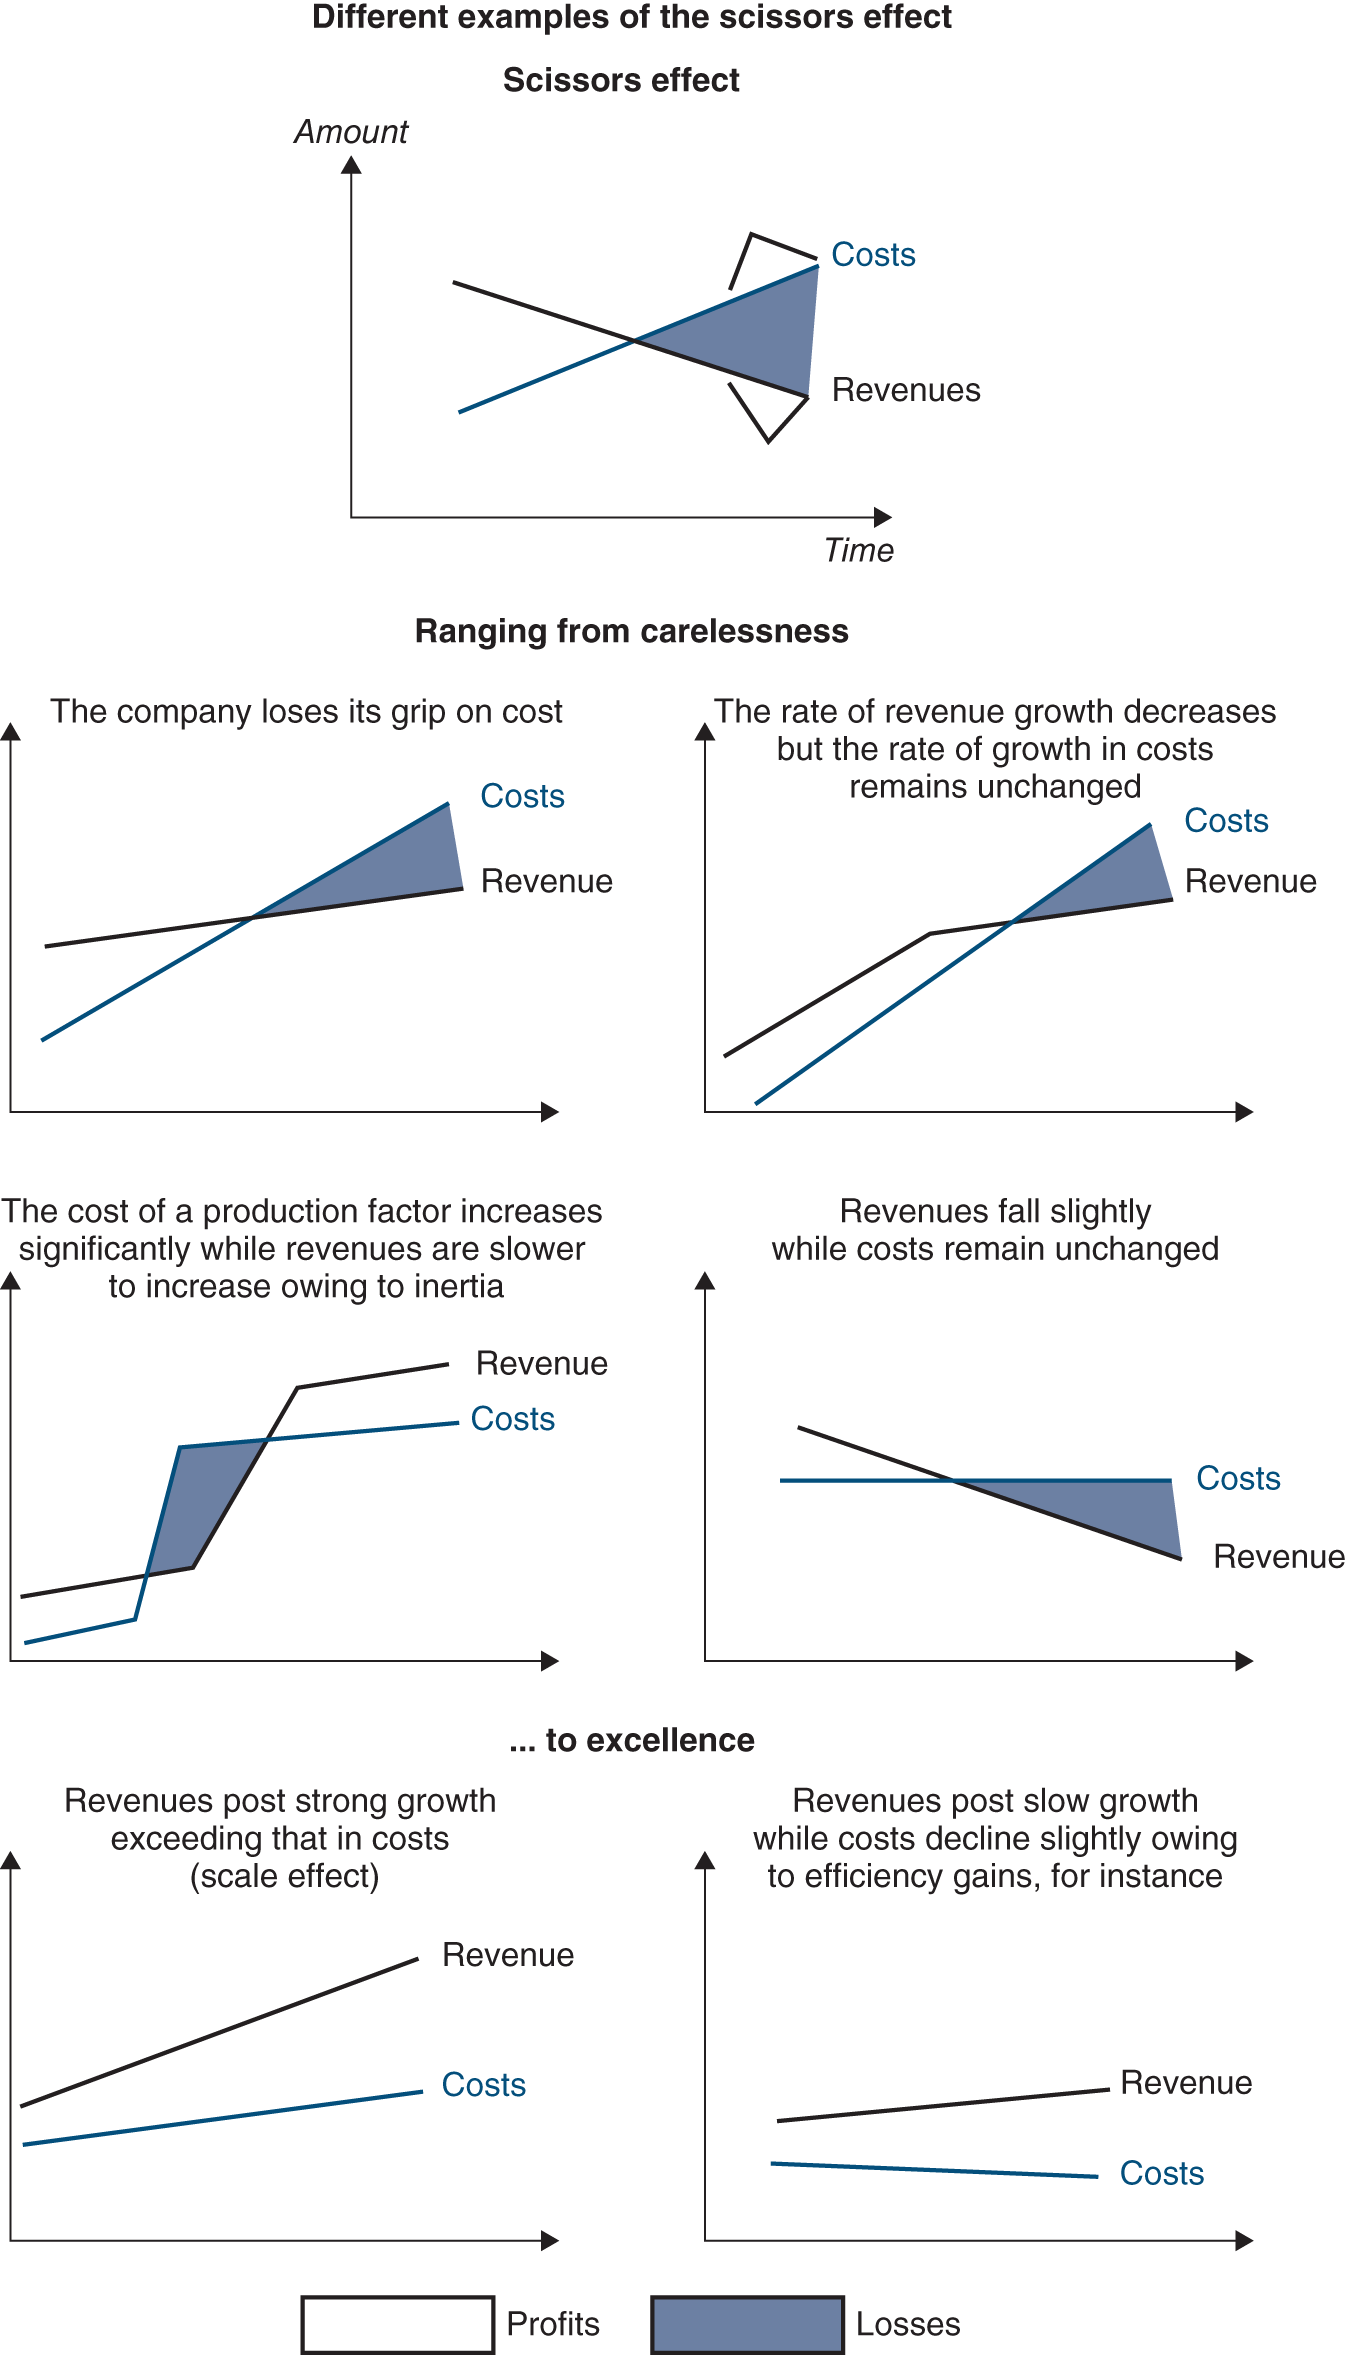
1/ THE SCISSORS EFFECT
The scissors effect is, first and foremost, the product of a simple phenomenon.
If revenues are growing by 5% p.a. and certain costs are growing at a faster rate, then earnings naturally decrease. If this trend continues, then earnings will decline further each year and ultimately the company will sink into the red. This is what is known as the scissors effect.
Whether or not a scissors effect is identified matters little. What really counts is establishing the causes of the phenomenon. A scissors effect may occur for all kinds of reasons (regulatory developments, intense competition, mismanagement in a sector, etc.) that reflect the higher or lower quality of the company's strategic position in its market. If it has a strong position, it will be able to pass on any increase in its costs to its customers by raising its selling prices and thus gradually widening its margins.
Where it reduces profits, the scissors effect may be attributable to:
- a degree of increased competition that may prevent a company from passing on sharp increases in its raw materials costs to its customers via its selling prices. For example, a synthetic textile company would find it difficult to incorporate oil price hikes in its selling prices if at the same time the cost of wool or cotton is falling;
- a statutory freeze on selling prices, making it impossible to pass on the rising cost of production factors (e.g. energy prices in some countries, where governments decide on such freezes);
- psychological reluctance to put up prices. For example, when you sell your product at £19.99, you may find it difficult to exceed the £20.00 threshold;
- poor cost control, e.g. where a company does not have a tight grip on its cost base and may not be able to pass rising costs on in full to its selling prices. As a result, the company no longer grows, but its cost base continues to expand.
The impact of trends in the cost of production factors is especially important because these factors represent a key component of the cost price of products. In such cases, analysts have to try to estimate the likely impact of a delayed adjustment in prices. This depends primarily on how the company and its rivals behave and on their relative strength within the marketplace.
But the scissors effect may also work to the company's benefit, as shown by the last two charts in the following figure.
2/ PITFALLS
A company's accounts are littered with potential pitfalls, which must be sidestepped to avoid errors of interpretation during an analysis. The main types of potential traps are as follows.
(a) The stability principle (which prevents any simplistic reasoning)
This principle holds that a company's earnings are much more stable than we would expect. Net income is frequently a modest amount that remains when charges are offset against revenues. Net income represents an equilibrium that is not necessarily upset by external factors. Let's consider, for instance, a supermarket chain where the net income is roughly equal to the net financial income. It would be a mistake to say that if interest rates decline, then the company's earnings will be wiped out. The key issue here is whether the company will be able to slightly raise its prices to offset the impact of lower interest rates, without eroding its competitiveness. It will probably be able to do so if all its rivals are in the same boat. But the company may be doomed to fail if more efficient distribution channels exist.
The situation is very similar for champagne houses. A poor harvest drives up the cost of grapes and pushes up the selling price of champagne. Here the key issues are when prices should be increased in view of the competition from sparkling wines, the likely emergence of an alternative product at some point in the future and consumers' ability to make do without champagne if it is too expensive.
It is important not to repeat the common mistake of establishing a direct link between two parameters and explaining one by trends in the other.
That said, there are limits to the stability principle.
(b) Regulatory changes
These are controls imposed on a company by an authority (usually the government) that generally restricts the “natural” direction in which the company is moving. Examples include an aggressive devaluation, the introduction of a shorter working week or measures to reduce the opening hours of shops.
(c) External factors
Like regulatory changes, these are imposed on the company. That said, they are more common and are specific to the company's sector of activity, e.g. pressures in a market, arrival (or sudden reawakening) of a very powerful competitor or changes to a collective bargaining agreement.
(d) Pre-emptive action
Pre-emptive action is where a company immediately reflects expectations of an increase in the cost of a production factor by charging higher selling prices. This occurs in the champagne sector where the build-up of pressure in the raw materials market following a poor grape harvest very soon leads to an increase in prices per bottle. Such action is taken even though it will be another two or three years before the champagne comes onto the marketplace.
(e) Inertia effects
Inertia effects are much more common than those we have just described, and they work in the opposite direction. Owing to inertia, a company may struggle to pass on fluctuations in the cost of its production factors by upping its selling prices. For instance, in a sector that is as competitive and has such low barriers to entry as the road haulage business, there is usually a delay before an increase in diesel fuel prices is passed on to customers in the form of higher shipping charges.
(f) Inflation effects
Inflation distorts company earnings because it acts as an incentive for overinvestment and overproduction, particularly when it is high (e.g. during the 1970s and the early 1980s). A company that plans to expand the capacity of a plant four years in the future should decide to build it immediately; it will then save 30–40% of its cost in nominal terms, giving it a competitive advantage in terms of accounting costs. Building up excess inventories is another temptation in high-inflation environments because time increases the value of inventories, thereby offsetting the financial expense involved in carrying them and giving rise to inflation gains in the accounts.
Inflation gives rise to a whole series of similar temptations for artificial gains, and any players opting for a more cautious approach during such periods of madness may find themselves steamrollered out of existence. By refusing to build up their inventories to an excessively high level and missing out on inflation gains, they are unable to pass on a portion of them to consumers, as their competitors do. Consequently, during periods of inflation:
- depreciation and amortisation are in most cases insufficient to cover the replacement cost of an investment, the price of which has risen;
- inventories yield especially large nominal inflation gains where they are slow moving.
Deflation leads to the opposite results.
(g) Capital expenditure and restructuring
It is fairly common for major investments (e.g. the construction of a new plant) to depress operating performance and even lead to operating losses during the first few years after they enter service.
For instance, the construction of a new plant generally leads to:
- additional general and administrative costs such as R&D and launch costs, professional fees, etc.;
- financial costs that are not matched by any corresponding operating revenue until the investment comes on stream (this is a common phenomenon in the hotel sector given the length of the payback periods on investments). In certain cases, they may be capitalised and added to the cost of fixed assets but this is even more dangerous;
- additional personnel cost deriving from the early recruitment of line staff and managers, who have to be in place by the time the new plant enters service;
- lower productivity owing both to the time it takes to get the new plant and equipment running and the inexperience of staff at the new production facilities.
As a result of these factors, some of the investment spending finds its way onto the income statement, which is thus weighed down considerably by the implications of the investment programme.
Conversely, a company may deliberately decide to pursue a policy of underinvestment to enhance its bottom line (so they can be sold at an inflated price) and to maximise the profitability of investments it carried out some time ago. But this type of strategy of maximising margins jeopardises its scope for value creation in the future (it will not create any new product, it will not train sufficient staff to prepare for changes in its business, etc.).
Section 9.5 CASE STUDY: ARCELORMITTAL
Volumes sold by ArcelorMittal were stable from 2016 to 2019 (at 84.6 Mt) but sales varied much more due to variations in the price of steel, and to a lesser extent to the change in scope. This is typical of an industry with high fixed costs in which the slightest imbalance between demand and supply generates major price variations: –10% in 2016, +19% and +13% in 2017 and 2018, –8% in 2019. In 2020 the volumes are down by 18% to 69.1 Mt. This decrease is explained for the most part by the Covid-19 crisis in the first half of 2020, but also for 2.4% by the disposals made by the group. Sales fell by 25%, with prices continuing to fall by 8% in a context of overproduction compared to demand.
The year 2016 marked a turning point compared to the early 2000s with a drop in Chinese steel exports, which was sharply accentuated in 2017, 2018 and then 2019 (62 Mt), under the effect of major capacity reductions, a revival of Chinese domestic demand and the implementation of anti-dumping customs taxes in Europe and the United States. In 2020, the market was totally destabilized by the Covid-19 crisis and the fall in demand.
From 2016 to 2018, ArcelorMittal benefited from a positive scissor effect, the result of the major restructuring undertaken in that year (17% reduction in personnel costs), the evolution of steel sales prices, and its partial integration upstream, which partly protected it from increases in the price of iron ore and coking coal. The operating margin, which was zero in 2015, therefore recovered to 8.6% in 2018.
However, it falls back to 1.7% in 2019 due to a once again negative scissor effect with a stable cost of sales and a 7% decline in sales. The 2019 operating margin is double that of 2015 for identical sales volumes, which shows the productivity gains made. In 2020, ArcelorMittal will save the day by maintaining a marginally positive operating result thanks to drastic cost-cutting measures.
SUMMARY
QUESTIONS
EXERCISES
ANSWERS
NOTES
- 1 Earnings before interest, taxes, depreciation and amortisation.
- 2 In IFRS accounts, rents are broken down into financial costs and depreciation. See Section 7.12.
- 3 For more on associates, see Section 6.1, 1/.
- 4 For more on minority interest, see Section 6.1, 2/.
- 5 Impairment losses on current assets operating and provisions.
- 6 ArcelorMittal does not distinguish between these items in its accounts.