
CHAPTER 10
Consumer Discretionary
________________
The global consumer discretionary sector is comprised of businesses that provide goods and services to consumers that are “discretionary” in nature, meaning that the purchases of these goods and services are nonessential and may be delayed by consumers. As a result, the consumer discretionary sector consists of businesses that are more affected by the economic cycle. When economic times are good, consumer discretionary businesses will earn significantly greater profits, but when economic conditions weaken, this effect works against them, and they will generate below-average profits. The importance of scale and brand power vary by industry within the consumer discretionary sector, depending on a number of factors, including the capital intensity of the business and the importance and perception of product quality and exclusivity.

Data source: Bloomberg, as of March 18, 2022.
When compared to the market, the companies mentioned in this chapter have traded at above-average valuations over the past few years despite delivering below-average profitability and lower growth in sales, profits, and dividends. Below-average profitability and lower sales and profit growth are partially a result of the substantial effect the 2020 global pandemic had on the travel-related industries within the consumer discretionary sector.
Higher sensitivity to the economic cycle causes investors to invest more heavily in consumer discretionary companies when economic conditions are expected to improve. Conversely, when the economy weakens, earnings for discretionary stocks fall more than the average company and so investors often sell them in favor of businesses whose earnings are more stable. For these reasons, consumer discretionary companies tend to exhibit improving relative share price performance as the bull market evolves, up until the late cycle when inflation begins to pick up and the central bank starts to raise interest rates. Especially in cases where consumer debt levels are high, rising interest rates force consumers to shift money away from spending on things that are “nice to have” to those that are necessities, such as buying food, paying utility bills, and making mortgage and loan payments. The opposite happens near the end of recessions as central banks lower interest rates to help spur economic growth, enabling consumers to spend more on discretionary goods and services.
In this chapter we take a closer look at the 14 main industry groups within the consumer discretionary sector: (1) auto manufacturing, (2) auto components, (3) auto parts and service, (4) auto retail, (5) casinos and gaming, (6) general merchandise stores, (7) homebuilding, (8) hotels, resorts, and cruise lines, (9) household durables, (10) internet retail, (11) leisure products, (12) luxury goods, (13) restaurants, and (14) textiles and apparel retail.
Auto Manufacturing

Data source: Bloomberg, as of March 18, 2022.
Auto manufacturing, also referred to as original equipment manufacturing (OEM), is a capital-intensive business. Input costs are a relatively high portion of the company's total costs, and purchasing a car is a large financial decision for most consumers. While most OEMs rely on high sales volumes of relatively lower-cost, lower-margin models, some OEMs like Ferrari produce fewer higher-cost, higher-margin automobiles. In both cases production efficiency and scale are critical. Action on climate change is causing many auto OEMs to develop new electric vehicle or hybrid models, or in some cases switch all of their automobile production to electric vehicles (EVs). In addition to electrification, another emerging trend in the auto OEM industry has been the shift toward autonomous (self-driving) vehicles, which has been enabled by new hardware and software technologies. It is worth noting that consumer preferences vary by region. For example, US consumers prefer larger trucks and SUVs while European consumers prefer smaller cars. As a result of shorter driving distances, battery sizes in electric vehicles tend to be smaller in Europe than in North America. Interest rate changes can influence auto sales because most new car purchases are financed based on prevailing interest rates and dealer incentives. Since cars have a limited useful life, investors should track the average age of cars on the road whenever possible (IHS Markit tracks this data in some markets). As the average age of cars on the road rises, the need for consumers to buy new replacement vehicles increases. Other economic factors that influence firm profitability include commodity costs (such as steel, rubber, and aluminum) and labor costs. Lower profitability has caused the shares of auto manufacturers to trade at valuations below the market over the past few years. Auto manufacturers that have been around for a long time may also have inflated costs related to funding pension liabilities, which should be considered when making an investment. Important metrics to monitor for auto OEMs include gross margin, operating margin, free cash flow, and car sale reservations (especially for newer companies in the EV marketplace). Despite remaining a relatively small part of the cost of building a new car, semiconductors are now critical components of cars, and their availability is therefore essential to an OEM's operations. Commonly used valuation measures for auto manufacturers include P/E and EV/EBITDA.
Auto Components
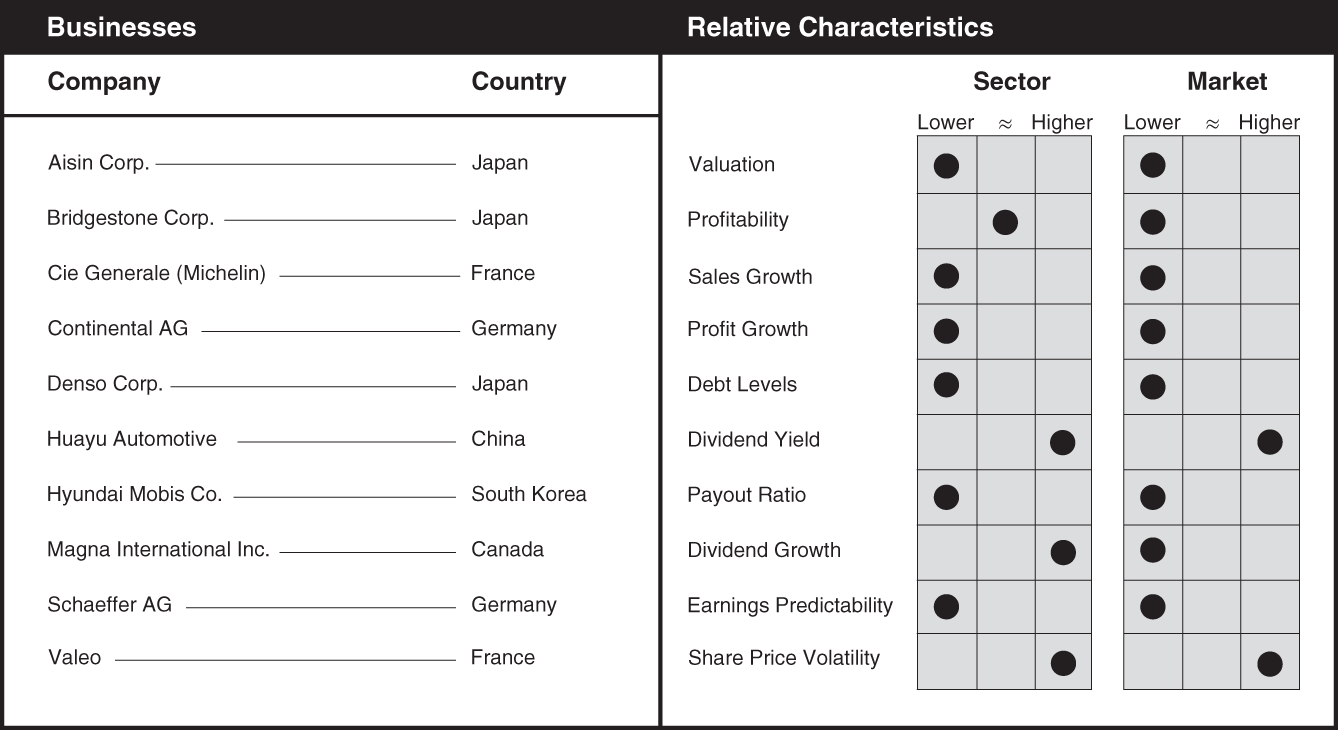
Data source: Bloomberg, as of March 18, 2022.
Auto component companies sell directly to OEMs and are also capital-intensive businesses. Input costs are relatively high as a portion of the company's total costs, and since component manufacturers sell directly to OEMs, they are impacted by many of the same economic factors, including interest rates. Like OEMs, commodities such as steel, plastic, and rubber can represent a major part of the cost structure for component manufacturers. Some component manufacturers sell into multiple OEMs, which serves to diversify their earnings stream. As well, some component manufacturers, such as tire producers, sell into both the new and used car markets and so a delay in new car purchases may not impact earnings as much as businesses that sell only to OEMs. Aside from tracking average fleet age, investors should also watch for changes in interest rates and dealer incentives. As the average age of cars on the road increases, the need for consumers to buy new replacement vehicles grows. The companies in this industry have been trading at below-average valuations in recent years but have generated attractive dividends and grown their dividends at an above-average rate. Important metrics for component suppliers include EBIT and EBITDA margins, and growth rates compared to the OEM industry are also important to monitor as higher growth rates can signal market share gains and vice versa. Conversely, share gains and losses by each OEM may also provide insights into the component manufacturers that are most closely tied to them as suppliers. Profit and operating margins are also important variables to monitor as changes in market share may be driven by price concessions that would reduce margins. While market share gains are positive, any gains made through cost alone are not usually sustainable and so share gains that coincide with falling margins should be viewed as temporary. For battery manufacturers, output (measured in GWh) and margins are key factors to watch. Commonly used valuation measures for auto manufacturers include P/E and EV/EBITDA.
Auto Parts and Service
Data source: Bloomberg, as of March 18, 2022.
Auto parts and service companies provide after-market goods and services needed to maintain vehicles and extend their useful life. The same factors that can affect the new car market can impact the parts and service industry since a slowdown in the sale of new cars means that consumers must keep their old cars on the road longer, resulting in higher levels of maintenance. As automobiles age, the costs of maintaining them increase until finally they become inoperable or it becomes more cost effective to buy a new, or at least newer, used vehicle. Investors should also track miles driven whenever this information is available because higher amounts of driving also lead to greater need for repairs and maintenance. Gasoline prices can impact this industry as higher gas prices cause consumers to drive less, thereby requiring less maintenance and repairs. Other economic factors that can affect the industry include population and GDP growth, and the unemployment rate. Since new cars do not typically need major repairs or maintenance, higher new car sales could be negative for the after-market industry, at least on a short-term basis. Strong balance sheets and above-average profit and sales growth versus the market have allowed these businesses to pay attractive dividends and grow them at an above-average rate. Important metrics to track include new vehicle sales, same-store sales, gross margin, operating margin, EBIT margin, selling, general, and administrative (SG&A) expense ratios, and market share in both the do-it-yourself (DIY) and do-it-for-me (DIFM) end markets. Valuation comparisons can usually be made using P/E or EV/EBITDA multiples.
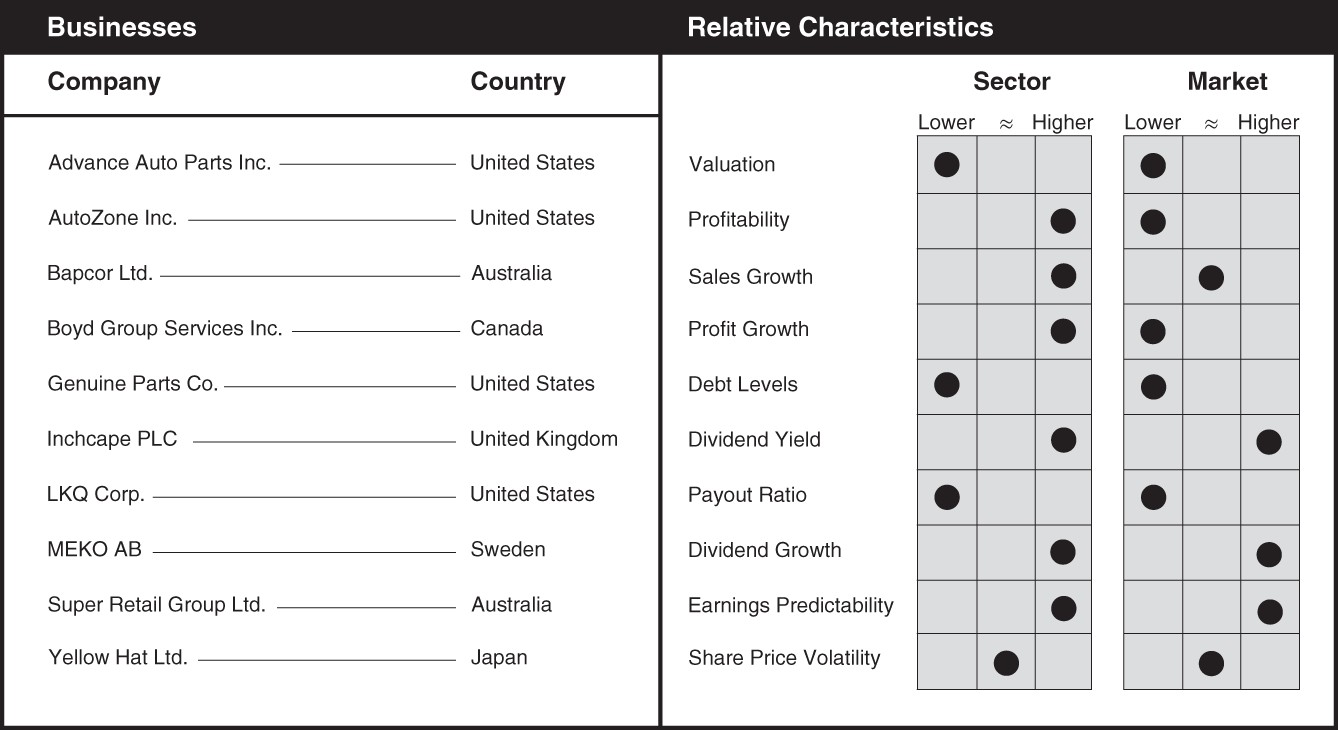
Auto Retail

Data source: Bloomberg, as of March 18, 2022.
In addition to selling new and used cars, many auto retailers also supply finance, insurance, maintenance, and repair services, which serve to further enhance their profitability and diversify their sources of revenue. Auto dealerships pay for their inventory using floor plan financing, which is essentially a revolving credit line secured by the vehicles themselves. The auto retail industry has undergone meaningful change in recent years as vehicle sales have shifted to online marketplaces. Online retailers allow consumers to search for a car, buy it (with financing if necessary), and have it delivered directly to their home without ever setting foot on a dealership floor. In addition, advancements in software helped to transform the auto retail industry by automating much of the car purchase and customer care functions conducted by dealerships. Changes in interest rates and the availability of credit can have a material impact on car sales. Rising costs for cars (either through higher prices or financing rates) can have a negative impact on earnings and profit margins, as can rising levels of unemployment or other factors that cause consumer buying power to weaken. The businesses listed above have paid above-average dividend yields and have been able to grow those dividends at an above-average rate. Despite carrying above-average levels of debt, these businesses have generated above-average profit and sales growth versus the market, allowing them to pay attractive dividends and grow them at an above-average rate. Investors should track new and used car sales data, same-store sales growth for new and used cars, as well as parts and service, gross profit per unit (GPU), and SG&A expense as a percentage of gross revenue. Standard valuation measures such as P/E and EV/EBITDA can usually be used to assess valuations in this industry.
Casinos and Gaming
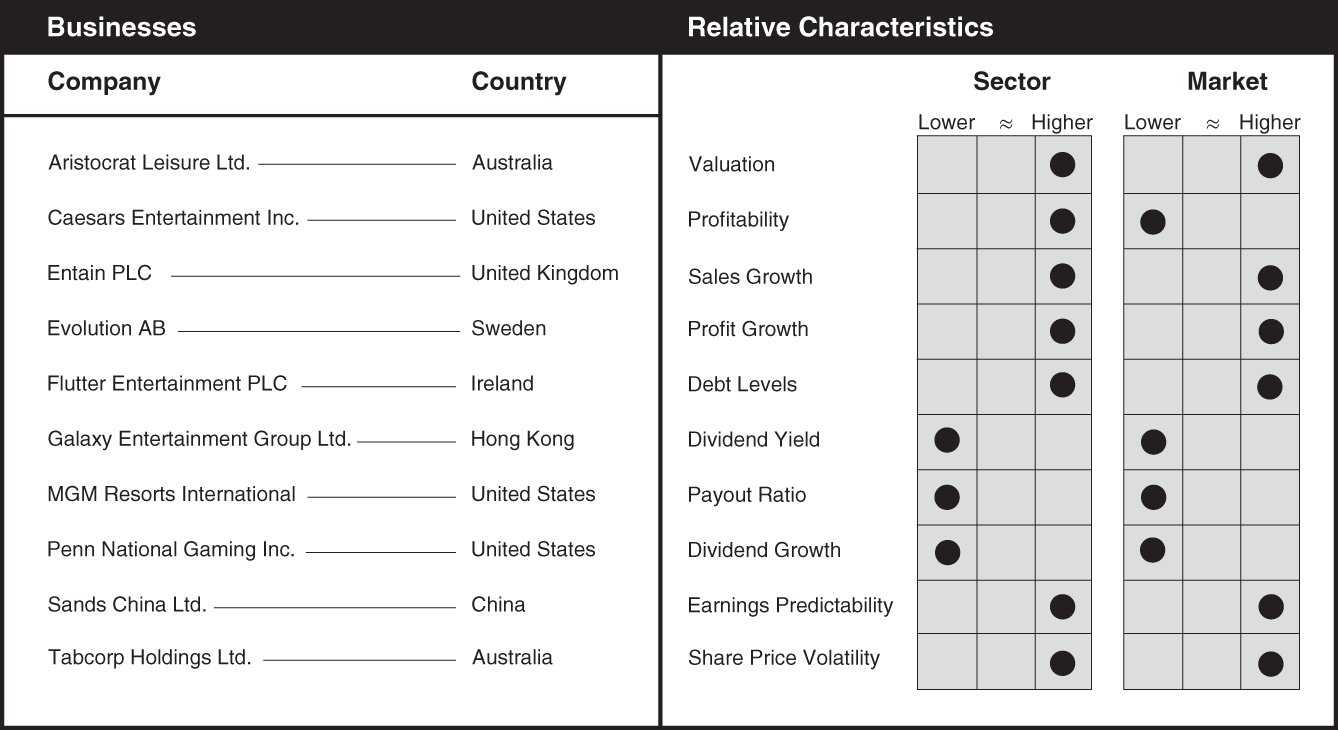
Data source: Bloomberg, as of March 18, 2022.
As with many other industries, the Digital Revolution has had a major impact on the casino and gaming industry. The industry has emerged from a period of stagnation and is now experiencing strong growth, as governments around the world have come to view the industry as a potential new source of tax revenue. This has led governments to increasingly legalize sports betting and internet-based gaming (iGaming). Casinos face regulatory risk, including the potential loss of their gaming licenses in certain jurisdictions. Regulation can therefore have a major impact on the industry, as seen in China's crackdown on junket (VIP) business due to concerns over tax evasion and other criminal activity. While the iGaming market in the United States has experienced lower margins than other areas such as Europe and Australia, these are expected to improve over time as companies reduce advertising and promotion costs related to acquiring new customers. From an economic perspective, growth in GDP and personal consumption expenditures (PCEs) as well as labor costs are important drivers of earnings and revenue growth for the industry. In some geographic areas, weather can also have a significant short-term impact on profitability. Dividend yields, payout ratios, and dividend growth rates were all heavily affected by the 2020 global pandemic, as the precipitous drop in foot traffic caused casino operators to cut their dividends in order to preserve cash. As global leisure travel resumes, casino and gaming companies will likely reinstate their dividends, bringing these metrics back to a more normalized level. Valuations appear elevated due to the large drop in earnings caused by the global pandemic over the past couple of years. Important metrics to track include casino gross gaming revenue (GGR), hotel room revenue, online gaming market share, EBITDA, and EBITDAR (earnings before interest, taxes, depreciation, amortization, and restructuring or rent costs). Since iGaming and sports betting are responsible for the industry's recent growth spurt, it is also important to monitor revenue, EBITDA, and market share trends in those business segments specifically. Commonly used valuation measures for casino and gaming companies include P/E and EV/EBITDAR.
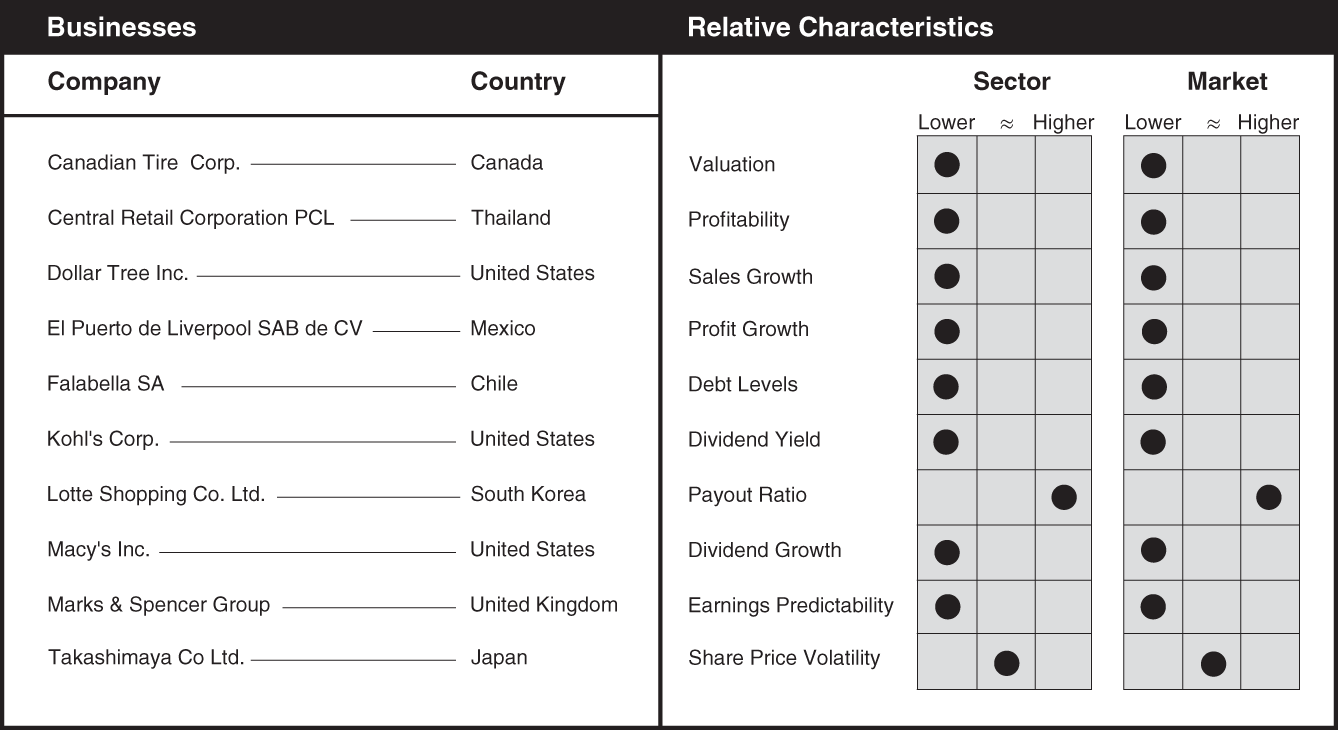
General Merchandise Stores
Businesses in the general merchandise industry sell a variety of goods that are at least somewhat discretionary, such as clothing. As a result, sales for most of these businesses are highly correlated to economic conditions and experience lower sales as economic conditions weaken. The exceptions are discount and dollar stores, which may actually benefit from deteriorating economic conditions, at least on a relative basis. This is the result of consumers shifting down the value chain in order to reduce their spending. This industry continues to be challenged by the shift to online shopping, although some companies have managed to develop successful online platforms. The ability to drive sales by generating traffic in stores and online via product and brand launches, store remodels, and compelling fulfillment options have been important determinants of success in this industry. Inflation can negatively impact these businesses as higher prices for essential goods leaves less money for consumers to spend on discretionary items. Lower relative valuations for the industry over recent years have been driven by below-average profitability, sales, profit, and dividend growth. Investors should monitor same-store sales statistics, including how much growth comes from traffic volumes versus average ticket (purchase) size, new-store openings and closures, new-store productivity including unit/store growth, SG&A per store, and SG&A per square foot. Other key metrics include total revenue, EBIT and EPS growth, gross margin and EBIT margin, leverage (net debt/EBITDA), and lease-adjusted leverage (net debt including operating leases/EBITDAR). Also, analyzing SG&A per store or SG&A per square foot growth can be used to normalize for changes in store count. Standard valuation measures such as P/E and EV/EBITDA can be used to assess valuations in this industry.
Data source: Bloomberg, as of March 18, 2022.
Homebuilding

Data source: Bloomberg, as of March 18, 2022.
Homebuilder earnings are heavily influenced by mortgage rates, which of course are derived from the prevailing interest rates. Changes in interest rates can therefore have a significant impact on home sales. Lumber prices also impact home sales due to the fact that lumber typically represents a relatively large portion of the cost of building a new home. Higher input costs can both reduce profit margins for builders and make homes less affordable for consumers and reduce demand. Important economic factors include mortgage rates, job growth, building costs, labor costs, labor availability, the existing supply of homes, household debt, and income levels (to gauge the ability of consumers to service their debt). In the United States, investors should also track new building permits, housing starts, new and existing home sales, and home prices, since rising home prices suggest more homes need to be built. These metrics may not be available in all countries, but investors should keep track of similar data wherever it is available. For example, investors can track mortgage approvals and the nationwide house price index in the United Kingdom, and they can monitor housing starts in Japan. The global housing market has been strong in recent years due to a limited supply of homes and strong demand, which has been boosted by the low interest rate environment, allowing these businesses to generate above-average profits and profit growth, dividends, and dividend growth. Despite this they have tended to trade at below-average valuations in recent years. Homebuilders have increasingly shifted toward an asset-light land contracting model, where they hold options to build on land rather than hold the land itself. This has served to improve capital efficiency and reduce debt levels. Company-specific metrics that investors should track include absorption rates in each market (how quickly homes are sold), net order growth, and gross margins. Both P/E and EV/EBITDA ratios are commonly used to assess valuations across companies in the homebuilding industry.
Hotels, Resorts, and Cruise Lines

Data source: Bloomberg, as of March 18, 2022.
Hotels and resorts can be split into asset-heavy and asset-light business models. An asset-heavy model is where the company owns properties directly, while an asset-light model is where the company owns the brand and is paid a royalty from the property owner. Economic factors that affect the hotel, resort, and cruise line industry (especially for asset-heavy companies) include personal consumption expenditures (PCE), discretionary spending, GDP growth, fixed business investment, unemployment rates, and labor costs. For cruise line operators, fuel prices, labor costs, and availability of labor are important drivers of revenue growth and profitability. Labor shortages pose a concern for the industry as companies often struggle to attract and retain talent amid tight labor markets. The outbreak of Covid-19 in 2020 revealed how susceptible the industry is to global pandemics. As demand recovered, the need to restaff hotels became more pronounced, particularly for hotel operators who are facing pressures from brands to maintain brand standards and reintroduce services (such as food and beverage and housekeeping). The global pandemic caused a transition to remote work for many businesses across numerous industries. Should this trend continue. the hotel industry could face significant loss of revenue, as corporate customers account for approximately two-thirds of total hotel room demand. The global pandemic also caused the industry to suffer significant losses, depressing longer-term profitability and growth averages compared to the overall market, while adding significantly to the debt levels of most operators. As travel continues to recover, these metrics should improve on an absolute and relative basis. Key metrics to track include corporate travel, total room count, occupancy, average daily room rate (ADR), revenue per available room (RevPAR), bookings, and the number of rooms under development. Capacity additions (in the form of either hotel rooms or new ship builds), whether organic or through acquisition, are a means to grow the businesses and enhance economies of scale. Commonly used valuation measures for hotel and resort companies include P/E and EV/EBITDA.
Household Durables

Data source: Bloomberg, as of March 18, 2022.
Businesses in the household durable industry help make your house a home, providing furniture, home electronics, and appliances, as well as everything you need for your home renovation project. Key trends in the industry include market consolidation, growing small appliance purchases, and online penetration. Another important industry trend has been the move to the Internet of Things (IoT), which serves to increasingly integrate homes with the internet. Appliances and security systems, for example, can now be checked and adjusted from a smartphone. Successful companies stand out through brand management, innovation, product quality and safety, and customer service. A business's ability to pass on higher costs, whether driven by rising product, wage, or transportation costs, are crucial to success in an inflationary environment. Despite generating above-average profit growth, these businesses have been trading at below-average valuations, most likely due to elevated debt levels and below-average sales growth. Economic factors that affect the industry include house prices and inflation. Rising home prices give homeowners access to more equity (which can be used to buy new appliances or for home renovations, for example), while inflation (especially gas and food prices) will serve to reduce consumer spending on durable goods. Logically, factors that influence homebuilders also impact the household durables industry, such as new and existing home sales, average product age (which determines the replacement cycle), mortgage and interest rates, and home improvement spending (professional and do-it-yourself). Input costs, which can include industrial metals, lumber prices, electrical equipment, and transportation costs all influence profit margins and sales growth for the industry. Investors should track same-store sales growth, the source of growth (i.e., traffic vs. ticket), unit-per-store growth, new-store productivity, total revenue growth, changes in margins and SG&A expense ratios, SG&A per store or SG&A per square foot growth (to normalize for changes in store count), growth in EBIT and EPS, leverage (net debt/EBITDA), and lease-adjusted leverage (net debt, including operating leases/EBITDAR). Standard valuation measures such as P/E and EV/EBITDA are commonly used to assess valuations in this industry.
Internet Retail
Internet retailing is the sale of goods and services through the internet, either business-to-business (B2B) or business-to-consumer (B2C). With increasing penetration of mobile devices and internet services, e-commerce has emerged as a major global shopping platform. Active user/buyer growth and consumer spending are important numbers to monitor. Economic factors that affect profitability and sales growth include labor costs, the level of unemployment, and consumer sentiment. Consumer spending is directly tied to wealth creation, and we can expect a continuing shift in spend to e-commerce from “brick and mortar” stores. Consumers’ propensity to spend and e-commerce penetration are also important variables for investors to track. Businesses in the internet retail industry have the potential to grow their earnings by expanding into new end markets, such as groceries and pharmaceuticals, as well as to offer rush and on-demand delivery options. Strong sales and earnings growth in recent years has caused these businesses to trade at above-average valuation multiples. Important metrics to monitor include gross merchandise value (GMV), GMV (or revenue) per user and by region, frequency of purchases by average user, number of users or active buyers, customer retention, total revenue, ad spending, as well as EBIT and EBITDA margins. For companies that sell third-party merchandise on their platforms, take-rate data (the fee companies earn from third-party sellers) should also be monitored. For most businesses in the internet retail industry, P/E or EV/EBITDA ratios are fine for comparing valuation, but for a more diversified company like Amazon, which operates multiple business lines, a sum of the parts valuation analysis is recommended.

Data source: Bloomberg, as of March 18, 2022.
Leisure Products

Data source: Bloomberg, as of March 18, 2022.
Companies in the leisure products industry manufacture a wide range of goods, including bicycles, boats, fishing rods, golf clubs, jet skis, all-terrain vehicles (ATVs), snowmobiles, motorcycles, pool tables, toys, and recreational vehicles (RVs). Brand recognition plays a significant role in this industry. Economic factors that can impact sales and profit growth for leisure product companies include consumer confidence, input (raw material) costs, employment levels, and interest rates (more so for large-ticket items that require purchase financing, such as RVs). These products are discretionary in nature, which means that earnings for these businesses are heavily influenced by economic growth. If the economy is strong, consumers will have a larger amount of discretionary income that they can spend on items they want but do not need. As a rule of thumb, goods that are expensive and unnecessary are more sensitive to economic conditions, which means that sales of leisure products are among the most vulnerable of all consumer goods to periods of economic weakness. Fitness- and sports-related goods, such as bicycles and golf clubs, are currently benefiting from a trend toward healthier lifestyles. Key trends for powersports and RV manufacturers include electrification, expansion into new regions around the world, and internet-connected vehicles (which may provide manufacturers with recurring subscription-based revenue streams as additional services are created). Strong economic growth over the past several years has helped support strong sales and profit growth for the industry and enabled businesses to increase their dividends at an above-average rate. Principal factors to track include dealer inventory levels, capital expenditures, gross margins, and EBIT and EBITDA profit margins. Valuation comparisons can be made using P/E and EV/EBITDA multiples.
Luxury Goods

Data source: Bloomberg, as of March 18, 2022.
The luxury goods industry has been a prime beneficiary of the growth in wealth around the world. Economic growth generates wealth, which is not distributed evenly in a country's population, and so those who are able to accumulate greater amounts of wealth often look to purchase goods that demonstrate their financial success. For this reason, brand recognition is extremely important to luxury goods consumers, while price is often secondary. Companies with global exposure can sell through company-owned stores, sell as wholesalers through other stores, or enter joint ventures with local firms in foreign countries. Some of the world's most famous luxury brands, including Chanel and Gucci, are privately held companies and therefore do not appear on this list, while many other globally recognized brands are owned by the companies shown. Economic factors that have the greatest impact on firm earnings and sales include labor costs, commodity prices, freight costs, supply chain disruption, consumer sentiment, total consumer expenditure, and retail foot traffic. Higher rates of economic growth in developing economies, such as in Asia, are quickly increasing the number of wealthy people globally and have become a major growth driver for the luxury goods industry in recent years. Online sales have been rising as a percentage of total sales (partially due to the global pandemic) and are generally detrimental for profit margins. Whether the online sales trend will persist remains to be seen. Rising input costs and wage inflation also tend to put downward pressure on margins. Investors should monitor sales by product type and by channel (physical stores, online, and wholesale), same-store sales, gross margin, rent costs, SG&A expenses, shipping costs, and store openings and closings, as well as inventory and debt levels. Valuation comparisons can be made using P/E and EV/EBITDA multiples.
Restaurants
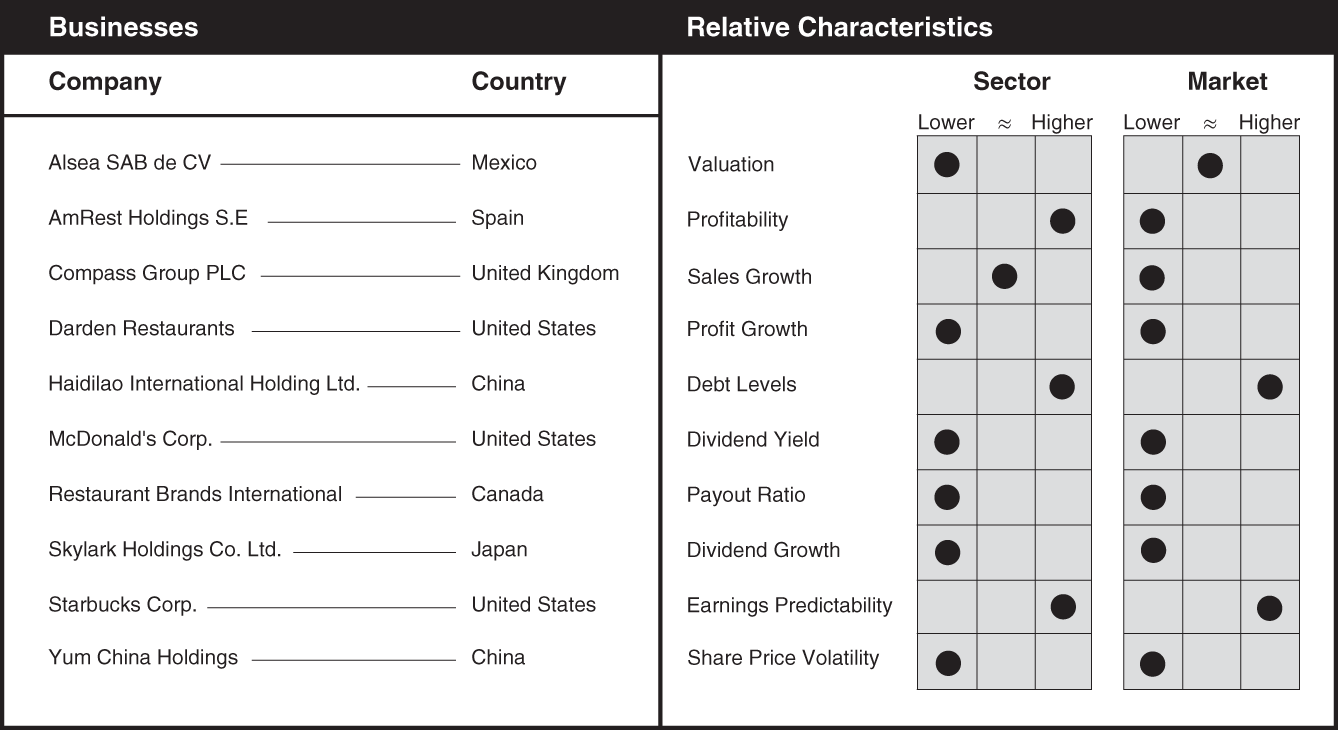
Data source: Bloomberg, as of March 18, 2022.
Restaurant business models have been transformed in recent years through increased digitization and expanded delivery options. International expansion is still a huge driver for the industry with accelerating unit growth and advantages for larger chains in digital, marketing, and store investment. Economic factors that have the biggest influence on firm profit and sales growth include labor costs, commodity costs, freight and fuel costs, the level of unemployment, disposable personal income, and consumer sentiment. There are significant differences between regions in margin structure and labor costs, as well as the acceptance of restaurant chains generally and for specific categories. International markets for fast food tend to be master franchised, whereas the United States and some developed markets are owned by independent franchisees (which provide higher revenue to the parent company). Key industry trends include a shift to digital ordering, delivery and off-premises consumption, digital and automation tools to reduce labor costs, and the need to adapt to new ordering channels, as well as new formats like ghost kitchens (restaurants without dining space). Another challenge the industry faces is the emergence of semi-prepared meal delivery, and grocery delivery offerings. Also, the shift to restaurant meal delivery apps, like UberEats or DoorDash, has added to operating costs and eroded profit margins. Key metrics investors should monitor include same-store sales, success of loyalty programs, menu innovations and digital innovations, and restaurant count and new restaurant growth, as well as the percentage of the business that is franchised versus company-owned and -operated. Same-store sales growth, unit growth, system sales growth, restaurant margins, consolidated operating margins, and labor and food costs as a percentage of sales are also important metrics to track. Commonly used valuation measures for the restaurant industry include P/E and EV/EBITDA.
Textiles and Apparel Retail

Data source: Bloomberg, as of March 18, 2022.
The textile and apparel industry continues to experience a shift to online sales from physical stores, a trend that was accelerated by the 2020 global pandemic. Increasing competition from pure internet-based retailers will likely continue to take market share from brick-and-mortar retailers. Economic factors that have the greatest impact on restaurants include labor costs, commodity prices, freight costs, supply chain disruption, consumer sentiment, total consumer expenditure, and retail foot traffic. Rising input costs and wage inflation would negatively affect margins. The unemployment rate can also have a significant impact on industry profitability and sales growth, as can global consumer trends. Companies with global exposure have different distribution models, including operating their own stores, employing distributors, or engaging in joint ventures with local firms. Low inventory levels and low promotional activity have allowed profit margins to stay elevated versus the sector in recent years but are likely to decline as promotional activity normalizes. As with other industries, rising e-commerce penetration is generally detrimental for retailers’ margins due to additional shipping and return costs. It is important for investors to track sales by channel (stores, e-commerce, and wholesale), region, and product, monitor the success of a company's digital platforms (mobile apps and member engagement), and assess the company's innovation and speed to market (the ability of a company to capitalize on a trend). Investors should also monitor changes in store count, SG&A expense ratios, inventory levels, debt levels, raw material costs, rent costs, transportation costs, and wages. Standard valuation measures such as P/E and EV/EBITDA are often used to assess valuations in this industry.