
CHAPTER 15
Industrials
________________
The global industrials sector includes companies that provide goods and services tied to manufacturing and transportation and is perhaps the most diverse sector of the stock market. These companies produce a wide variety of goods including manufacturing equipment, aircraft, trucks, and building products. Services include building and maintaining roads, bridges, tunnels, and airports. Additionally, they operate shipping businesses that deliver goods to all corners of the globe and provide goods and services to support other businesses.

Data source: Bloomberg, as of March 18, 2022.
Industrial companies listed in this chapter are mature businesses with a marginally lower underlying growth rate compared to the market. However, they have offered competitive dividend yields and above-average dividend growth in recent years.
These companies tend to be capital intensive and are sensitive to the economic cycle and changes in economic growth. That said, companies that produce high-ticket items, such as heavy equipment, factory automation equipment, and machinery, do not usually experience a pickup in customer orders until business confidence improves and the economic cycle is well under way. On the other hand, industries such as commercial services (which includes hiring services) are likely to experience increased demand for their services earlier in an economic recovery.
In this chapter we review the 16 primary industry groups in the industrial sector: (1) aerospace and defense, (2) air freight and courier services, (3) air travel, (4) building products, (5) commercial services, (6) construction and engineering, (7) electrical equipment, (8) environmental and facility services, (9) heavy equipment, (10) industrial conglomerates, (11) industrial machinery, (12) infrastructure management, (13) marine shipping, (14) railroads, (15) trading and distribution, and (16) trucking and logistics.
Aerospace and Defense
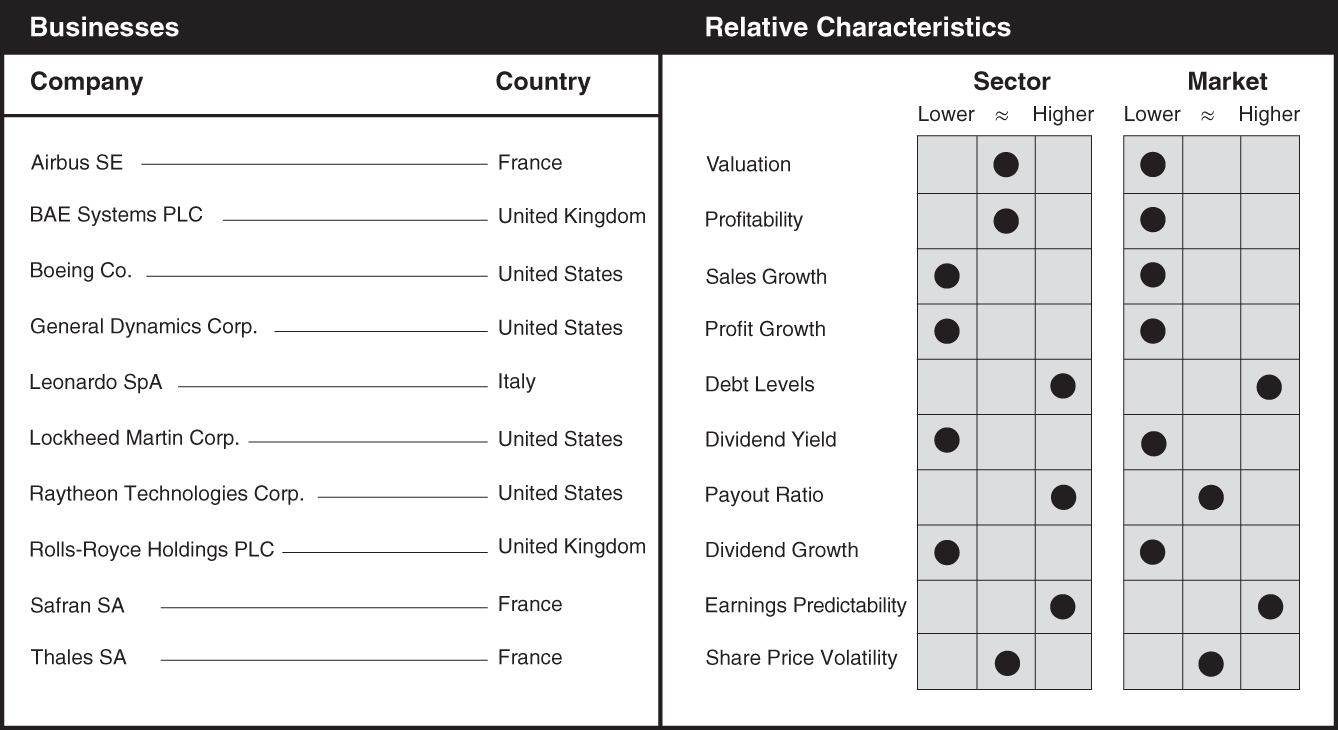
Data source: Bloomberg, as of March 18, 2022.
The aerospace and defense industry is broadly split between military and commercial aerospace equipment. The defense-related segments of these businesses are highly dependent on government spending, and they tend to perform well when geopolitical tensions are rising, especially leading up to and during times of war. The sale of military products to foreign countries requires government approval, often limiting exports. Commercial aerospace, on the other hand, depends primarily on private sector spending, making it more sensitive to the economic cycle, particularly long-term demand for air travel. In defense, key themes include the expansion and modernization of militaries in China and NATO member countries, which are primarily being driven by heightened tensions between the United States, China, and Russia. A noteworthy trend in the aerospace industry is the development of new engine technology focused on decarbonization. Economic factors that impact the industry include inflation, interest rates, government defense budgets, air travel demand, and private sector spending. Aircraft deliveries drive the aerospace industry, distributing cash throughout the supply chain and allowing companies to invest in the next generation of aircraft. Air traffic demand, miles flown, the financial strength of operators and lessors, and jet fuel prices can all impact the aerospace industry. Higher fuel prices may also incentivize operators to buy newer, more fuel-efficient aircraft. Key factors for the defense segments of these companies include earnings and free cash flow, the geopolitical landscape, and government defense budgets. Other important metrics include commercial aircraft deliveries, business segment operating income and margin, free cash flow conversion rates, free cash flow (FCF) margin, R&D as a percentage of sales, capex as a percentage of sales, gross profit and gross margin, EBIT, EBITDA, and related margins. Primary valuation methods include P/E, EV/EBITDA, discounted cash flow (DCF), and FCF yield.
Air Freight and Courier Services
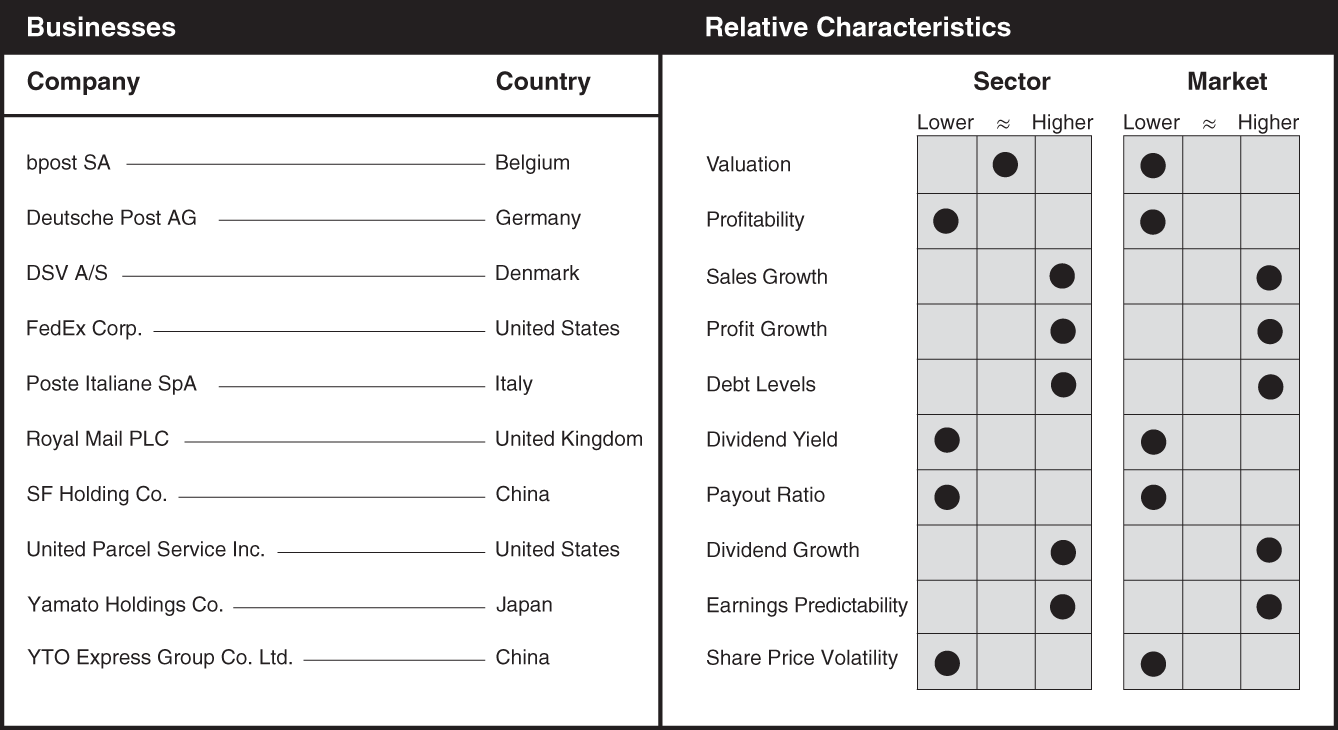
Data source: Bloomberg, as of March 18, 2022.
Although it represents a relatively small portion of the total volume of goods shipped each year worldwide, the air freight industry remains a critical part of the global supply chain. Technological innovations continue to significantly impact this industry, including a shift toward improving logistical efficiencies, autonomous trucking, digital freight brokers, and the use of drones. There is also an ongoing trend toward reducing carbon emissions, which affects the composition of company aircraft and truck fleets. Financial health of consumers and their ability to spend, based partly on where we are in the economic cycle, is an important consideration when assessing future earnings prospects for the air freight industry. Other key economic considerations include GDP growth, inventory levels, labor costs, labor availability, inflation, interest rates, advances in technology and automation, economic activity, e-commerce penetration, fuel surcharges and the ability to pass higher fuel costs on to consumers, labor availability, as well as risks related to changes in tariffs and, in extreme cases, economic sanctions. The rapid growth in e-commerce has been a key driver of sales and profit growth for the industry. Important metrics for investors to follow include pricing, volumes, shipments per trading day, revenue per shipment, total shipments, volume growth by geographic region, utilization rates, fleet count, operating ratio (inverse of operating margins), and EBIT and EBITDA, as well as EPS. Standard valuation metrics such as P/E, P/CF, and EV/EBITDA can be used to compare valuations between companies in this industry.
Air Travel

Data source: Bloomberg, as of March 18, 2022.
The air travel industry was hit hard by the 2020 global pandemic, forcing companies to suspend dividend payments and take on added debt to keep their operations going in a period where passenger volumes dropped by upwards of 90%. Notable industry themes include ESG initiatives whereby companies are upgrading their fleets to more fuel-efficient aircraft, managing capacity more effectively, and providing a wider assortment of premium products to entice customers and earn additional revenues. It remains to be seen whether some of the side effects of the pandemic, such as the reduction in business travel and move to a hybrid or work-from-home model, will last, or whether business travel will fully recover. Since the majority of revenue is derived from business travel, airlines may need to boost revenue from leisure passengers, most likely by adding premium services. Economic factors that have the biggest impact on industry participants include GDP growth, personal consumption expenditures (PCEs), fuel costs, labor costs, interest rates, inflation, jet fuel prices, international and corporate travel demand, and competitive price wars. Important metrics for the industry include available seat miles (ASMs), passenger revenue per available seat mile (PRASM), cost per available seat mile (CASM), CASM excluding fuel, load factor, fleet size, capex, free cash flow, EBITDA, EBITDAR, and EPS. Valuation comparisons can be made using P/E and EV/EBITDA, as well as discounted cash flow (DCF) analysis.
Building Products

Data source: Bloomberg, as of March 18, 2022.
Building products companies produce a wide range of finished products used in the construction of buildings. These include air conditioners, elevators, escalators, door lock systems, glass, insulation, roofing, furnaces, air cleaners, faucets, cabinets, plumbing, security systems, and architectural coatings. Although the housing industry is an important end market, companies in the building products industry also serve commercial construction needs and so benefit from a broad range of customers. Economic factors that have the greatest impact on revenue and earnings for this industry include inflation, changes in interest rates, M&A, and supply chain disruptions. Changes in interest rates can have a significant impact on building products companies since many commercial and residential construction projects are funded through mortgages or other forms of financing. A reduction in interest rates will typically result in an increase in building construction. Companies in this industry have generated below-average growth in sales and profits. In contrast, dividend growth has been strong due to above-average levels of profitability compared to the market. Important metrics that investors should track include commodity prices, EBIT and EBITDA margins, operating income and margins by business segment and region, orders backlog, free cash flow conversion, organic versus acquired sales growth, commercial and residential construction, utilization rates, and discretionary maintenance spending. Valuation metrics such as P/E, P/CF, and EV/EBITDA can be used to assess the valuations of companies in the building products industry.
Commercial Services

Data source: Bloomberg, as of March 18, 2022.
Companies in the commercial services industry provide goods and services to other businesses that are often essential to their operations and serve to reduce costs. These include human resources, cleaning, laundry and uniform services, food services and facility management, delivery of nonfood items used to run and maintain facilities, as well as purchasing and supply chain outsourcing services. Economic factors that are most impactful for industry growth and profitability include GDP growth, inflation, interest rates, unemployment rate, labor-participation rates, and nonfarm payrolls (which indicate new hires). The industry is dependent on the general level of business activity and is therefore sensitive to the economic cycle. Recruitment companies are particularly sensitive to the economic cycle, as temporary staff are often employed by businesses at the preliminary stages of an economic recovery, when the sustainability of the expansion is still uncertain. These same companies can experience a dramatic drop in earnings during recessions as businesses cease hiring temporary employees completely and begin to lay off full-time employees. Companies that operate in multiple geographies and provide vital goods and services are likely to be less sensitive to the economic cycle. Important metrics for investors to follow include gross profit and gross margins, EBITDA and EBITDA margins, organic growth, and EPS growth. Valuation metrics such as P/E, P/CF, and EV/EBITDA are commonly used to compare valuations between companies in this industry.
Construction and Engineering
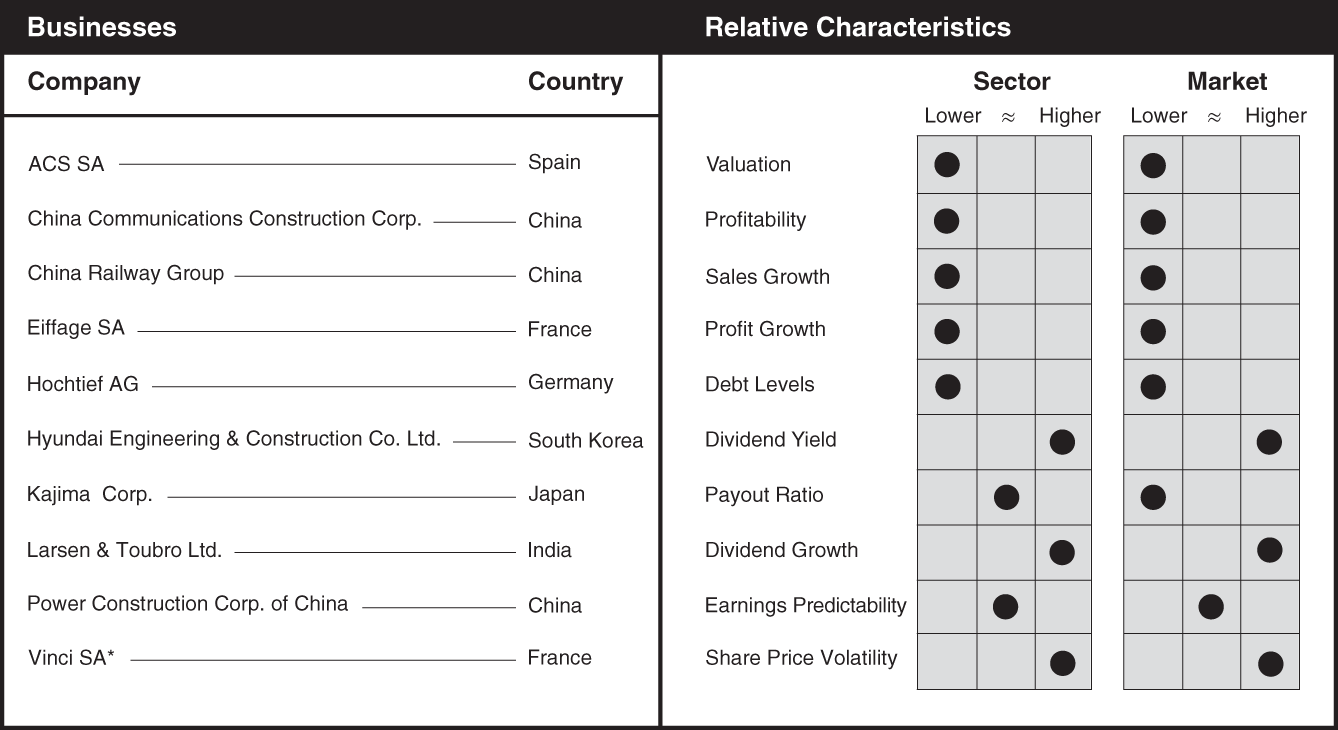
Data source: Bloomberg, as of March 18, 2022.
Construction and engineering companies design and construct buildings as well as infrastructure projects like airports, bridges, dams, tunnels, railways, roadways, and utility lines. Some of the companies in this industry operate concession businesses in which they manage infrastructure projects after they construct them (discussed separately within the infrastructure management industry). Key trends affecting the industry include increased levels of urbanization and the move toward decarbonization and renewable energy, as well as infrastructure upgrades in many countries around the world. Economic factors affecting this industry include GDP growth, infrastructure spending, and the ability of governments and other organizations to raise the capital needed to fund these projects. To the extent that these projects require financing, changes in interest rates can be a deciding factor on whether a project is undertaken. Falling interest rates typically cause an increase in new construction, while rising interest rates could delay the construction of new infrastructure projects. Since many large-scale projects are undertaken by government authorities, the construction and engineering industry is heavily influenced by the general level of government spending. Important metrics to track for this industry include organic and acquired growth, revenue and profit by segment and region, operating income and margins by segment and region, new orders and backlog, consulting service revenue and margins, gross and EBIT margins, days sales outstanding (DSOs), return on invested capital (ROIC), FCF and return on equity (ROE), as well as leverage (net debt to EBITDA). Standard valuation metrics such as P/E, P/CF, and EV/EBITDA can be used to compare valuations between companies in this industry.
Electrical Equipment
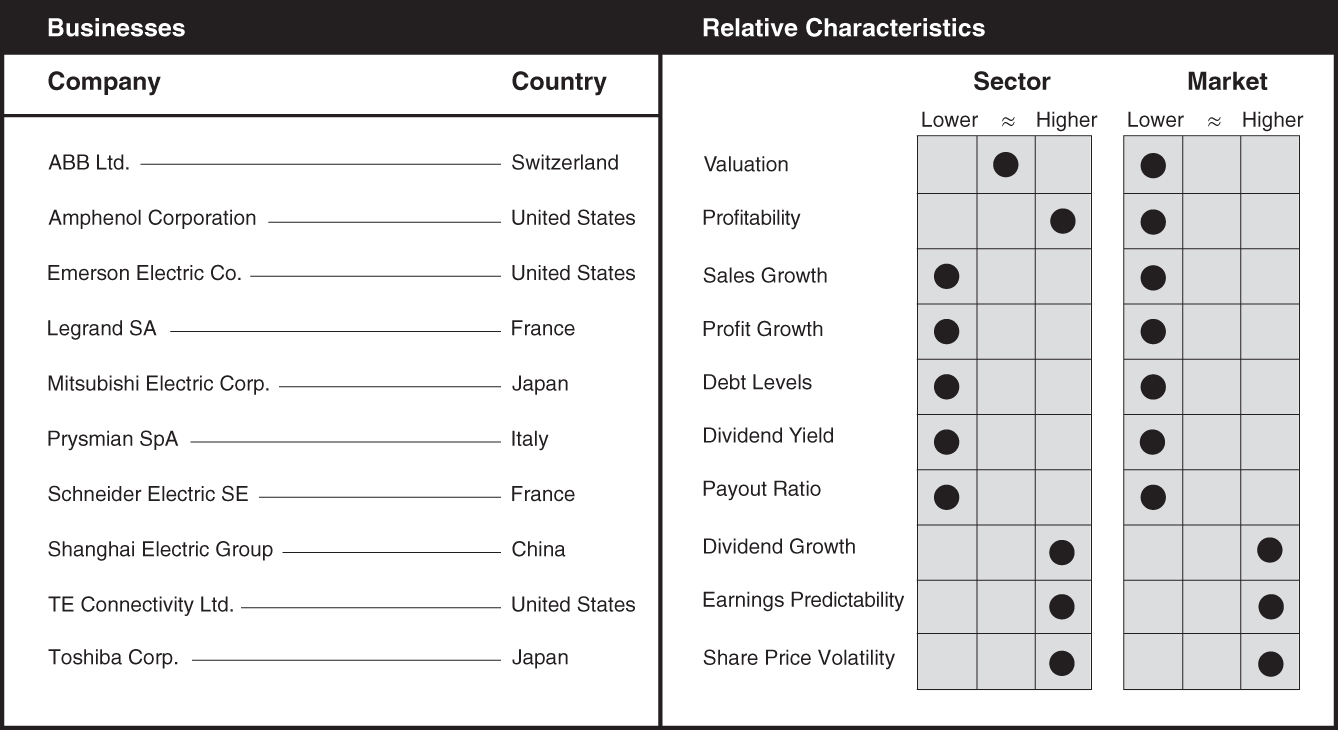
Data source: Bloomberg, as of March 18, 2022.
Companies in the electrical equipment industry produce equipment used in the manufacture of industrial goods. Examples include motors, drivetrain components, factory control and automation equipment, electrical cable, power systems, and robotics. Currently, the industry is benefiting from a trend toward automation as businesses search for ways to improve productivity and reduce costs. Some of these businesses manufacture cable and other products that are benefiting from the buildout of wireless and broadband communication systems globally, as well as energy management components that help reduce energy consumption. Economic factors that help drive industry sales growth and profitability include industrial production and capacity utilization, GDP growth, changes in the level of interest rates, freight costs, the cost and availability of labor, and the general level of employment. These businesses are likely to benefit in rising labor cost environments, which may prompt companies to increase investments in automation. The industry is sensitive to the economic cycle, in particular to changes in corporate capital expenditures. Companies in this industry have traded at lower valuations compared to the market in recent years, most likely due to lower sales and profit growth and lower profitability. Important metrics for investors to monitor include organic revenue growth by segment and region, operating and profit margins by segment and region, inventory levels, order backlog, and capital expenditure plans of key customers, as well as leverage (net debt to EBITDA) versus industry peers. Standard valuation metrics such as P/E, P/CF, and EV/EBITDA can be used to compare valuations between companies in this industry.
Environmental and Facility Services

Data source: Bloomberg, as of March 18, 2022.
Environmental services companies engage in commercial, industrial, municipal, and residential waste collection and disposal. Facility service businesses supply janitorial, parking, security, and other outsourced services related to the management and maintenance of commercial and industrial buildings. The industry also includes companies that supply pest control, recycling services, and environmental remediation and restoration services. The industry has experienced above-average growth rates in recent years, benefiting from a strong trend toward environmental sustainability as businesses look for ways to reduce their environmental footprint. Economic factors that influence industry sales growth and profitability include GDP growth as well as variables that affect economic growth such as changes in interest rates and job growth. Important metrics that investors should monitor for businesses in the environmental service industry include volumes collected by segment and region (usually measured in tons), revenue per ton, gross profit per ton, EBITDA per ton, adjusted EBITDA margin, collection and disposal average yield, tipping fees, churn rate, SG&A expense ratios, capital expenditures as a percentage of sales, and free cash flow conversion. Size and composition of a company's truck fleet is worth noting, along with revenue per truck. Valuation measures such as P/E, P/CF, and EV/EBITDA can be used to compare valuations between companies in this industry.
Heavy Equipment

Data source: Bloomberg, as of March 18, 2022.
Heavy equipment manufacturers produce commercial trucks and vehicles used in construction and mining. Noteworthy trends within the industry include a shift toward zero emissions technology in global commercial vehicle markets using electric batteries and fuel cells, and the development of precision and self-guided construction equipment technologies. Recent infrastructure spending announcements globally should also benefit heavy equipment manufacturers for the foreseeable future. Economic factors that have the greatest impact on revenue growth and profitability for the industry include GDP growth, industrial production, job growth, and changes in interest rates. Commodity prices act both as a driver of costs (steel, rubber) and end demand (iron ore, copper, gold). Since a weaker US dollar tends to increase demand for many commodities, fluctuations in the US dollar exchange rate can also impact the industry. Although sales have grown at a below-average rate compared to the market, the businesses listed here have managed to grow profits and dividends at an above-average rate in recent years. Important metrics to monitor for the industry include organic growth trends, incremental margins, and dealer inventory levels. Replacement demand, freight rates, nonresidential construction spending, industrial production, capacity utilization, and supply chain dynamics are also important variables to monitor. Common measures used to assess the valuations of companies in this industry include P/E, P/CF, and EV/EBITDA.
Industrial Conglomerates

Data source: Bloomberg, as of March 18, 2022.
Like financial conglomerates, industrial conglomerates operate in a broad range of industries. As a result, these companies are best analyzed by looking at their individual business segments. Many of the trends taking place within the industrials sector will have an impact on industrial conglomerates. These include electrification, automation, digitization, building efficiency, and modernization. Economic factors with the greatest influence on firm earnings and sales in this industry include industrial production, the purchasing managers index (PMI), GDP growth, residential and nonresidential construction spending, and broader capex spending. Although sales have grown at a below-average rate compared to the market, these businesses have managed to grow dividends at an above-average rate in the past few years. Important metrics that investors should track include organic growth, operating and EBITDA margins, and incremental margins, as well as all financial and operating metrics that apply to their individual business segments. Although standard valuation metrics such as P/E, P/CF, and EV/EBITDA are often used to compare valuations between companies in this industry, a sum of the parts analysis is most appropriate for companies with diverse and distinct business segments.
Industrial Machinery

Data source: Bloomberg, as of March 18, 2022.
Industrial machinery manufacturers primarily sell goods to companies within the industrial sector. These businesses produce compressors, electronic components, control equipment, logistics equipment, power tools, hydraulic products, fluid connectors, industrial fluids and adhesives, and vacuum and air treatment systems. One of the most notable trends impacting the industry is that of electrification, which could serve to transform the electrical network into a dynamic exchange of electricity and data. Electrification has the potential to provide ample energy in an environmentally friendly manner. Economic factors that have the greatest impact on earnings for the industrial machinery industry include commodity prices (primarily as inputs like steel), freight rates, nonresidential construction spending, replacement demand, industrial production, capacity utilization, and supply chain dynamics. Although industry sales growth has lagged the market, profitability levels and dividend growth have been above average. Important metrics for investors to monitor include organic growth trends, incremental operating margins, organic growth, orders and order backlog, adjusted EBIT, operating margins, and dealer inventory levels. Common measures used to compare valuations between companies in this industry include P/E, P/CF, and EV/EBITDA.
Infrastructure Management
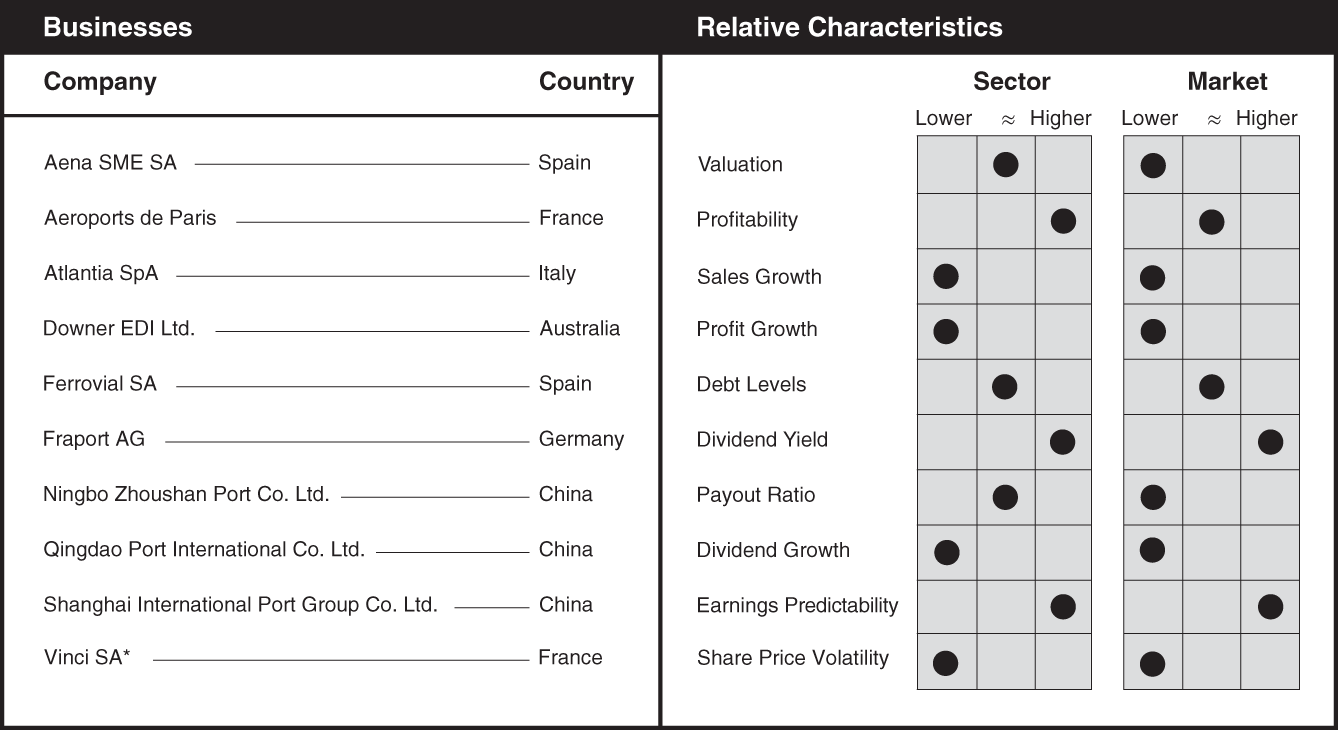
Data source: Bloomberg, as of March 18, 2022.
While businesses in the construction and engineering industry design and construct infrastructure projects like airports, bridges, tunnels, roads, and buildings, the infrastructure management industry operates and maintains those assets after they are built. Some companies compete in both the construction and engineering and infrastructure management industries by designing and building infrastructure projects and operating them after completion. These companies are benefiting from a trend by governments to outsource the task of managing and maintaining public infrastructure. Economic factors that have the greatest impact on industry revenue and earnings growth include fuel prices, which can influence travel volumes (both by air and by car), GDP growth, and the level of employment, which helps determine the number of people commuting for work. Under normal circumstances these businesses generate comparatively stable earnings and cash flows, but the industry could be negatively affected should the recent trend toward working from home and associated reductions in business travel persist. Since the industry depends on overall levels of travel (commuting for work as well as leisure travel), the 2020 global pandemic was detrimental for the industry and resulted in below-average sales, profit, and dividend growth rates. Important metrics for investors to track include road and airline traffic volumes, expected government spending on infrastructure, average toll revenues per trip, average toll price inflation, EBIT margin, and FCF yield. Valuation measures such as P/E, P/CF, and EV/EBITDA can be used to compare valuations between companies in this industry.
Marine Shipping
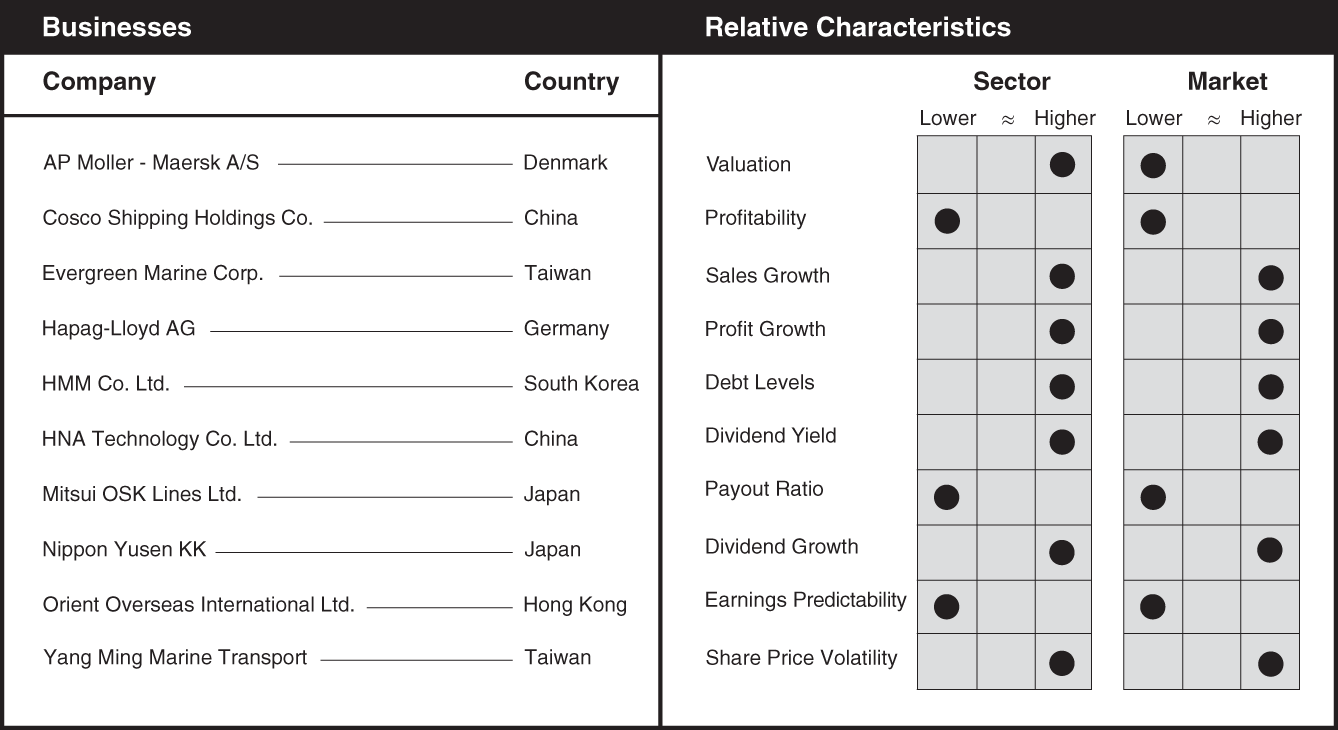
Data source: Bloomberg, as of March 18, 2022.
Businesses in the marine shipping industry transport a wide range of goods by sea. As discussed in Chapter 3, the maritime shipping industry is responsible for transporting roughly 80% of the total volume of world trade. Marine shipping companies are impacted by the type of goods being transported since ships are built to carry a specific type of cargo. Ships carrying oil or iron ore, for example, are not equipped to carry shipping containers. This results in serious inefficiencies, as a ship carrying oil from Australia to China or Japan must return empty of cargo, or a ship moving autos or electronics from Japan to Africa may likewise return with no cargo. In fact, it is estimated that roughly 40% of all ships at sea are traveling with no cargo at any given point in time. For this reason, there is a significant effort being made to improve logistical processes and software, and to develop more fuel-efficient vessels. A primary driver for the industry is increasing globalization and corresponding growth in global trade. Economic factors that have the biggest impact on sales growth and profitability for the industry include regional and global GDP growth, labor costs and availability, and fuel costs. As a key beneficiary of global economic growth and increased trade volumes, sales and profit growth for the industry have been strong. Marine shipping companies tend to maintain high levels of debt needed to fund the purchase of new vessels, which can cost over US$100 million each to build. Important metrics that investors should monitor for the marine shipping industry include shipping prices or day rates (the Baltic Dry Index is one such indicator), shipping volumes, utilization rates, fleet count, new fleet builds and ship order backlog, operating ratio (inverse of operating margins), EBIT and EBITDA margins, and EPS. Standard valuation measures such as P/E, P/CF, and EV to EBITDA can be used to compare valuations between companies in this industry.
Railroads
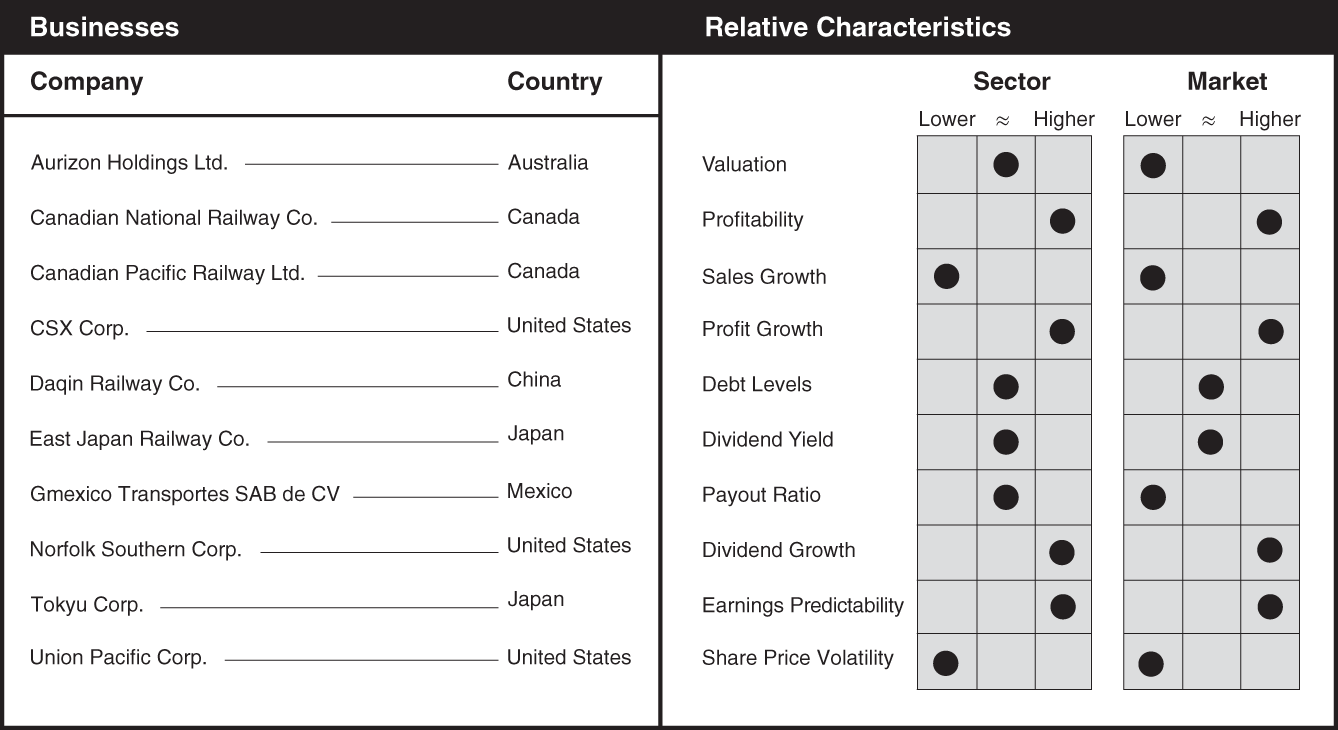
Data source: Bloomberg, as of March 18, 2022.
Railroads are a cost-effective method for shipping goods over great distances by land but are seldom able to deliver goods directly to their final destination. Nevertheless, railroads form a critical component of the global supply chain. A prevalent theme within the railroad industry has been the development of precision scheduled railroading, which tries to maximize the asset utilization (and minimize the operating ratio) of a railroad system by focusing on point-to-point movement of individual freight cars. Rail operators currently view the rapidly evolving autonomous truck market as a potential threat to their business models. Economic factors with the biggest influence on sales growth and profitability for the railroad industry include GDP growth, interest rates, availability and relative cost of competing freight modes (air, truck, and pipeline), inventory levels in major segments of the economy (such as autos), labor costs, and fuel costs. The rail industry has generated comparatively strong profit margins and delivered above-average profit and dividend growth in the past few years due to strong economic growth and shipping volumes. Important metrics for investors to track include total carloads, carloads by segment, carload growth, revenue ton miles (RTM) per carload, gross ton miles (GTM) per carload, revenue per carload, operating income and operating margin, operating ratio, operating ratio ex-fuel surcharge, capital expenditures, free cash flow, pricing, volumes, utilization, fleet count, asset turnover, EBIT and EBITDA margins, and leverage (net debt to EBITDA ratio). Valuation measures such as P/E and EV to EBITDA as well as discounted cash flow analysis are commonly used to compare valuations between companies in this industry.
Trading and Distribution
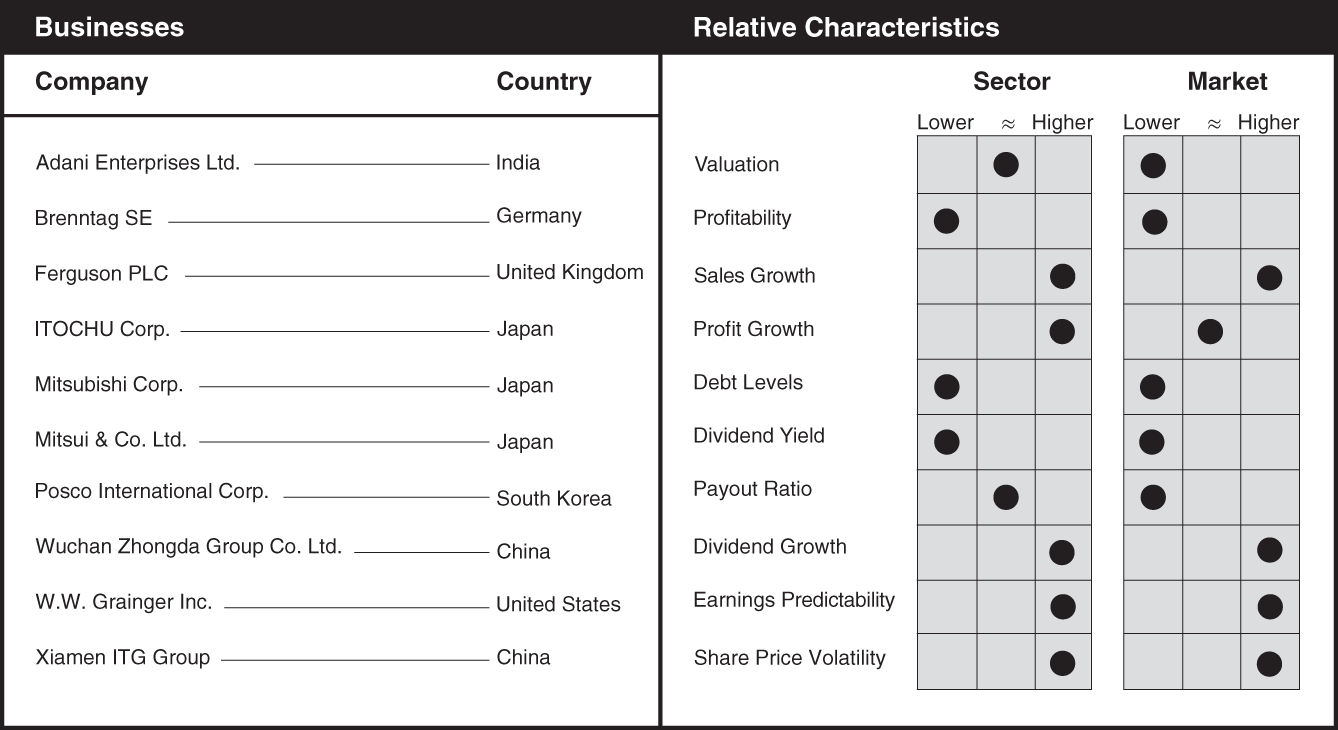
Data source: Bloomberg, as of March 18, 2022.
Trading and distribution companies conduct import and export operations. Many of these companies resemble conglomerates in that they operate in multiple segments of the economy. Economic factors that can affect sales growth and profitability of the industry include inflation (and the ability of the company to pass through higher costs to customers), GDP growth in the regions in which they operate, construction spending, housing construction, infrastructure spending, and freight costs. To the extent trading companies can pass through higher costs, they can serve as a hedge against inflation. Since these companies are primarily trading goods rather than manufacturing them, they have tended to produce somewhat lower profit margins compared to the industrial sector but make up for this with high and growing sales volumes. This has allowed these businesses to grow their dividends at an above-average rate. Important metrics for investors to track include the split between commodity and noncommodity revenues, revenues and operating margins by segment and region, inventory levels, commodity prices, operating margins, capital expenditures, SG&A expenses, tax rates, growth in EBIT and EBITDA margins, supply chain dynamics, and leverage (net debt to EBITDA). Valuation measures such as P/E, P/CF, and EV/EBITDA or discounted cash flow analysis can be used to compare valuations between companies in this industry.
Trucking and Logistics

Data source: Bloomberg, as of March 18, 2022.
While railroads are very cost-effective for shipping goods over great distances by land, trucks are often required to get products to their final destination. Goods transported by rail must usually be unloaded and put into trucks for delivery to customers that are not conveniently located directly on rail lines. Fortunately, shipping containers make this a simple task. It is becoming increasingly difficult to attract sufficient truck drivers to keep up with growing demand. Labor availability therefore has been a particularly big challenge for trucking companies in recent years, and a primary motivation for the development of autonomous trucking technologies. Newly emerging companies are attempting to create trucks that can operate without human intervention, but this technology is still in its infancy and must undergo a great deal of testing before it is presumed safe for widespread use. In addition to autonomous trucking, the trucking industry is being impacted by a shift to more fuel-efficient trucks, growth of digital freight brokers, improvements in logistic software, and the potential introduction of competing delivery methods, such as drones. Although profit margins for the industry have lagged the market, growth rates in sales, profits, and dividends have been strong. Economic factors with the greatest influence on the trucking industry's sales growth and profitability include GDP growth, interest rates, trade flows, personal consumption, industrial production and capacity utilization, inventory levels, unemployment levels, labor costs and availability, and fuel costs. Important metrics for investors to monitor include pricing, volumes, utilization, fleet count, operating ratio, EBIT and EBITDA, and EPS. Standard valuation measures such as P/E, P/CF, and EV to EBITDA can be used to compare valuations between companies in this industry.