
How Catastrophe Modeling Can Be Applied to Cyber Risk
Scott Stransky, assistant vice president and principal scientist at AIR Worldwide
Tomas Girnius, PhD, manager and principal scientist at AIR Worldwide
One may wonder how a company proficient in building models to estimate losses from hurricanes and other natural disasters can use their techniques to build a similar model for estimating losses from cyberattacks.
Hurricane Andrew spawned the catastrophe‐modeling industry. Although catastrophe models existed before that storm in 1992, they were not used by decision makers, nor were they used to their full potential. When the storm struck south Florida, AIR issued modeled loss estimates on the order of $13 billion, a figure that the insurance industry scoffed at for being far too high. As the claims for Andrew started to pile up, 11 insurers went out of business, and the rest of the industry began to see the value in running models. The “Hurricane Andrew of Cyber” has yet to strike the cyber insurance industry, and when it does, those companies using models will be far better off than those using so‐called underwriting judgment.
AIR is employing the same stochastic modeling framework (Figure B.15) that it has reliably used for its catastrophe model for nearly 30 years. This is best described by analogy to hurricane modeling. Hurricanes can be visualized and have been widely studied. We begin with historical data on hurricane events, publicly available from the National Hurricane Center and other sources, and determine distributions for various parameters, such as how many storms there will be per year, where along the coastline those storms will hit, how intense they will be, and so forth. We then do a Monte Carlo simulation using all of these distributions to develop our stochastic “catalog” of events. This catalog contains 100,000 simulated hurricane seasons—not predicting 100,000 years into the future, but instead looking at plausible versions of next year's hurricane season. For cyber, we have data from collaborators that will allow us to determine distributions for the number of attacks per year, which industries they are targeting, whether they are impacting larger or smaller companies, and in the case of a data breach, how many records have been stolen. This is in addition to information on the type of data that tends to be affected, the types of actors doing the attacks, and any ramifications of the attack—for example, whether data is stolen, businesses experience downtime, or the companies are sued. We will use this for our Monte Carlo simulation for cyber events by drawing from these distributions to create a catalog of events.
The next phase of the model is the vulnerability component, in which the catalog, together with information about the risk itself, is used to determine damage. For wind perils, we can use data from wind tunnels, computational fluid dynamics, post‐disaster surveys, and engineering studies. For cyber, we are working with data that helps differentiate the risks between various industries, company sizes, company locations, and other features. The final step of the model is to estimate losses, including average annual losses, 1 in 100 losses, 1 in 250 losses—for individual accounts as well as entire portfolios of accounts. To do this, we need historical loss data. We are working with several primary insurers to get such data, in return for cyber‐risk consulting studies and early model results. This data allows us to calibrate and validate the loss results that the model produces.
The recent vintage of available cyberattack data—essentially available for only a few years—effectively ensures the “left censoring” referred to by Andrew Jaquith. The extremely large number of cyber events during the past few years ensures that the pool of data available is not impoverished as a result. The large amounts of basic cyber data define the size and shape of the bodies of fitted statistical distributions, very much akin to traditional actuarial methods. That large volume of data assures that the parameters fitted to those distributions are sufficiently robust to allow for sampling from the tails. Here, catastrophe modeling diverges from traditional actuarial practice—it is, indeed, the occasional Monte Carlo sample from the tail of the distribution that results in the extreme scenarios that are the purview of catastrophe modeling. It is only because the body of the distribution has been fitted well that we have confidence in the structure of the tail. This addresses the issue of determining extreme individual events in the catalog.
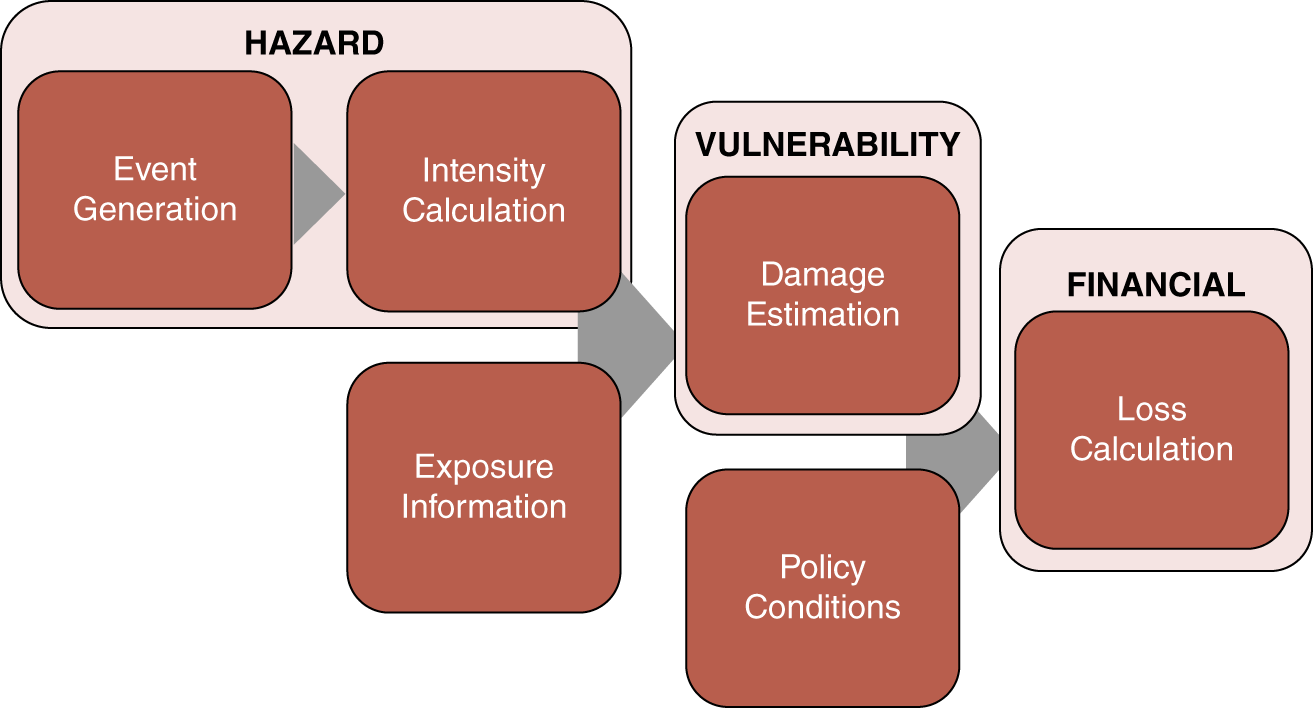
FIGURE B.15 The AIR worldwide catastrophe modeling framework