
Chapter 6. Time management: Getting it done on time
Time management is what most people think of when they think of project managers. It’s where the deadlines are set and met. It starts with figuring out what work you need to do, how you will do it, what resources you’ll use, and how long it will take. From there, it’s all about developing and controlling that schedule.
Reality sets in for the happy couple
Rob and Rebecca have decided to tie the knot, but they don’t have much time to plan their wedding. They want the big day to be unforgettable. They want to invite a lot of people and show them all a great time.
But just thinking about all of the details involved is overwhelming. Somewhere around picking the paper for the invitations, the couple realize they need help...


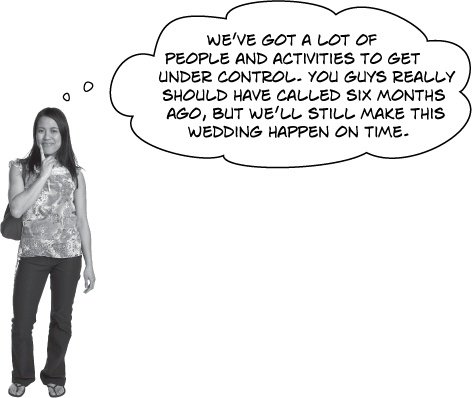
Meet the wedding planner

Rob: We want everything to be perfect.
Rebecca: There is so much to do! Invitations, food, guests, music...
Rob: Oh no, we haven’t even booked the place.
Rebecca: And it’s all got to be done right. We can’t print the invitations until we have the menu planned. We can’t do the seating arrangements until we have the RSVPs. We aren’t sure what kind of band to get for the reception, or should it be a DJ? We’re just overwhelmed.
Rob: My sister said you really saved her wedding. I know she gave you over a year to plan.
Rebecca: But I’ve always dreamed of a June wedding, and I’m not willing to give that up. I know it’s late, but can you help us?
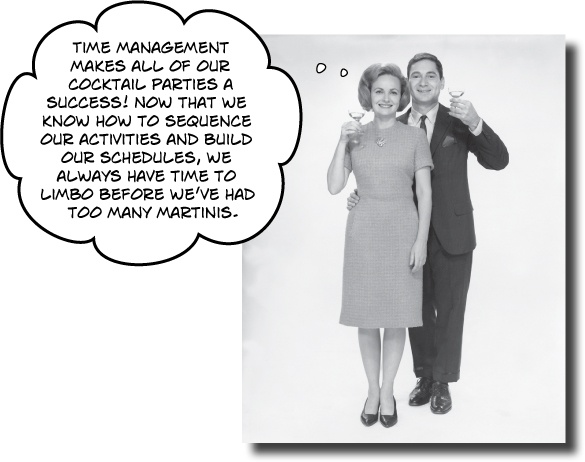
Time management helps with aggressive timelines
Since there are so many different people involved in making the wedding go smoothly, it takes a lot of planning to make sure that all of the work happens in the right order, gets done by the right people, and doesn’t take too long. That’s what the Time Management knowledge area is all about.
Initially, Kathleen was worried that she didn’t have enough time to make sure everything was done properly. But she knew that she had some powerful time management tools on her side when she took the job, and they’ll help her make sure that everything will work out fine.
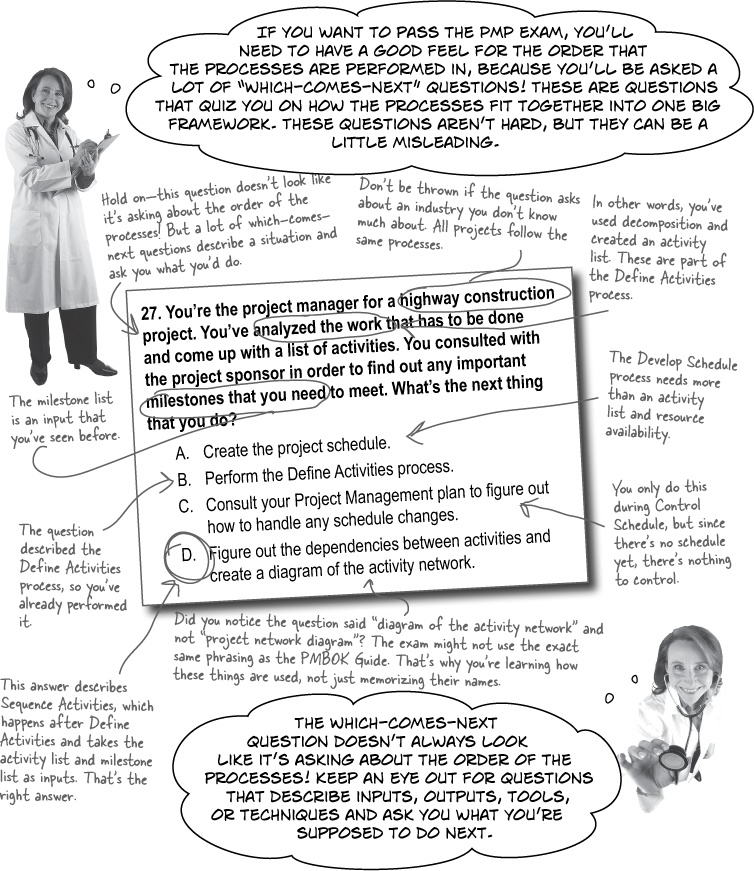
You need to know the order of the Time Management processes for the exam. Luckily, they are pretty intuitive. Can you figure out the order?
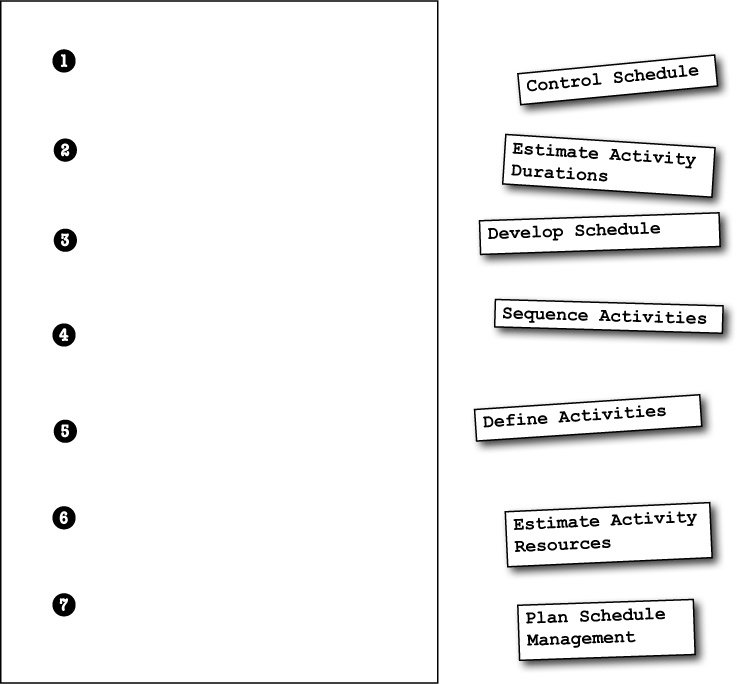
Here are the correct order and the main output for each of the Time Management processes.
First you define the processes you’ll use to plan and control your schedule.
Next you come up with a list of all of the activities that will need to be completed.
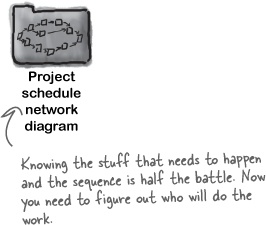
Next, you figure out which activities need to come before others, and put them in the right order. The main output here is a project schedule network diagram, a picture of how activities are related.
First you estimate the resources you’ll need to do the job, and create a list of them...
...and then estimate the time it will take to do each activity.
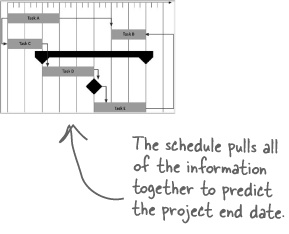
Then you build a schedule from all of the estimates and the resource and activity information you’ve created.
Finally, you monitor and control changes to the schedule to make sure that it is kept up to date.


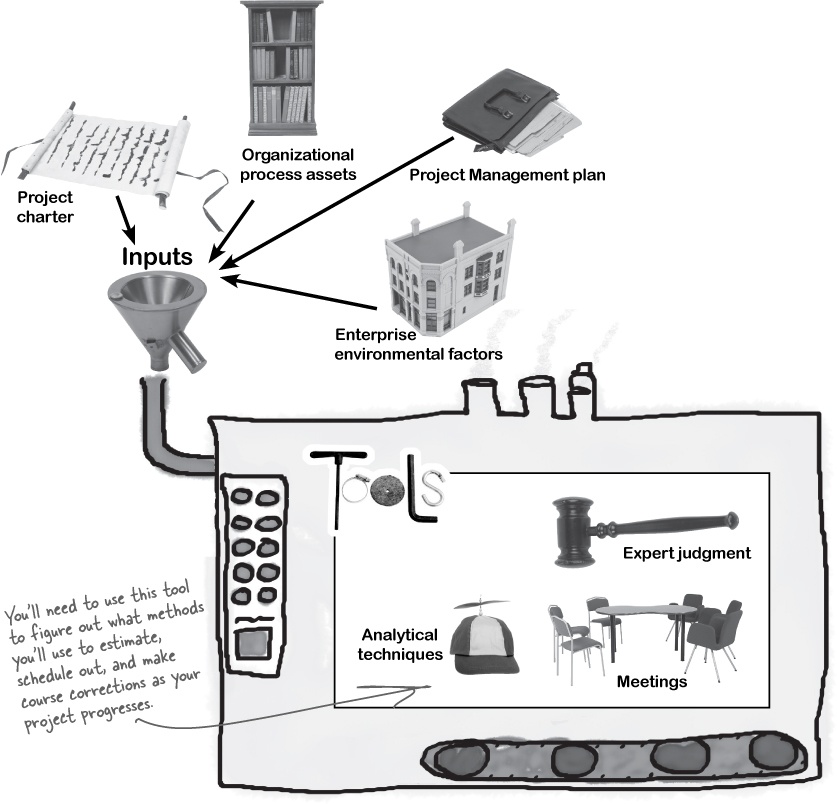
Plan your scheduling processes
The Plan Schedule Management process is just like all of the other planning processes you’ve seen so far. In fact, you’ve already seen all of the inputs and tools that are used to create it in previous processes. Just like with the Plan Scope Management process from Chapter 5, your goal is to build a Schedule Management plan from the other project management plans, your company’s culture and existing documents, and the project charter.
Now you know how you’ll track your schedule

The only output of the Plan Schedule Management process is the Schedule Management plan. It describes the way you’ll estimate your work, track your progress, and report on it.
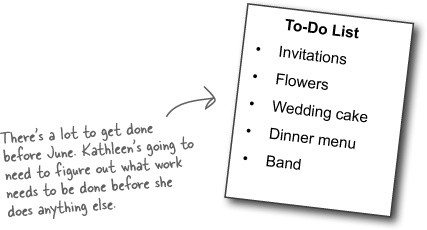
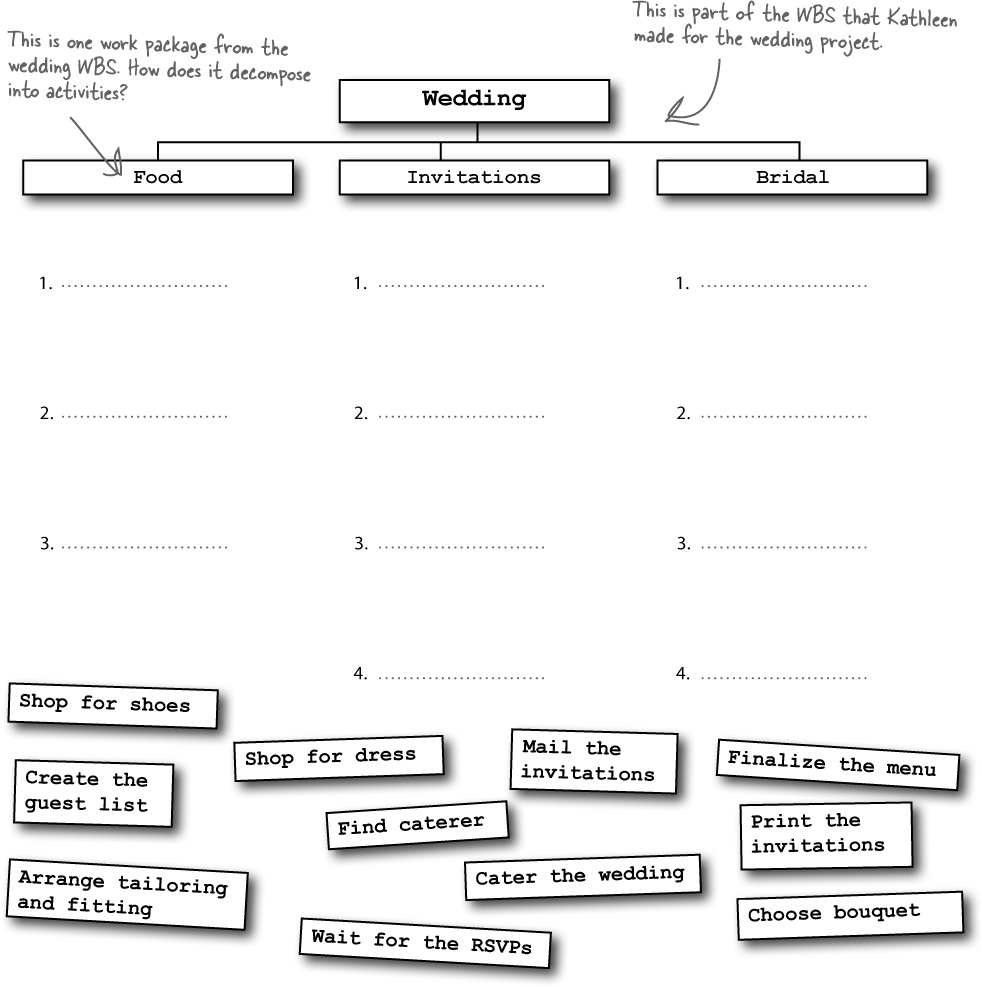
Use the Define Activities process to break down the work
Define Activities uses everything we already know about the project to divide the work into activities that can be estimated. The inputs for this process all come from the processes in the Scope Management and Integration Management knowledge areas. The first step in Time Management is figuring out how the project work breaks down into activities—and that’s what the Define Activities process is for.

Tools and techniques for Define Activities
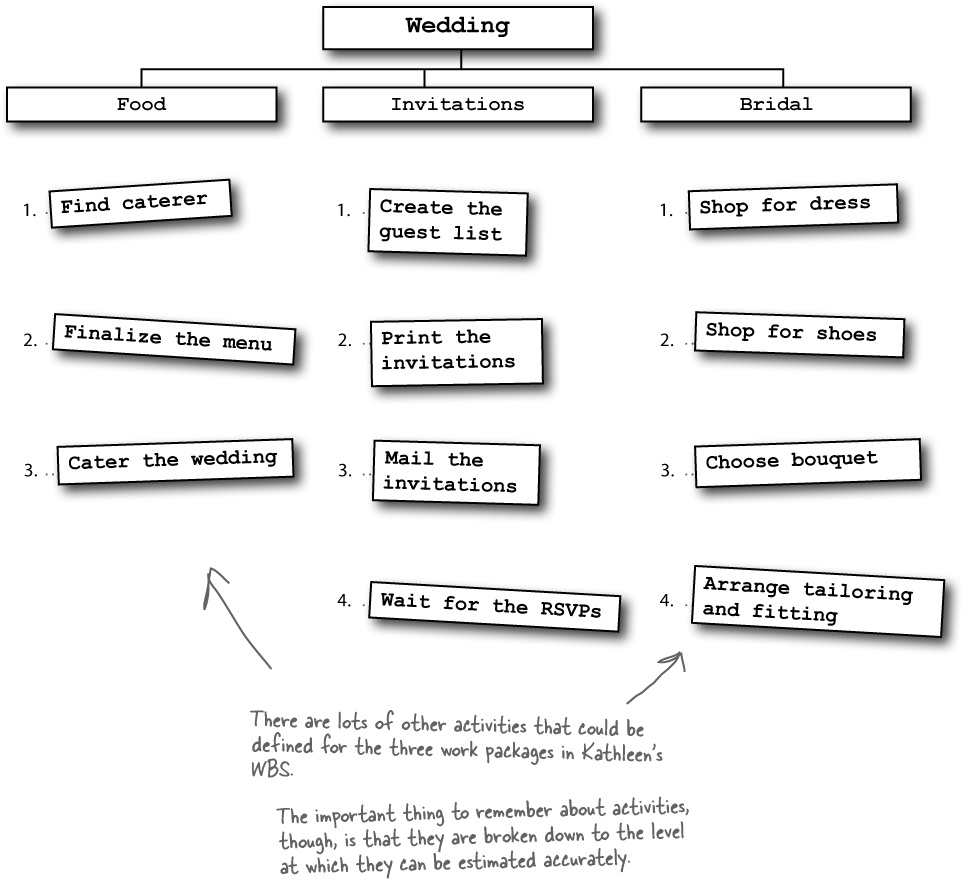
Kathleen wrote down everything she knew about the project. She used the activity list from her last wedding as a guide and then thought about the things that Rob and Rebecca wanted that were different from her past projects. She broke those things down into activities and pulled everything together into an activity list.
Decomposition
This means taking the work packages you defined in the Scope Management processes and breaking them down even further into activities that can be estimated.

Expert judgment
Ask somebody who has done this before to give an opinion on what activities will be needed to get the job done.

Rolling wave planning
When you plan this way, you decompose only the activities that you need to plan for because they’re coming up soon. You leave everything else planned at the milestone level until it gets closer to the time when you’ll do it.

Rolling wave planning lets you plan as you go

Sometimes you start a project without knowing a lot about the work that you’ll be doing later. Rolling wave planning lets you plan and schedule only the stuff that you know enough about to plan well.
If Kathleen were using rolling wave planning, she might write a schedule for only the tasks it takes to do the invitations, and leave the planning for the menu and the seating up in the air until she knows who will RSVP.
Rob and Rebecca probably wouldn’t be happy hearing that Kathleen was only going to plan for the invitations to be sent, though. They want to know that their wedding is going to happen on time. That’s why rolling wave planning should only be used in cases where it’s not possible to plan any other way.
Think back to the definition of a project in Chapter 2. Remember how projects are progressively elaborated? Rolling wave planning takes advantage of the fact that you know more about the project as you go to make plans more accurate.
Define activities outputs
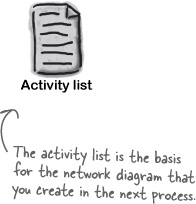
The main output of this process is the activity list. It’s the basis for all of the estimation and scheduling tasks you will do next. But there are a few other outputs that go along with it, and help to make the estimates more detailed and accurate.
Activity list
This is a list of everything that needs to be done to complete your project. This list is lower-level than the WBS. It’s all the activities that must be accomplished to deliver the work packages.

Activity attributes
Here’s where the description of each activity is kept. All of the information you need to figure out the order of the work should be here, too. So any predecessor activities, successor activities, or constraints should be listed in the attributes, along with descriptions and any other information about resources or time that you need for planning.

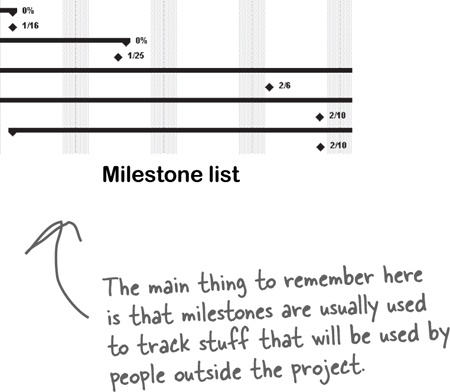
Milestone list
Note
Some milestones for the wedding:
Invitations sent
Menu finalized
Church booked
Bridesmaids’ dresses fitted
All of the important checkpoints of your project are tracked as milestones. Some of them could be listed in your contract as requirements of successful completion; some could just be significant points in the project that you want to keep track of. The milestone list needs to let everybody know which are required and which are not.


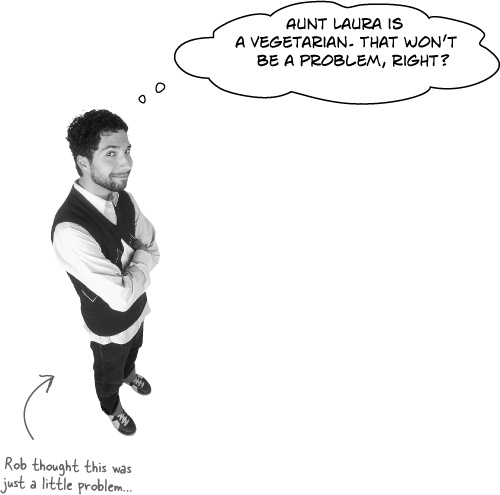
Rob: The quartet cancelled. They had another wedding that day.
Rebecca: Aunt Laura is supposed to do the reading at the service, but after what happened at Uncle Stu’s funeral, I think I want someone else to do it.
Rob: Should we really have a pan flute player? I’m beginning to think it might be overkill.
Rebecca: Maybe we should hold off printing the invitations until this stuff is worked out.
Kathleen: OK, let’s think about exactly how we want to do this. We need to be sure about how we want the service to go before we do any more printing.
The Sequence Activities process puts everything in order
Now that we know what we have to do to make the wedding a success, we need to focus on the order of the work. Kathleen sat down with all of the activities she had defined for the wedding and decided to figure out exactly how they needed to happen. That’s where she used the Sequence Activities process.
The activity attributes and the activity list she had created had most of the predecessors and successors written in them. Her milestone list had major pieces of work written down, and there were a couple of changes to the scope she had discovered along the way that were approved and ready to go.
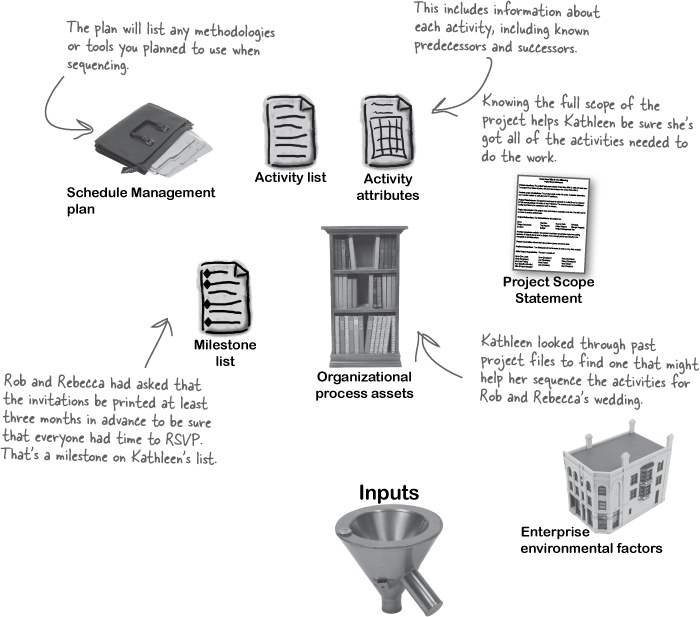
Diagram the relationship between activities
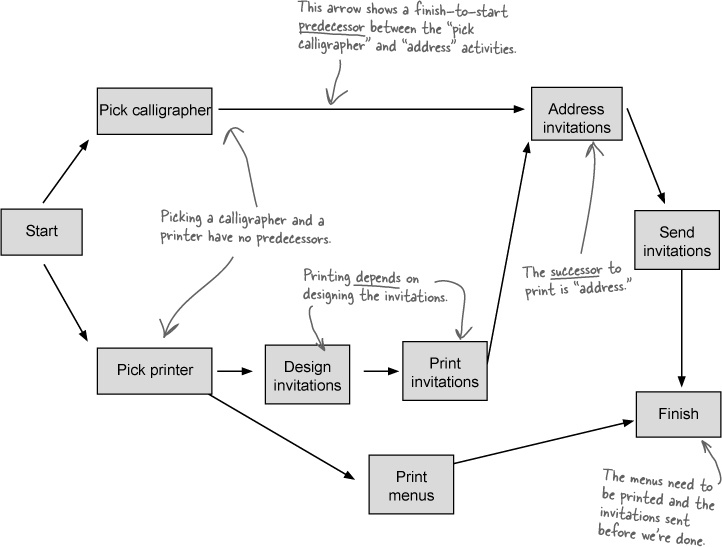
One way to visualize the way activities relate is to create a network diagram. Kathleen created this one to show how the activities involved in producing the invitations depend on one another.
For example, the calligrapher is the person who’s hired to write the addresses on the invitations, so Rob and Rebecca need to pick a calligrapher before the invitations can be addressed. But the invitations also need to be printed before they can be addressed, because otherwise the calligrapher won’t have anything to write on! See how predecessors can get all complicated? Luckily, a diagram makes sense of them!
Showing the activities in rectangles and their relationships as arrows is called a precedence diagramming method (PDM).
Network diagrams put your tasks in perspective
Just looking at the way all of these tasks relate to one another can help you figure out what’s important at any time in the project. Once Rob and Rebecca looked at the network diagram below, they realized they needed to get online and start looking for a venue for their wedding right away, even before they’d figured out their budget and guest list.

You’ll need to know how to turn a table of nodes into a network diagram, so here’s your chance to get some practice! Here’s a list of nodes for a PDM network diagram. Try drawing the diagram based on it:
Name | Predecessor |
Start | — |
A | Start |
B | A |
C | B |
D | Start |
E | D |
F | B |
G | C |
H | D |
I | E, H |
Finish | F, G, I |
Now try another one!
Name | Predecessor |
Start | — |
1 | Start |
2 | 1 |
3 | 2 |
4 | Start |
5 | 3 |
6 | Start |
7 | 6 |
Finish | 7, 4, 5 |
![]() Answers in Sharpen your pencil Solution.
Answers in Sharpen your pencil Solution.
Dependencies help you sequence your activities
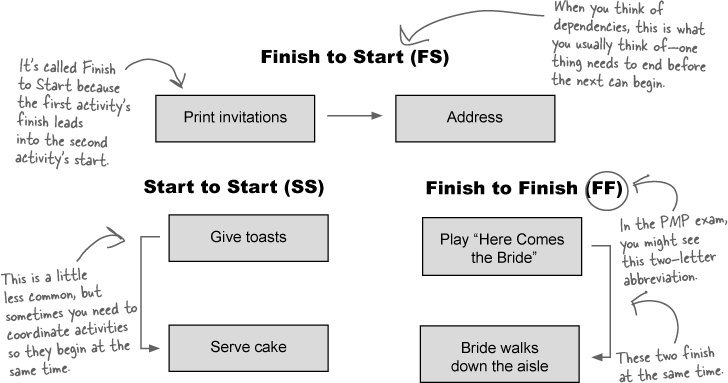
The most common kind of predecessor is the Finish to Start. It means that one task needs to be completed before another one can start. There are a few other kinds of predecessors, though. They can all be used in network diagrams to show the order of activities. The three main kinds of dependency are Finish to Start (FS), Start to Start (SS), and Finish to Finish (FF).
External dependencies
Sometimes your project will depend on things outside the work you are doing. For the wedding, we are depending on the wedding party before us to be out of the reception hall in time for us to decorate. The decoration of the reception hall then depends on that as an external dependency.
Discretionary dependencies
Rob and Rebecca really want the bridesmaids to arrive at the reception before the couple. There’s no necessity there—it’s just a matter of preference. For the exam, know that you should set discretionary dependencies based on your knowledge of the best practices for getting the job done.
Mandatory dependencies
You can’t address an invitation that hasn’t been printed yet. So, printing invitations is a mandatory predecessor for addressing them. Mandatory predecessors are the kind that have to exist just because of the nature of the work.
Internal dependencies
The rehearsal dinner can’t begin until the happy couple leaves the church. Some dependencies are completely within the team’s control.
Leads and lags add time between activities
Sometimes you need to give some extra time between activities. Lag time is when you purposefully put a delay between the predecessor task and the successor. For example, when the bride and her father dance, the guests wait awhile before they join them.
Lead time is when you give a successor task some time to get started before the predecessor finishes. So you might want the caterer preparing dessert an hour before everybody is eating dinner.


You should still think of things in sequence.
For the test, it’s important to know the order of these processes. And even though you might do it all at once, you probably spend some time thinking about each of these things.
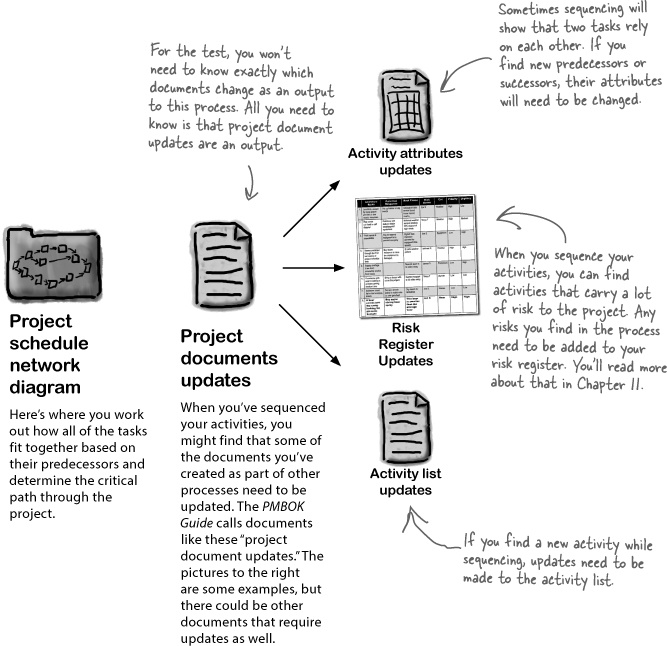
Create the network diagram
As you sequence the activities, you will find new activities that need to be added and new attributes for activities that you didn’t know about. So, while the main product of this process is the network diagram, you also produce updates to some of the Define Activities documents and outputs of other processes, too.
Rob and Rebecca have resource problems
Getting a handle on all of the tasks that have to be done is a great start. But it’s not enough to know the tasks and the order they come in. Before you can put a schedule together, you need to know who is going to do each job, and the things they need available to them in order to do it! Those are resources, and getting a handle on them is a very important part of Time Management.
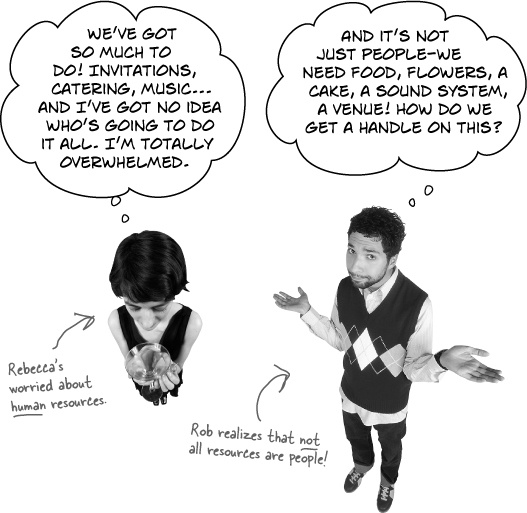
Resources are people, equipment, locations, or anything else that you need in order to do all of the activities that you planned for. Every activity in your activity list needs to have resources assigned to it.
What you need to estimate resources
Good news: you’ve already seen most of the inputs to the Estimate Activity Resources process already! Before you can assign resources to your project, you need to know which ones you’re authorized to use on your project. That’s an input, and it’s called resource calendars. You’ll also need the activity list that you created earlier, and you’ll need to know about how your organization typically handles resources. Once you’ve got a handle on these things, you’re set for resource estimation.
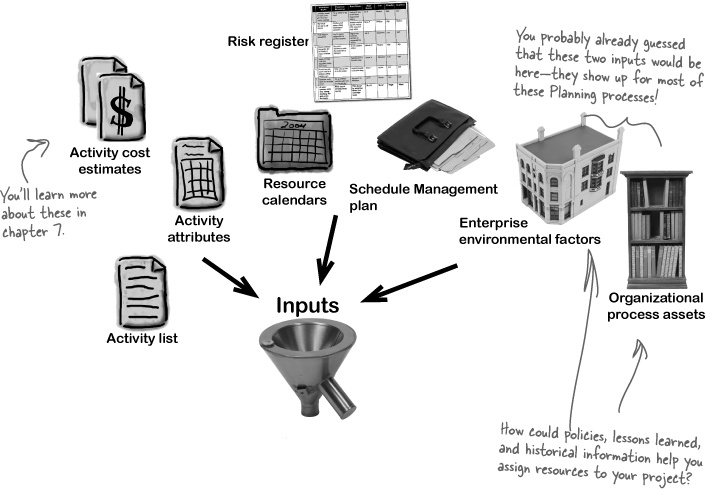
Resource calendars
When you plan out a project, you need information about what resources you can use for various activities, and when they’re available to you. That’s what resource calendars are for. Don’t forget that some resources, like consultants or training rooms, have to be scheduled in advance, and they might only be available at certain times. You’ll need to know this before you can finish planning your project.
Note
A June wedding is harder to plan than one in December, because the wedding halls are all booked up. That’s a resource constraint!
Resource calendars are the only new input to the Estimate Activity Resources process. You’ve already seen the rest of the inputs.
Estimating the resources
The goal of Estimate Activity Resources is to assign resources to each activity in the activity list. There are five tools and techniques for the Estimate Activity Resources process. Some of them have technical-sounding names, but they’re all actually pretty sensible when you think about it. They should all make sense to you when you think about what you have to do to figure out what resources your project needs.
Expert judgment means bringing in experts who have done this sort of work before and getting their opinions on what resources are needed.
Alternative analysis means considering several different options for how you assign resources. This includes varying the number of resources as well as the kind of resources you use.
Published estimating data is something that project managers in a lot of industries use to help them figure out how many resources they need. They rely on articles, books, journals, and periodicals that collect, analyze, and publish data from other people’s projects.
Project management software like Microsoft Project will often have features designed to help project managers play around with resources and constraints and find the best combination of assignments for the project.
Bottom-up estimating is a technique that you may have used before without even knowing it! It means breaking down complex activities into pieces, and working out the resource assignments for each of those simpler pieces using the other four tools and techniques.
You’ll need to understand the different Estimate Activity Resources tools and techniques for the exam. Look at each of these scenarios and write down which of the five activity resource estimation tools and techniques is being used.
Kathleen has to figure out what to do for the music at Rob and Rebecca’s wedding. She considers using a DJ, a rock band, or a string quartet.
The latest issue of Wedding Planner’s Journal has an article on working with caterers. It includes a table that shows how many waiters work with various guest-list sizes.
There’s a national wedding consultant who specializes in Caribbean-themed weddings. Kathleen gets in touch with her to ask about menu options.
Kathleen downloads and fills out a specialized spreadsheet that a project manager developed to help with wedding planning.
There’s so much work that has to be done to set up the reception hall that Kathleen has to break it down into five different activities in order to assign jobs.
Kathleen asks Rob and Rebecca to visit several different caterers and sample various potential items for the menu.
Kathleen calls up her friend who knows specifics of the various venues in their area for advice on which one would work best.
 Answers in Sharpen your pencil Solution.
Figuring out how long the project will take
Once you’re done with Estimate Activity Resources, you’ve got everything you need to figure out how long each activity will take. That’s done in a process called Estimate Activity Durations. This is where you look at each activity in the activity list, consider the scope and the resources, and estimate how long it will take to perform.
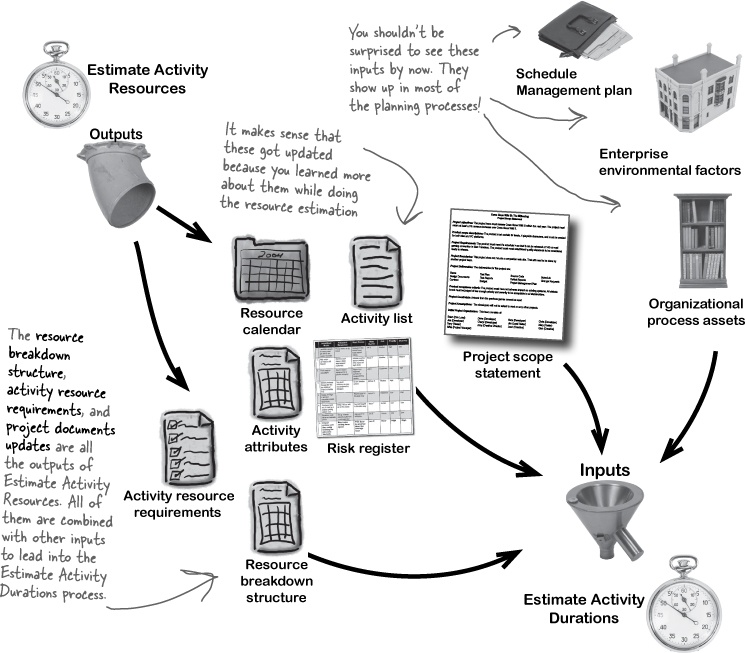
Most of the outputs of Estimate Activity Resources are immediately used as inputs for Estimate Activity Durations.
Estimation tools and techniques
Estimating the duration of an activity means starting with the information you have about that activity and the resources that are assigned to it, and then working with the project team to come up with an estimate. Most of the time you’ll start with a rough estimate and then refine it (maybe a few times!) to make it more accurate. You’ll use these five tools and techniques to create the most accurate estimates.
Expert judgment will come from your project team members who are familiar with the work that has to be done. If you don’t get their opinion, then there’s a huge risk that your estimates will be wrong! | Analogous estimating is when you look at activities from previous projects that were similar to this one and look at how long it took to do similar work before. But this only works if the activities and the project team are similar! |
Parametric estimating means plugging data about your project into a formula, spreadsheet, database, or computer program that comes up with an estimate. The software or formula that you use for parametric estimating is built on a database of actual durations from past projects. | Three-point estimates are when you come up with three numbers: a most likely estimate that probably will happen, an optimistic one that represents the best-case scenario, and a pessimistic one that represents the worst-case scenario. The final estimate is the average. |
Reserve analysis means adding extra time to the schedule (called a contingency reserve or a buffer) to account for extra risk. | Group decision techniques help the team decide on the best estimates for the activities they’ve defined. |
Each of these scenarios describes a different tool or technique from Estimate Activity Durations. Write down which tool or technique is being described.
Kathleen comes up with three estimates (one where everything goes wrong, one where some things go wrong, and one where nothing goes wrong) for printing invitations, and averages them together to come up with a final number. __________________
There will be two different catering companies at the wedding. Kathleen asks the head chef at each of them to give her an estimate of how long it will take to do the job. __________________
There’s a spreadsheet Kathleen always uses to figure out how long it takes guests to RSVP. She enters the number of guests and their ZIP codes, and it calculates an estimate for her. __________________
Kathleen’s done four weddings that are very similar to Rob and Rebecca’s, and in all four of them it took exactly the same amount of time for the caterers to set up the reception hall. __________________
![]() Answers in Sharpen your pencil Solution.
Answers in Sharpen your pencil Solution.
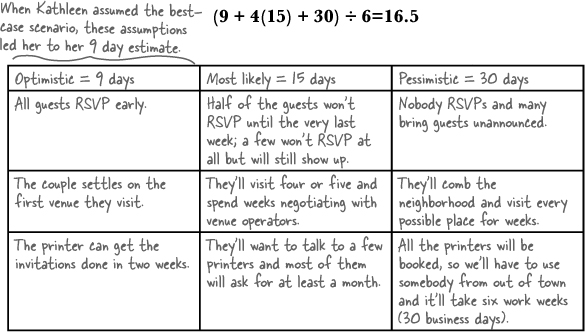
PERT (Program Evaluation Review Technique) is the most common form of three-point estimation. It’s a technique that was developed in the 1960s by consulting firms working with the U.S. government as a way of getting more accurate project duration predictions up front. To do a PERT estimate, you start with three estimates—pessimistic, most likely, and optimistic estimates. Since the pessimistic and optimistic estimates are less likely to happen than the normal estimate, the normal estimate is weighted (multiplied by 4) and added to the optimistic and pessimistic estimates, and then the whole thing is divided by 6 to give an expected duration. The formula looks like this:
Kathleen used a PERT estimate for the all of the wedding planning activities to make sure that she could get it all done in time for Rob and Rebecca’s big day. They only have six months until the wedding, so all of the planning needs to be done within the month to leave enough time to actually get everything done. She wrote down the assumptions she made for each estimate, coming up with all of the reasons she could think of that she took into account when coming up with her estimates.
Here are some examples of three-point estimates. Use the formula to figure out the expected time for each of these.
1. A software team gathered estimates for all of the work they’d have to do to build the next major release of their flagship product. Last time it took them around 45 days, but they’re hoping that the lessons learned from the past release could bring the time down to 30 days. However, the infrastructure team needs to upgrade their servers, and they are concerned that procurement delays could potentially extend the project out to 90 days.
Expected duration = __________ | Optimistic duration = __________ | Most Likely duration = __________ |
Pessimistic duration = __________ |
2. A construction team gathered estimates for all of the work they’d have to do to build a garage. In general, they can build a garage in 20 days, but rain or cooler temperatures could stretch the project out to 30 days. If, however, the forecast is correct, warm, sunny weather might bring the duration down to just 12 days.
Expected duration = __________ | Optimistic duration = __________ | Most Likely duration = __________ |
Pessimistic duration = __________ |
3. A project manager used data from past projects to come up with an estimate for an upcoming software system replacement project. She felt confident about a 25-day duration, but also noted that adding an extra resource could bring the schedule down to 10 days. The test team felt that the complexity of some completely new features would add additional test cases, adding a few weeks for a 40-day estimate.
Expected duration = __________ | Optimistic duration = __________ | Most Likely duration = __________ |
Pessimistic duration = __________ |
4. A project manager in charge of a big civil engineering project came up with an estimate for a highway re-paving project. The worst-case scenario was 82 days, but the team felt more certain based on past experience that they could get it done in 49 days. If all went well with their equipment and materials, it might be done in 33 days instead.
Expected duration = __________ | Optimistic duration = __________ | Most Likely duration = __________ |
Pessimistic duration = __________ |
Create the duration estimate
You’ve got a list of activities, you know what resources are needed to actually do each activity, and you’ve got your estimation tools and techniques...now you have enough to create the estimates! That’s the whole point of the Estimate Activity Durations process, and it’s also the main output.
Note
You don’t always know exactly how long an activity will take, so you might end up using a range (like 3 weeks +/- 2 days).
The activity duration estimates are estimates of how long each activity in the activity list will take. The estimate can be in hours, days, weeks...any work period is fine, and you’ll use different work periods for different jobs. A small job (like booking a DJ) may just take a few hours; a bigger job (like catering—including deciding on a menu, ordering ingredients, cooking food, and serving guests on the big day) could take days.
You’ll also learn more about the specific activities while you’re estimating them. That’s something that always happens—you have to really think through all of the aspects of a task in order to estimate it. So the other output of Estimate Activity Durations is updates to the project documents.
You may have guessed from the name that the activity duration estimates are always duration estimates, not effort estimates, so they show you calendar time and not just person-hours.
The activity duration estimate consists of estimates for each activity. It’s the main output of the Estimate Activity Durations process.

Back to the wedding
Kathleen’s really got a handle on how long things are going to take, but that’s not enough to get the job done. She’s still got some work to do before she’s got the whole project under control.


But what about the caterer? They have no idea who’s going to be providing the food.

And what about the band that they want? Will the timing with their schedule work out?
Bringing it all together
The Develop Schedule process is the core of Time Management. It’s the process where you put it all together—where you take everything you’ve done so far and combine it into one final schedule for the whole project. A lot of project managers consider this the most important part of their job. The schedule is your most important tool for managing a project.

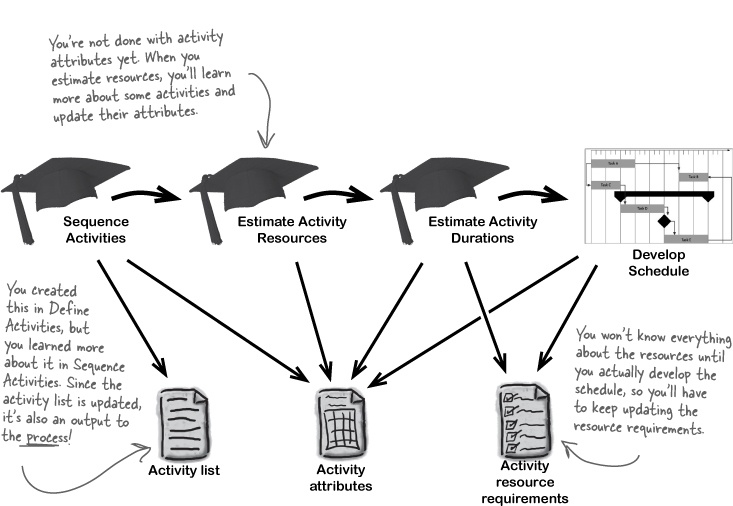
Develop Schedule brings everything you’ve done so far together into one final schedule. All of the outputs from the other Time Management processes are inputs to Develop Schedule.
Don’t worry, even though you’re done with the Estimate Activity Resources process, you’re not done with the resources.
You’re never going to have the complete resource picture until you’re done building the schedule. And the same goes for your activity list and duration estimates, too! It’s only when you lay out the schedule that you’ll figure out that some of your activities and durations didn’t quite work.
Note
That’s why the processes have the word “Estimating” in their names! Because you’re taking an educated guess, but you won’t know for sure until you’ve actually developed the schedule.
Each of the processes allows updates to an output from a previous one, so when you discover changes, you can include them in the schedule.
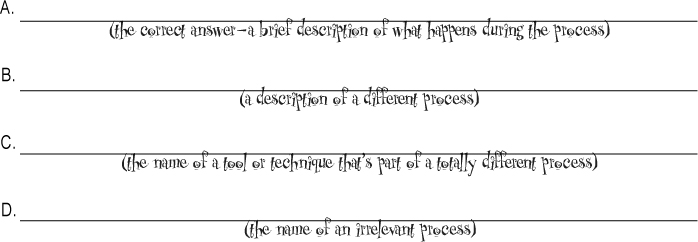
Fill in the blanks to come up with your own “which-comes-next” question! Start by thinking of a process to be the correct answer, and then figure out which process came right before it—that’s the one you’ll describe in the question!
You are managing a ![]() . You’ve finished creating the
. You’ve finished creating the ![]() , you’ve come up with
, you’ve come up with ![]() and you’ve just finished
and you’ve just finished ![]() . What’s the next thing you do?
. What’s the next thing you do?
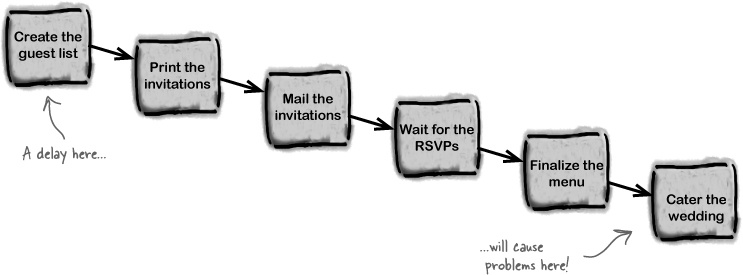
One thing leads to another
Rebecca: Well, let’s see. What menu did we give to the caterers?
Rob: We didn’t give it to them yet, because we won’t have the final menu until everyone RSVPs and lets us know which entrée they want.
Rebecca: But they can’t RSVP because we haven’t sent out the invitations! What’s holding that up?
Rob: We’re still waiting to get them back from the printer. We can’t send them out if we don’t have them yet!
Rebecca: Oh no! I still have to tell the printer what to print on the invitations, and what paper to use.
Rob: But you were waiting on that until we finished the guest list.
Rebecca: What a mess!
Use the critical path method to avoid big problems
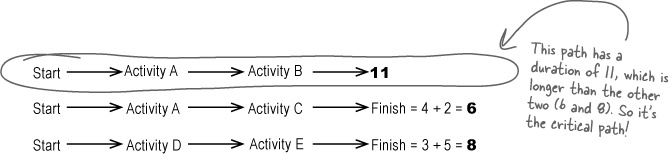
The critical path method is an important tool for keeping your projects on track. Every network diagram has something called the critical path. It’s the string of activities that, if you add up all of the durations, is longer than any other path through the network. It usually starts with the first activity in the network and usually ends with the last one.
The reason that the critical path is, well, critical, is that every single activity on the path must finish on time in order for the project to come in on time. A delay in any one of the critical path activities will cause the entire project to be delayed.
The critical path is the string of activities that will delay the whole project if any one of them is delayed.
How does knowing your critical path help?
Knowing where your critical path is can give you a lot of freedom. If you know an activity is not on the critical path, then you know a delay in that activity may not necessarily delay the project.
This can really help you handle emergency situations. Even better, it means that if you need to bring your project in earlier, you know that adding resources to the critical path will be much more effective than adding them elsewhere.
How to find the critical path
It’s easy to find the critical path in any project! With a little practice, you’ll get the hang of it. Of course, on a large project with dozens or hundreds of tasks, you’ll probably use software like Microsoft Project to find the critical path for you. But when it does, it’s following the same exact steps that you’ll follow here.
Start with an activity network diagram.
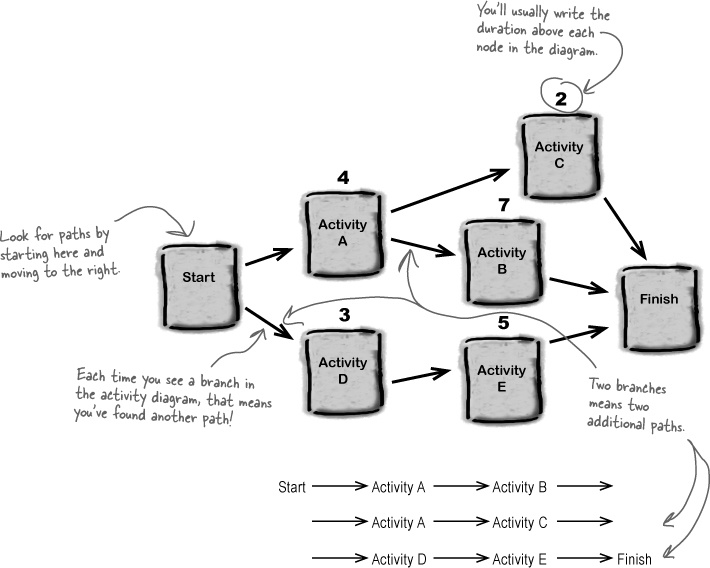
Find all of the paths in the diagram. A path is any string of activities that goes from the start of the project to the end.
Find the duration of each path by adding up the durations of each of the activities on the path.
The critical path is the one with the longest duration!
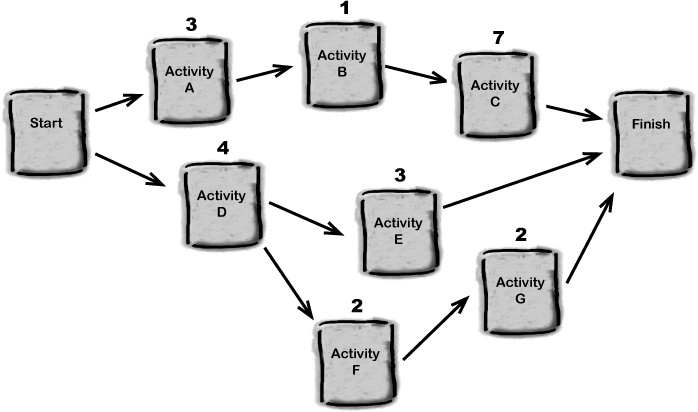
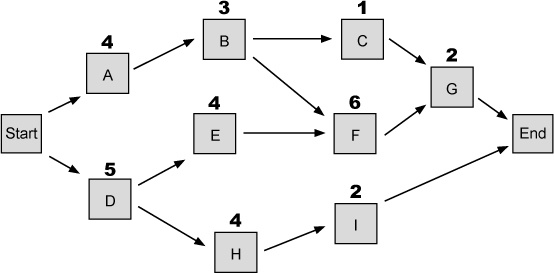
You may get questions on the exam asking you to identify the critical path in a network diagram. Here’s some practice for doing that! Find the critical path and duration for this PDM.
Critical Path ________________
Duration of Critical Path ________________
Total Number of Paths ________________

Critical Path _______________
Duration of Critical Path _______________
Total Number of Paths _______________
![]() Answers in Exercise Solution.
Answers in Exercise Solution.
Finding the float for any activity
Note
The goal is to find the float for each activity. We’re not really concerned with finding a total float for each path—we’re looking at the activities independently.
Once you’ve figured out the critical path, there’s all sorts of useful stuff you can do with it. One of the most useful things you can do is calculate the float. The float for any activity is the amount of time that it can slip before it causes your project to be delayed. You might also see the word slack—it’s the same thing.
Luckily, it’s not hard to figure out the float for any activity in a network diagram. First you write down the list of all of the paths in the diagram, and you identify the critical path. The float for every activity in the critical path is zero.
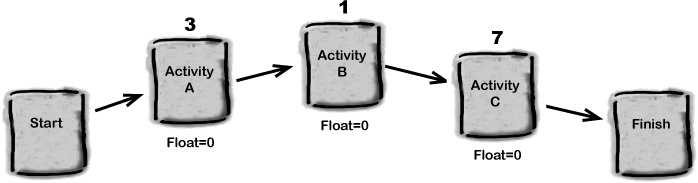
There are three paths in this network:
Start → A → B → C → Finish = 11
Start → D → E → Finish = 7
Start → D → F→ G → Finish = 8
The float for each of the activities on the critical path is zero.
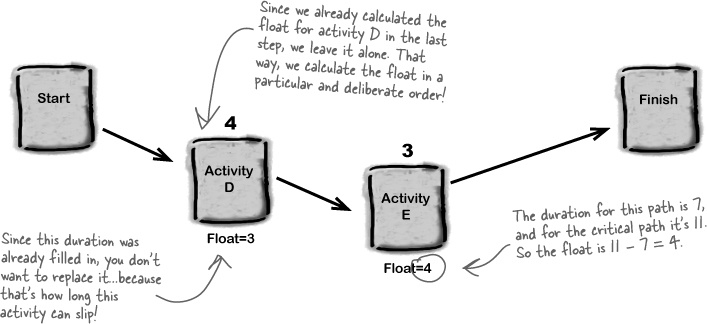
Find the next longest path. Subtract its duration from the duration of the critical path, and that’s the float for each activity on it.
You can use this method to find the float for every activity in a network diagram. Another word for float is slack.
Do the same for the next longest path, and so on through the rest of the network diagram. Pretty soon, you’ll fill in the float for every activity!

Float tells you how much extra time you have
Once you know the float, you know how much play you have in your schedule. If an activity has a float of 2 days, it can slip by that much without affecting the end date.
To find the float for an activity, figure out how much it can slip before it makes the project late. The float for any activity on the critical path is ZERO!
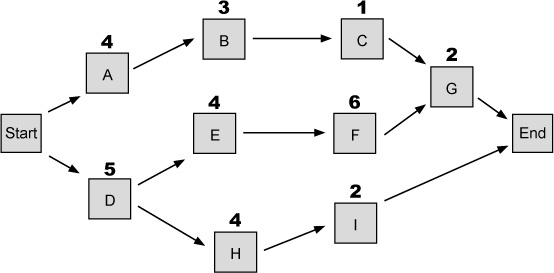
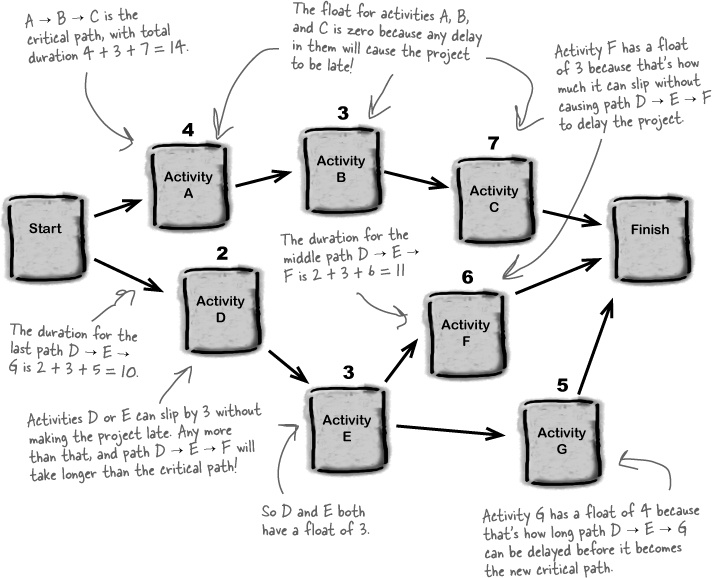
You’ll need to be able to calculate the float of an activity in a network diagram for the exam. Take another look at this PDM from the last exercise. Can you calculate the float for each activity?
What is the float for each activity on the critical path? ____
What is the total duration for path A → B → C → G? ____
What is the total duration for path A → B → F → G? ____
What is the total duration for path D → E → F → G? ____
What is the total duration for path D → H → I? ____
Which path is the critical path? ____ → ____ → ____ → ____
Write down the float for each activity:
A ____ B ____ C ____ D ____ E ____
F ____ G ____ H ____ I ____
![]() Answers in Exercise Solution.
Answers in Exercise Solution.
All of the processes in Time Management tie together! When you develop your schedule, you’re using the durations for your activities that you came up with in Estimate Activity Durations.
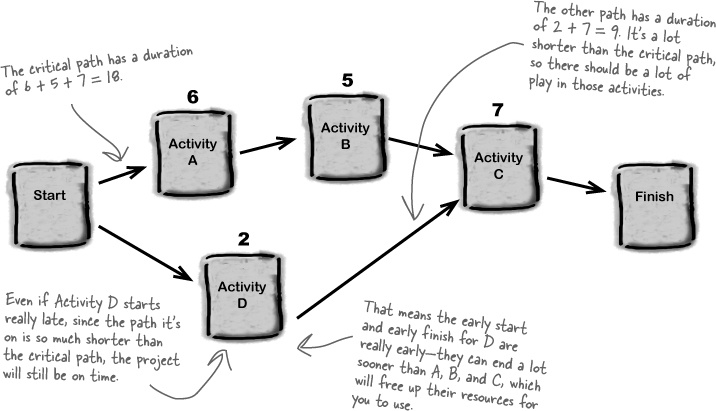
Figure out the early start and early finish
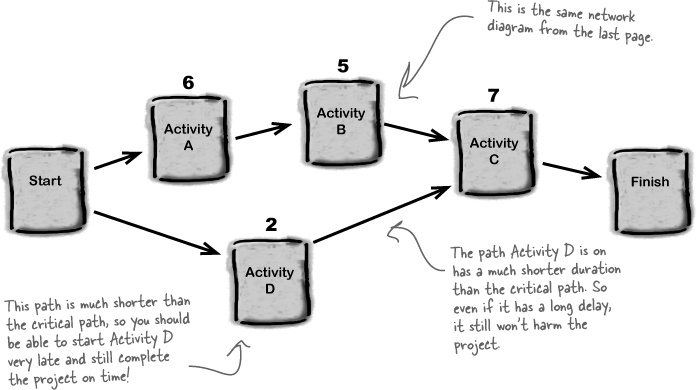
Coming up with the float for each activity is useful, but you can actually do better! When you have a long critical path, but the other paths in your network diagram are short, then you have a lot of freedom in when you can start and finish each of the activities that are not on the critical path. You can use early start and early finish to get a handle on exactly how much freedom you have in your schedule.
Early start
Is the earliest time that an activity can start. An activity near the end of the path will only start early if all of the previous activities in the path also started early. If one of the previous activities in the path slips, that will push it out.
Early finish
Is the earliest time that an activity can finish. It’s the date that an activity will finish if all of the previous activities started early and none of them slipped.
When you find the early start and early finish for each task, you know exactly how much freedom you have to move the start dates for those activities around without causing problems.
Figure out the latest possible start and finish
It’s also important to know how late any activity can run before it delays the project. That’s what late start and late finish are for! They let you figure out how late you can start a certain task and how much it can slip before it delays your project.
Late start
Is the latest time that an activity can start. If an activity is on a path that’s much shorter than the critical path, then it can start very late without delaying the project—but those delays will add up quickly if other activities on its path also slip!
Late finish
Is the latest time that an activity can finish. If an activity is on a short path and all of the other activities on that path start and finish early, then it can finish very late without causing the project to be late.
Figuring out the late start and late finish will help you see how much “play” you have in your schedule. An activity with a large late start or late finish means you have more options.
Add early and late durations to your diagrams
You can use a method called forward pass to add the early start and finish to each path in your network diagram. Once you’ve done that, you can use backward pass to add the late start and finish. It makes your network diagrams look a little more complicated, but it gives you a lot of valuable information.

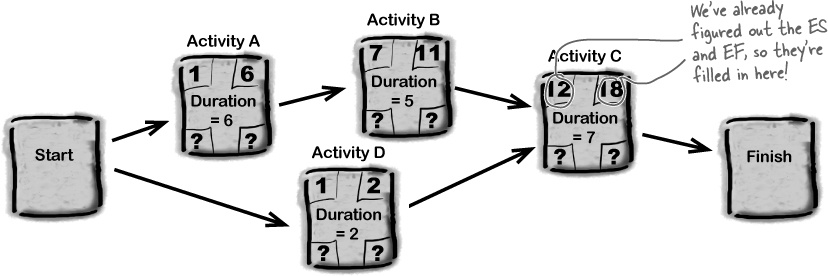
Take a forward pass through the network diagram.
Start at the beginning of the critical path and move forward through each activity. Follow these three steps to figure out the early start and early finish!
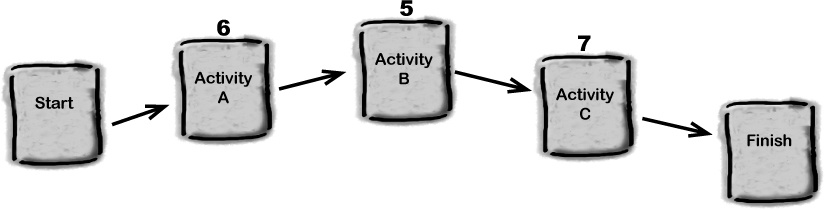
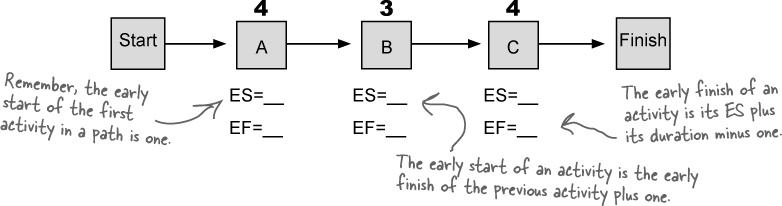
The ES (early start) of the first activity in the path is 1. The EF (early finish) of any task is its ES plus its duration minus one. So start with Activity A. It’s the first in the path, so ES = 1, and EF = 1 + 6 – 1 = 6.
Now move forward to the next activity in the path, which is Activity B in this diagram. To figure out ES, take the EF of the previous task and add one. So for Activity B, you can calculate ES = 6 + 1 = 7, and EF = 7 + 5 – 1 = 11.
Uh-oh! Activity C has two predecessors. Which one do you use to calculate EF? Since C can’t start until both B and D are done, use the one with the latest EF. That means you need to figure out the EF of Activity D (its ES is 1, so its EF is 1 + 2 – 1 = 2). Now you can move forward to Activity C and calculate its EF. The EF of Activity D is 2, which is smaller than B’s EF of 11, so for Activity C the ES = 11 + 1 = 12, and EF = 12 + 7 – 1 = 18.
Take a backward pass to find late start and finish
You can use a backward pass through the same network diagram to figure out the late finish and start for each activity.
The backward pass is just as easy as the forward pass. Start at the end of the path you just took a pass through and work your way backward to figure out the late start and finish.
Start with the critical path.
You’re calculating the latest any activity can start and finish, so it makes sense that you need to start at the end of the project and work backward—and the last activity on the critical path is always the last one in the project. Then do these three steps, working backward to the next-longest path, then the next-longest, and so on, until you’ve filled in the LS and LF for all of the activities. Fill in the LF and LS for the activities on each path, but don’t replace any LF or LS you’ve already calculated.
Start at the end of the path, with Activity C. The LF (late finish) of the last activity is the same as the EF. Calculate its LS (late start) by subtracting its duration from the LF and adding one. LS = 18 – 7 + 1 = 12.
Now move backward to the previous activity in the path—in this case, Activity B. Its LF is the LS of Activity C minus one, so LF = 12 – 1 = 11. Calculate its LS in the same way as step 1: LS = 11 – 5 + 1 = 7.
Now do the same for Activity A. LF is the LS for Activity B minus one, so LF = 7 – 1 = 6. And LS is LF minus duration plus one, so LF = 6 – 6 + 1 = 1.
Now you can move onto the next-longest path, Start-D-C-Finish. If there were more paths, you’d then move on to the next-longest one, and so on, filling in LF and LS for any nodes that haven’t already been filled in.

Let’s take some time out to walk through this!
All of this critical path stuff seems pretty serious, right? It’s one of the toughest concepts on the exam. But don’t sweat it, because it’s actually not hard! It just takes a little practice. Once you do it yourself, you’ll see that there’s really nothing to worry about.
Note
Calculating the ES, EF, LS, and LF may seem complicated, but it only takes a little practice to get the hang of it. Once you walk through it step by step, you’ll see that it’s actually pretty easy!
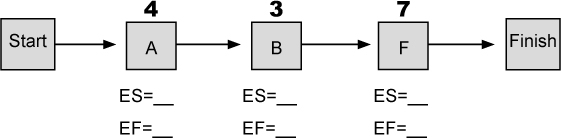
There are four paths in this network diagram. Fill in each of the activity names and durations for each of the paths.
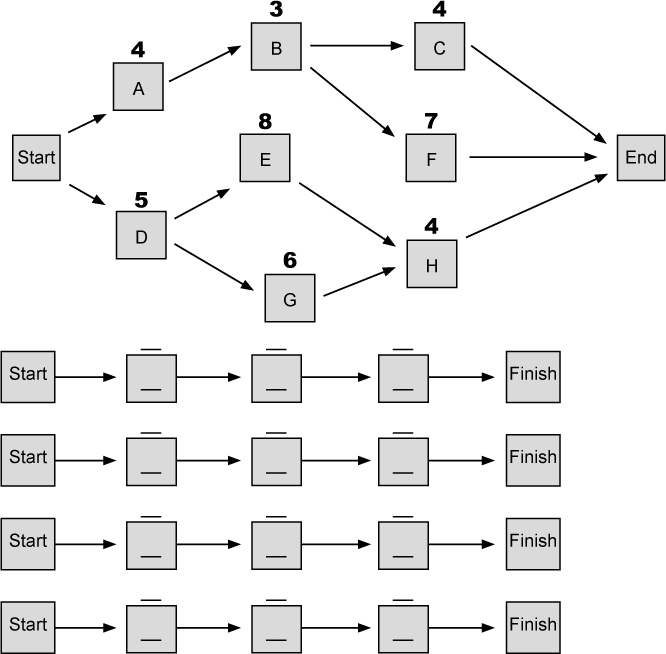
Put an asterisk (*) next to the critical path.
We’re not done yet! There’s more on the next page...
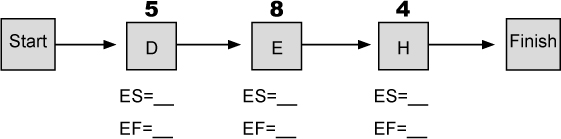
Take a forward pass through each of the four paths in the diagram and fill in the early starts and early finishes for each activity. Start with the first one.
Let’s move on to the second path.
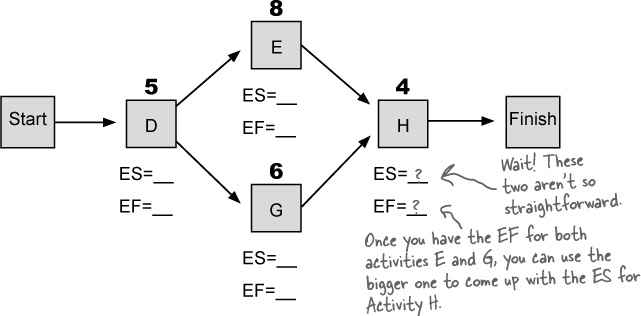
The next path isn’t as straightforward as it looks. Start by filling in its values.
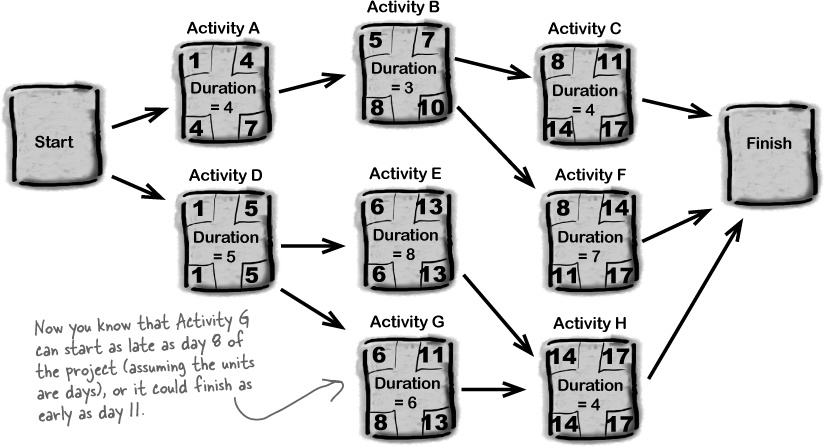
Now take another look at it, and how it mixes with the last path. It includes Activity H, which was also in the last path. H will have a different ES depending on which path you use! So which predecessor do you use: E or G? The idea here is that you use the predecessor with the larger EF value when you calculate the ES for activity H (because you want the latest possible start date).
You’ve calculated the ES for each activity. Use that information and take a backward pass through the paths, starting with the first two paths.
First start with the critical path. Take the EF of the last activity in the critical path and use it as the LF for the last activity in every path. If you take a minute to think about it, it makes sense to do that. The point of LF is to figure out the absolute latest that the activity can end without making the project late. And as long as every non-critical-path activity ends before the last activity in the critical path, then it won’t be late.
We’ll start by giving you the LF of critical path, Start-D-E-H-Finish, which is 17.
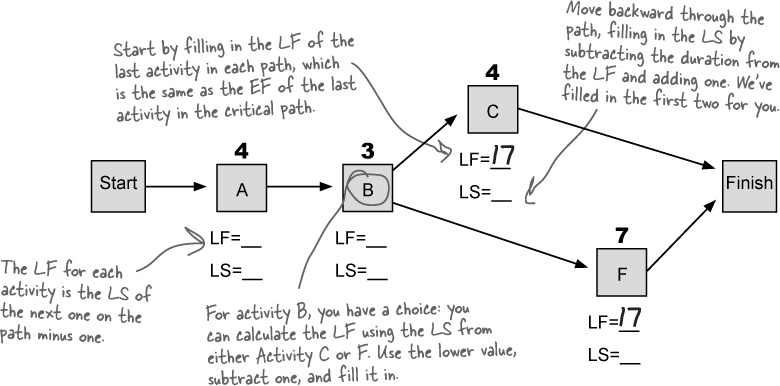
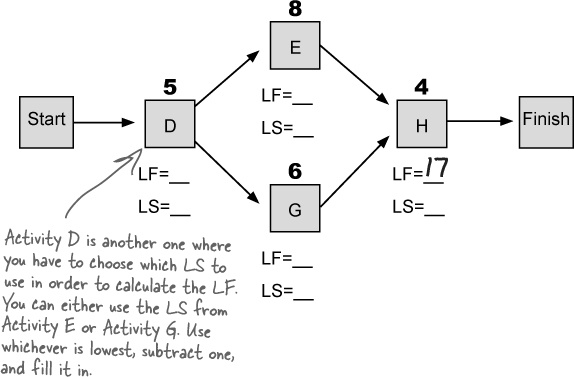
Finish up by calculating the LS and LF for the last two paths!
Activities B and D have two possible choices for which LS to use for the calculation. For Activity B, do you use the LS of C or the LS of F? And for Activity D, do you use Activity E or G? The answer is that you always use the lowest value of LS to calculate the LF. The reason is that you’re trying to find the latest possible start date that won’t make the project late. If you use an activity with a later LS, and the activity really is delayed by that much, then it’ll cause a delay in both following activities. And that will make the one with the lower LS start too late.
For the exam, you’ll only have to do one or two of these calculations, not a whole string of them like this. You’ll definitely be able to handle the exam questions now!

You won’t have to do this kind of thing on the job...that’s what computers are for!
Project management software like Microsoft Project will do these calculations for you. But you need to know how to do it yourself, because when the computer is doing critical path analysis, this is exactly how it figures it out!
Crash the schedule
There are two important schedule compression techniques that you can use to bring in your project’s milestone dates...but each has its own cost. When you absolutely have to meet the date and you are running behind, you can sometimes find ways to do activities more quickly by adding more resources to critical path tasks. That’s called crashing.


Crashing the schedule means adding resources or moving them around to shorten it. Crashing ALWAYS costs more and doesn’t always work!
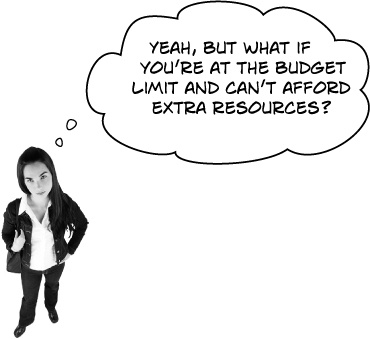
Then you can’t crash the schedule.
There’s no way to crash a schedule without raising the overall cost of the project. So, if the budget is fixed and you don’t have any extra money to spend, you can’t use this technique.
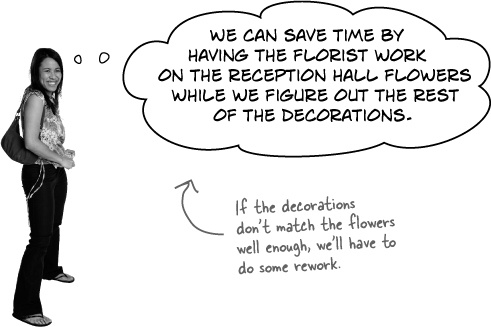
Fast-tracking the project
Another schedule compression technique is called fast-tracking. Sometimes you’ve got two activities planned to occur in sequence, but you can actually do them at the same time. On a software project, you might do both your UAT testing and your functional testing at the same time, for example. This is pretty risky, though. There’s a good chance you will need to redo some of the work you have done concurrently.
Note
On the exam, if you see something about “overlapping activities,” it’s talking about fast-tracking.
Crashing and fast-tracking are SCHEDULE COMPRESSION tools.
Each of these scenarios describes a schedule compression technique. Pick which are examples of fast-tracking and which are crashing.
Kathleen guesses that 70% of the invitees will RSVP. Instead of waiting for all of them to come in, she goes ahead and reserves the tables and chairs now.
Rebecca is taking a really long time to choose the decorations, so Kathleen brings in a professional decorator to help, even though it will cost more.
Kathleen needs to get the invitations out quickly, so she hires two temps to come in and help her stuff envelopes for a few days.
![]() Answers in Exercise Solution.
Answers in Exercise Solution.
Modeling techniques
It’s always a good idea to think about all of the things that could go wrong on your project in advance. Trying to think through all of the possible problens your project could run into is called what-if analysis.
What if the limo breaks down?
What if the florist cancels at the last minute?
What if the dress doesn’t fit?
What if the band gets sick?
What if the guests get food poisoning?
What if there’s a typo in the church address on the invitation?
What if the bridesmaids don’t show up?
What if the cake tastes horrible?
What if we lose the rings?

That way, you can figure out how to deal with any problems that might come your way. Sometimes there’s no way to still meet your dates and deal with these scenarios. But it always makes sense to try to understand the impact they will have on your schedule.
Simulation
This is a specific kind of what-if analysis where you model uncertainty using a computer. There are some packages that will help to calculate risk using random numbers and Monte Carlo analysis algorithms. While this is not a commonly used technique, there might be a question or two about it on the PMP exam, and you should know what it is.
Other Develop Schedule tools and techniques
There are just a few more tools and techniques in the Develop Schedule process that you should know.
Critical chain method
In this method, resource dependencies are used to determine the critical path. Then, you add buffers, working backward from the delivery date into the schedule at strategic points, and managing the project so that each milestone is hit on time.

Resource optimization techniques
Sometimes only one resource can do a given activity. If that resource is busy doing another activity on the critical path, the path itself needs to change to include that dependency. That’s the point of resource leveling. It evaluates all of the resources to see if the critical path needs to change to accommodate resource assignments.

Adjusting leads and lags
If you made any mistakes in your leads and your lags, you might be able to adjust them to change the projected end date.

Schedule compression and schedule network analysis
The last two tools and techniques in the Develop Schedule process are the ones you just learned over the last few pages: schedule compression and schedule network analysis using critical path, float, and the other schedule analysis techniques you just learned.

Outputs of Develop Schedule
Of course, the main product of Develop Schedule is the schedule. But there are a few other supporting documents that help you understand how the work will get done as well.
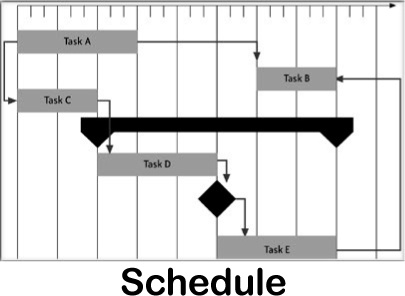
Project schedule
All of that analysis and modeling should produce a schedule that everyone can get behind. After thinking your way through everything that can go wrong and assigning resources, you should have a pretty accurate prediction of the work required to complete the project.
Milestone chart
Technically, the milestone chart is a part of the project schedule (so they’re really all part of the same output), but it’s very important. All of the major chunks of work can be marked with milestones to track their completion. Usually this list is published for other teams or stakeholders who are depending on parts of the work to be accomplished by a certain time.
Schedule data
The schedule data is a collection of information about your schedule. It will include things that you’ll need to analyze your schedule later on in the project: alternative schedules, specific requirements for resources, milestone charts, bar charts, project schedule network diagrams, and other data and metrics about your schedule.

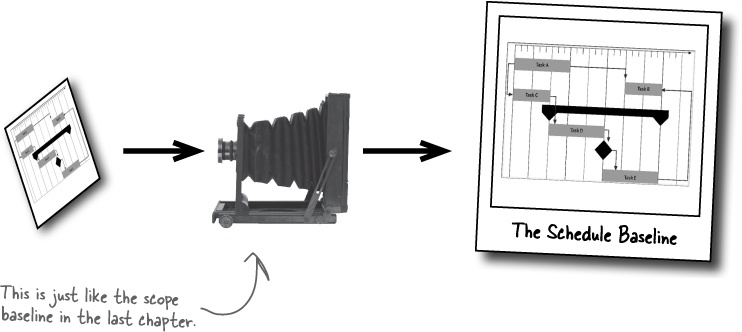
Schedule baseline
When the Develop Schedule process is complete, a baseline is created so that actual progress can be compared to the plan.
Project calendars
Calendars will help you keep track of the time when team members will be away on vacation or unavailable to work on your project.
Project Management plan updates
Since the schedule baseline and Schedule Management plan are both part of the Project Management plan, it makes sense that it would have to be updated.

Project documents updates
While you’re creating the schedule, you might find that you need to update calendars, your resource requirements, the attributes of the activities themselves, or even your risk register, to name a few possibilities.

Updates refine the outputs of previous processes so you don’t have to go back and redo them.
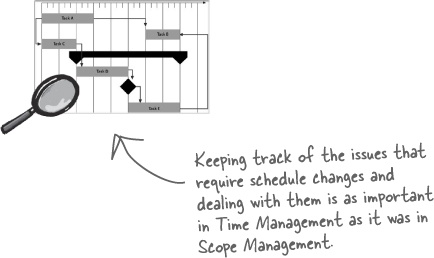
Influence the factors that cause change
Kathleen doesn’t just sit around and wait for schedule changes to happen...

Joe (on phone): Good afternoon, Joe’s Catering. Joe speaking. How can I help you?
Kathleen: Hello, Joe. This is Kathleen calling about Rob and Rebecca’s wedding.
Joe: Oh, hi! Everything’s going fine with that wedding.
Kathleen: Are you sure? What about that big convention across town that’s going to be happening at the same time? Won’t it be tough to find waiters in June?
Note
By realizing that the convention across town will need waiters, too, Kathleen prevents a lot of changes before they cause schedule problems!
Joe: I didn’t think of that; we’d better start figuring out how we’ll handle it now.
The project manager doesn’t just wait for change to happen! She finds the things that cause change and influences them.
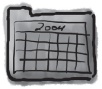
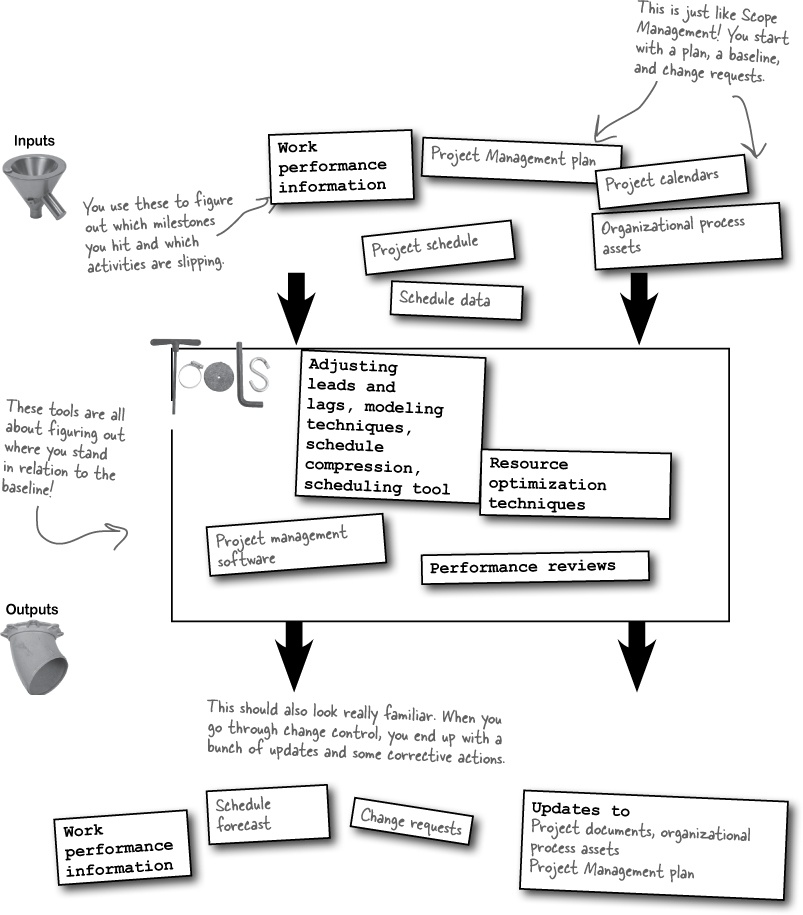
Control Schedule inputs and outputs
As the project work is happening, you can always discover new information that makes you re-evaluate your plan, and use the Control Schedule process to make the changes. The inputs to Control Schedule cover the various ways you can discover that information. The outputs are the changes themselves.
What Control Schedule updates
All of the stuff you made during the Develop Schedule process gets updated using the Control Schedule process. Here’s a closer look at what those updates mean.
Whenever a change is approved to your schedule, the baseline needs to be updated. That way, you will always be comparing your results to the right plan.

As you make changes to your project schedule, you should be tracking your lessons learned so that other projects can benefit from your experience. Sometimes you might find changes to templates that will help future projects, too.
If the work you need to do changes, then you need to update your activity list and attributes to match the new information.
Some scenarios for what might go wrong on your project might show up when you are already doing the work. You need to update your schedule accordingly.

It could happen that the way you manage Control Schedule needs to change, and those changes would need to be updated in the Project Management plan.
Managing schedule change means keeping all of your schedule documents up to date.
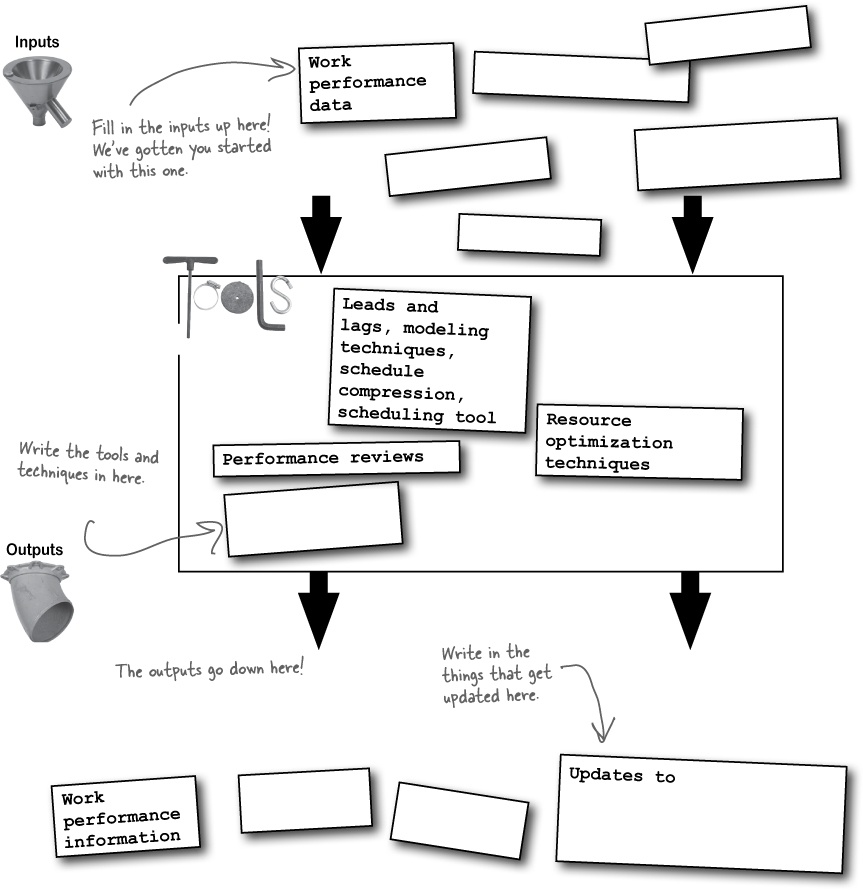
Measuring and reporting performance
Most often, you identify changes by looking at performance data. It’s just as important once you make a change to gather performance data as it was when you found the change in the first place. Here’s how performance data feeds into the Control Schedule process.
The Control Schedule process turns Work Performance Data into Work Performance Information.

Control Schedule tools and techniques
The tools and techniques for Control Schedule are all about figuring out where your project schedule stands. By comparing your actual project to the schedule you laid out in the baseline and looking at how people are performing, you can figure out how to handle every schedule change.
Performance reviews
There are two important calculations called schedule variance (SV) and schedule performance index (SPI) that give you valuable information about how your project is doing. You’ll learn all about them in the next chapter.
Leads and lags, modeling techniques, schedule compression, scheduling tool
Most of the tools from the last process apply to this one too. As you find variances in the schedule, you need to figure out the impact of those issues and change your schedule to account for the new information.
Project management software
This is software like Microsoft Project that helps you organize and analyze all of the information you need to evaluate the schedule of any project.
Resource optimization techniques
As things change in your project, you need to make sure that resources are covering all of the activities in your plan. That means you need to distribute resources so that the work that needs to get done always has a resource available to do it.

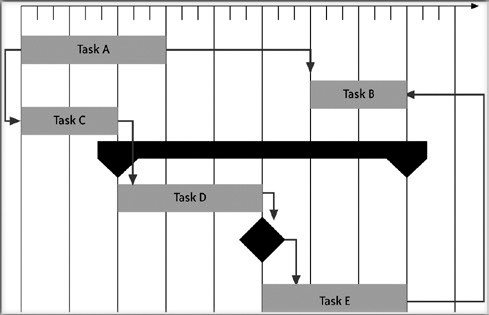
Remember, Gantt charts—the bar charts you make with MS Project—are just one tool for scheduling. You may use them a lot in your day-to-day work, but they’re only one piece of Time Management. And remember, on the exam they’re called bar charts, not Gantt charts!
Any time you generate data about your project, you should add it to your organizational process assets so you can use it for future projects.
You’ll see change control over and over again—every single knowledge area has its own change control process! Luckily, you’ll start to see how similar they all are. But Control Schedule has its own quirks, and they’re important for understanding Time Management.
![]() Answers in Control Schedule Magnets Answers.
Answers in Control Schedule Magnets Answers.
Take some time to sit back and give your right brain something to do. It's your standard crossword; all of the solution words are from this chapter.
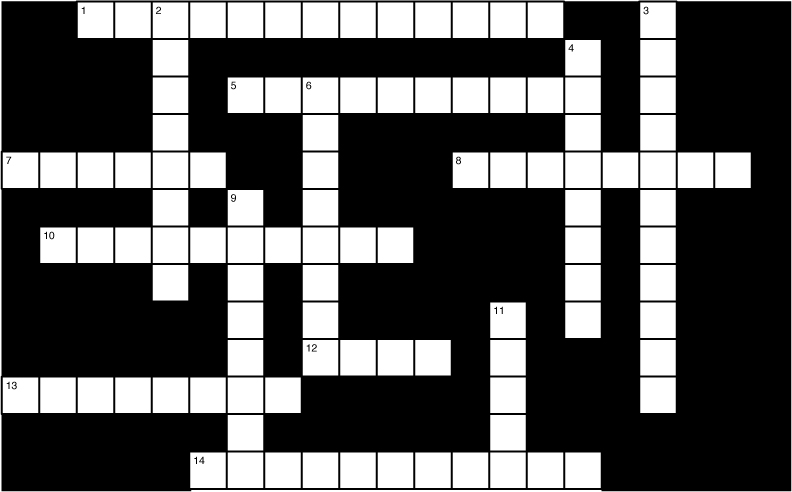
Across | Down |
1. Taking work packages from the WBS and breaking them down into activities. 5. The “P” in PDM. 7. The kind of analysis where you ask a lot of questions about possibilities. 8. A snapshot of the schedule that you can use for later comparison. 10. __________ estimation means plugging data about your project into a database of historical information to get an estimate of how long it will take to do the work. 12. Giving a successor task some time to start before a predecessor finishes. 13. Adding more resources to a project so you can get it done faster is called _______ the schedule. 14. A PERT three-point estimate is optimistic time + 4 x most likely time + _______ time and divided by 6. | 2. Any delay in an activity on the _______ path will delay the entire project. 3. You do this sort of planning when you get more information as the project progresses. 4. What you’re doing to resources when you evaluate all of them to see if the critical path needs to change to accommodate their restrictions. 6. An activity with a dependency on something outside the project has an _________ predecessor. 9. ________ Activities is the process where you put the activities in order. 11. How long an activity can slip before the whole project is delayed. |
![]() Answers in Timecross solution
Answers in Timecross solution
Another satisfied customer!
Rob and Rebecca had a beautiful wedding! Everything was perfect. The guests were served their meals, the band was just right, and everyone had a blast...

...and Kathleen got lots of referrals!

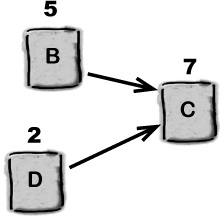
You may get questions on the exam asking you to identify the critical path in a network diagram. You had to practice that by finding the critical path and duration for this PDM.
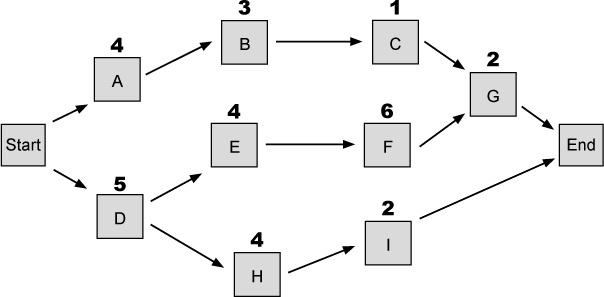
Critical Path Start-D-E-F-G-End
Duration of Critical Path _______________17_________
Total Number of Paths _______________3_________

Critical Path Start-E-B-D-End
Duration of Critical Path _______________14_________
Total Number of Paths _______________4_________
Each of these scenarios describes a schedule compression technique. Pick which are examples of fast-tracking and which are crashing.
Kathleen guesses that 70% of the invitees will RSVP. Instead of waiting for all of them to come in, she goes ahead and reserves the tables and chairs now.
Rebecca is taking a really long time to choose the decorations, so Kathleen brings in a professional decorator to help, even though it will cost more.
Kathleen needs to get the invitations out quickly, so she hires two temps to come in and help her stuff envelopes for a few days.
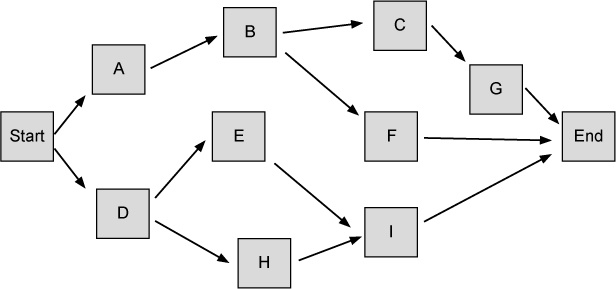
You’ll need to know how to turn a table of nodes into a network diagram, so here’s your chance to get some practice! Here’s a list of nodes for a PDM network diagram. Try drawing the diagram based on it:
Name | Predecessor |
Start | — |
A | Start |
B | A |
C | B |
D | Start |
E | D |
F | B |
G | C |
H | D |
I | E, H |
Finish | F, G, I |
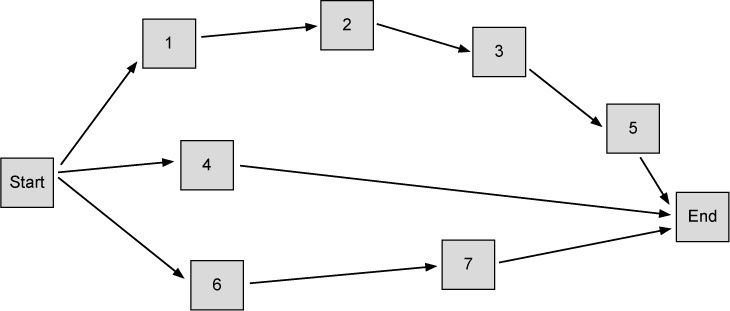
Now try another one!
Name | Predecessor |
Start | — |
1 | Start |
2 | 1 |
3 | 2 |
4 | Start |
5 | 3 |
6 | Start |
7 | 6 |
Finish | 7, 4, 5 |
You’ll see change control over and over again—every single knowledge area has its own change control process! Luckily, you’ll start to see how similar they all are. But Control Schedule has its own quirks, and they’re important for understanding Time Management.


You’re likely to get some questions that ask you about crashing and fast-tracking, and it’s important to know the difference between them. When you crash the project, it means that you add resources to it, especially to the critical path. There’s no real risk in doing that—in the worst-case scenario, the extra people just sit around!—but it does cost more. Fast-tracking means adjusting the schedule so that activities overlap. The same resources are doing the work, so it’s not going to cost more, but it’s definitely riskier, because now you’ve eliminated buffers and possibly broken some dependencies! And remember that crashing or fast-tracking won’t always work to make the project go faster!
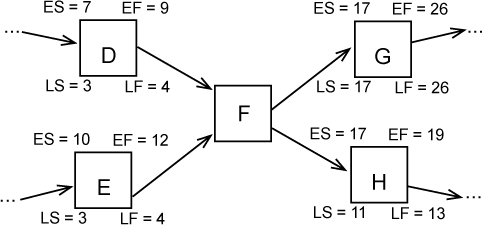
2. Answer: D
Calculating the early start (ES) of an activity isn’t hard. All you need to do is look at the early finish (EF) of the previous activity and add one. If there’s more than one predecessor, then you take the largest EF and add one. In this case, the predecessors to activity F are D, with an EF of 9, and E, with an EF of 12. So the ES of F is 12 + 1 = 13.
3. Answer: A
It’s just as easy to calculate the late finish (LF). Look at the following activity, take its LS (late start), and subtract one. If there’s more than one following activity, use the one with the lowest LS. So, for activity F in the question, the following activities are G, with an LS of 17, and H, with an LS of 11. So the LF of F is 11 – 1 = 10.
4. Answer: C
Don’t let the jargon fool you! You don’t need to know anything about software testing to answer this question. When you have two activities, and the first activity has to be timed so that it finishes before the second one starts, then you’ve got a Finish-to-Start relationship, or FS.
5. Answer: B
Note
Did answer A trick you? No need for rolling wave planning when you’ve got enough info to define all the activities!
This is a which-is-next question that describes a project that’s completed the Define Activities, Sequence Activities, Estimate Activity Resources, and Estimate Activity Durations processes. The next process in Time Management is Develop Schedule, which means that the next thing you do is create the schedule!
6. Answer: D
The schedule baseline is an output of the Develop Schedule process, not an input. You should definitely know what goes into the schedule baseline: it’s a specific version of the schedule that you set aside and use for comparison later on, when you want to know if the project is running late.
7. Answer: A
You always want to be honest with your estimates. Every project has unknowns and risks, and there’s no way to estimate any activity exactly! Luckily, we have tools to deal with this. You can use reserve analysis, a tool of Estimate Activity Durations, to come up with a contingency reserve that you can use to plan for these risks.
8. Answer: B
The critical chain method is a technique that’s part of Develop Schedule that lets you figure out how to handle the problems that come with having limited resources. You use it to shuffle both activities and resources on your critical path. One important aspect of the critical chain method is that you can use it to add buffers to the schedule to reduce the risk of certain activities.
9. Answer: A
When you draw out a network diagram for the activities in the table, you end up with four paths. And you definitely should draw out the activity diagram for a question like this! You’re allowed to use scratch paper on the exam, and this is one place where you should definitely do it. Of the four paths, only one has the longest duration: Start-A-B-C-Finish, which has a duration of 6 + 4 + 8 = 18. That’s the critical path.
Activity F is in the path Start-A-D-E-F-Finish. This path has a duration of 6 + 1 + 1 + 2 = 10. The float of an activity is the longest time it can slip before it affects the critical path. In this case, activity F can slip by 8 without causing the path that it’s on to go beyond the critical path. But any more than that, and its path becomes the new critical path!
Note
Did you notice answer A? Don’t forget that the float of any activity in the critical path is zero!
11. Answer: C
This is the definition of fast-tracking, and you’re probably getting the hang of this one by now. You may get a question like this, but you’ll almost certainly see fast-tracking as an incorrect answer to several questions!
12. Answer: A
Remember that when you see slack, it’s the same thing as float. Either term could appear on the exam!
13. Answer: B
This question is asking about the Estimate Activity Durations process. Take a look at the answers—there’s only one answer that’s used in that process: you need to start with the activity list in order to do the estimates for the activities! The other answers are things that are inputs, tools, or techniques for other processes.
Note
When a question asks what you’d use for a process, it’s asking you to pick an input, tool, or technique that’s part of the process.
14. Answer: C
It’s not hard to remember the order in which the Time Management processes are performed. If you use a little common sense, you can reason your way through a question like this. You need to define your activities before you can sequence them, you need to know who’s going to be doing an activity before you can estimate how long it’s going to take, and you need to do all of that before you can build a schedule!
Note
Control Schedule isn’t included in the list of processes because if a schedule change happens, you’ll have to go back and revisit the other Time Management processes. So it doesn’t have a specific order!
15. Answer: A
You’ll have to know the different kinds of estimating techniques for the exam. You don’t necessarily have to be good at doing them, but you should recognize which are which. Parametric estimating is when you plug values into a formula, program, or spreadsheet and get an estimate. Analogous estimating uses similar activities from past projects to calculate new estimates. Three-point estimating uses an optimistic, pessimistic, and realistic estimate.
16. Answer: C
This question is asking you to apply the PERT three-point estimation formula: (optimistic time + 4 × most likely time + pessimistic time) ÷ 6. When a question gives you these values directly, it’s easy. But in this case, to answer the question you had to figure out the values for the optimistic time and pessimistic time, which meant that you needed to look at the assumptions that the team was making. The most likely time was given: 27 weeks. The best-case scenario would come in two weeks earlier, at 25 weeks, and the worst case would come in five weeks late, at 32 weeks. So the estimate is (25 weeks + 4 x (27 weeks) + 32 weeks) ÷ 6 = 27.5 weeks.
Note
Sometimes you’ll get a question about applying a formula, but you’ll need to read the text in the question to figure out all of the variables.
17. Answer: C
The path Start-E-D-C-End has a duration of 8 + 2 + 4 = 14, which is the longest total duration in the entire network.
18. Answer: B
Activity A is on three different paths: Start-A-B-C-End (13), Start-A-D-C-End (12), and Start-A-D-G-End (9). To calculate its float, you take the longest path’s length and subtract it from the length of the critical path: 14 – 13 = 1.
19. Answer: A
Since activity E is on the critical path, its float is zero, because the float of any activity on the critical path is zero.
Note
Can you think of how a question might quiz you on this information without actually asking you to look at a network diagram?
20. Answer: A
The Schedule Management plan tells you how changes to the schedule are to be handled. Any time there’s a change, the first thing you should do is consult the plan to see how it should be handled.
21. Answer: A
The organizational process assets contain historical information about past projects. When you write up your lessons learned, or create work performance information, you store it in your company’s organizational process asset library! Also, did you notice that answer B was the wrong definition of parametric estimation?
22. Answer: D
Crashing the schedule is the form of schedule compression that increases cost. This is a difficult question because all of the answers sound good, and one or two are a little misleading! Don’t fall into the trap of choosing an answer because you recognize a valid tool or technique in it. Reserve analysis and three-point estimates are very useful techniques, but they’re not the answer to this question.
23. Answer: B
The critical path is the path in the network diagram where any delay will cause a delay in the schedule. These are the activities that cannot slip without making the project late!
24. Answer: C
This question was really about the definition of duration, and the key to answering it is to understand how duration is different from effort. The correct answer talks about “calendar time,” which is what a duration is: it’s a measurement (or estimate) of how long the activity will take in real life, taking into account the number of people who will be doing the work, the availability of the people and other resources, everyone’s vacation time, time taken away from the schedule because people are pulled off of the activity to work on higher-priority activities, and other real-world factors. That’s different from effort (which is often measured in person-hours), and it’s different from resource estimating (which involves estimating how many people and what other resources will be used for the activity).