8  Testing Decisions and Options with Scenarios
Decision making is an important outcome of scenario planning (Schoemaker, 1993, 1995). While there is substantial research evidence, the advice on specific practices to guide decision making with scenario planning is lacking. One of the most powerful ways to use scenarios is for testing specific decisions. Scenarios are used as wind tunnels to understand the potential risks and benefits associated with possible options.
This more specific and useful way to use scenarios is based on having a defined decision with a set of options. For example, beginning with a decision to expand market share in California, related options could be to buy a firm, open an office, and strategically hire people in California with existing networks. These cases require a decision focus—scenarios are constructed with a decision in mind, though always with the external environment as the context (Chermack, 2004; Greiner et al., 2014; Wollenberg et al., 2000). Good scenarios should create insights that add to the list of options as new ideas are gained through studying multiple futures, but it does not always have to work that way. To get the most out of this approach, participants need to have the appropriate level of knowledge to assess the options. When they do, the outcome is an expert group analysis leading to preferred options within and across the scenarios.
This chapter describes how to use scenarios to test a decision and the related set of options. Because this is a more detailed and specific way to use scenarios, there are some requirements. First, the decision has to be defined: Acquire a firm? Expand into a new market? Reduce the product line? Second, the available options have to be clarified. These should be relatively detailed and action oriented. The main focus of the work is then to assess the potential risk and potential benefit of each option, in each scenario.
Generally, this approach uses yet another matrix. If risk is plotted on the vertical axis (the x axis) and benefit is plotted on the horizontal axis (the y axis), another matrix is apparent. Figure 8.1 shows the idea.
Building from this figure, it should be obvious that items falling into the “high benefit / low risk” category should be reserved for further examination. Likewise, items falling into the “low benefit / high risk” category should be considered as potential nonstrategies—strategy is also about what not to do. The “high benefit / high risk” items (upper right) are big-bet decisions. The concept is relatively straightforward. This approach requires a specific focus from the start and is recommended when there is a clearly defined decision with associated options. It is best demonstrated with examples.

Figure 8.1. Generic Risk/Benefit Plotting
Example: Environmental Firm
An environmental firm (working mostly with municipalities on issues related to water and wastewater management) was looking to expand its presence and market share in California. The key focusing question for scenario building was, How could the California water/wastewater market evolve and change over the next five years? A series of workshops led to the development of four scenarios for the California water market. The resulting scenario matrix is in figure 8.2.

Figure 8.2. Environmental Firm’s Scenario Matrix
Environmental Firm’s Decision and Options
Once the scenarios were developed, the next step was to generate a set of potential options according to the decision focus. The decision focus was, How can we expand our California market share? Again, the intent was to expand market share in California, so the options were brainstormed. Of course, leaders already had particular options in mind, yet the goal was to generate a full list. After several meetings with team leaders, a final list of expansion options was determined:
1. Acquire regional firm
2. National partner in Los Angeles
3. Local partner in Los Angeles
4. Open office in Los Angeles
5. Open office in San Francisco
6. National partner in San Francisco
7. Local partner in San Francisco
8. Open office in Sacramento
9. Open office in San Jose
10. Integrated Project Delivery (IPD) partnerships
11. Client: California Water Service
12. Client: Great Oaks
13. Client: San Jose Water Co.
14. Client: Twin Valley
15. Client: Sierra City
16. Client: Lewis Small Water Co.
Once the options were identified (and several additional options came from reviewing the scenarios), the next step was to consider the potential outcome of each option in the context of each scenario. This is a more detailed version of the windtunneling activities described in the previous chapters.
A workshop was organized with a small team from Environmental Firm’s leadership, and the goal was to evaluate the potential risk and benefit of each option in each scenario. Figure 8.3 shows the ranking sheet template that was distributed to each participant.

Figure 8.3. Potential Risk/Benefit Ranking Sheet
Participants were asked to read the Cadillac scenario and individually complete their own assessment of the potential risk and benefit for each option. Once participants completed their assessments, they discussed what they saw as the major areas of risk and benefit. Which options were the highest risk and why? Which options were the lowest risk and why? The conversation and debate allow for further dialogue, much like what happens in the scenario building process with the various sticky note ranking exercises.
Risk and Benefit Rankings of Environmental Firm’s Options
Figures 8.4–8.8 show Environmental Firm’s options ranked according to risk and benefit in each of the four scenarios that were developed.

Figure 8.4. Environmental Firm’s Potential Risk/Benefit Plot for the Cadillac Scenario

Figure 8.5. Environmental Firm’s Potential Risk/Benefit Plot for the Lexus Scenario
You can see there are several good options under the dynamics of the Cadillac scenario (high benefit, low risk). Among these is attempting to win several specific clients (e.g., Lewis Small Co., San Jose Water Co., and Great Oaks). There is also the option of opening an office in San Francisco. Again, the point is not to blindly follow the options that appear in the high benefit, low risk category; it is to identify what smaller set of options might be better under the Cadillac conditions.
Under the dynamics of the Lexus scenario, several of the same options appear to be useful (open an office in San Francisco; try to win contracts with Great Oaks, Twin Valley, and San Jose Water Co.). The plot has shifted somewhat, and the goal is to sift through the options, where they land on the plot, and consider which might require further research and analysis.
For the Tesla scenario, the options have shifted considerably. Far fewer really useful options are available in the Tesla scenario because it was a much more challenging scenario. Still, winning new clients seems to be the best of what is available.

Figure 8.6. Environmental Firm’s Potential Risk/Benefit Plot for the Tesla Scenario
For the conditions presented in the Ford F-150 scenario, there are again many helpful options; and again, they seem to converge around new clients. Overall, there is slightly more risk across the board in this scenario, yet the goal is the same: find the best options that might be studied more closely.
Finally, across the set of scenarios there are useful options that appear most resilient regardless of the scenario dynamics. Once again, new client work appears to be the best overall strategy for Environmental Firm. On review of these options, Environmental Firm executives identified the following options flagged for deeper study:
• New client: Lewis Small Water Co.
• New client: Great Oaks
• New client: Twin Valley
• New client: San Jose Water Co.

Figure 8.7. Environmental Firm’s Potential Risk/Benefit Plot for the Ford F-150 Scenario
After reviewing the results, the executive team decided that the best overall strategy for expanding market share in California was to base it on developing new clients. As a result of this exercise (and the preparation that went into it), several clients were identified, which gave the executive team a place to start. The next steps were to understand which consultants in the organization might have contacts in the target client companies.
Workshop Outcomes
The potential risk/benefit ranking exercise focuses on the lower-right quadrant of the space. Items ranked “high benefit / low risk” are the target. It is not always easy to interpret the five plots that are generated through this activity, and thoughtfulness is important. It is not suggested that anything appearing in the lower-right quadrant simply be blindly followed, yet these options warrant further investigation. The assumption underlying this approach is that the participants involved in the ranking have deep insight into the context and decision being considered. If that is the case, you will come away with a group of experts thinking on the decision and relevant options being considered. At the conclusion of this exercise, options were identified for deeper analysis. In addition, some options were removed as they consistently appeared in the “high risk / low benefit” category.

Figure 8.8. Environmental Firm’s Potential Risk/Benefit Plot—All Scenarios
Example: Oil & Gas Company
The Geology and Exploration Division of Oil & Gas Company, which has operations in Venezuela, discovered new reserves in the ground. The key question was, How do we finance the extraction of these resources? Scenarios were developed based on the sociopolitical context of the country, access to land, disruption of remote towns, and extraction logistics, among other uncertainties.

Figure 8.9. Scenario Matrix for Oil & Gas Company
Using the 2 × 2 matrix approach, four scenarios were constructed (figure 8.9). These scenarios were framed on the valuation of resources in the ground and the sociopolitical environment. Once the scenarios were complete, attention turned toward a key decision.
Based on the scenario matrix, the four written scenarios were developed through intensive additional research, earlier participant interviews, and insights gained from the various workshops. Further work with the leadership team yielded a focused decision and options. Framed around the key decision of how to finance the massive project of extracting these new resources, several possible financing options were generated (figure 8.10).
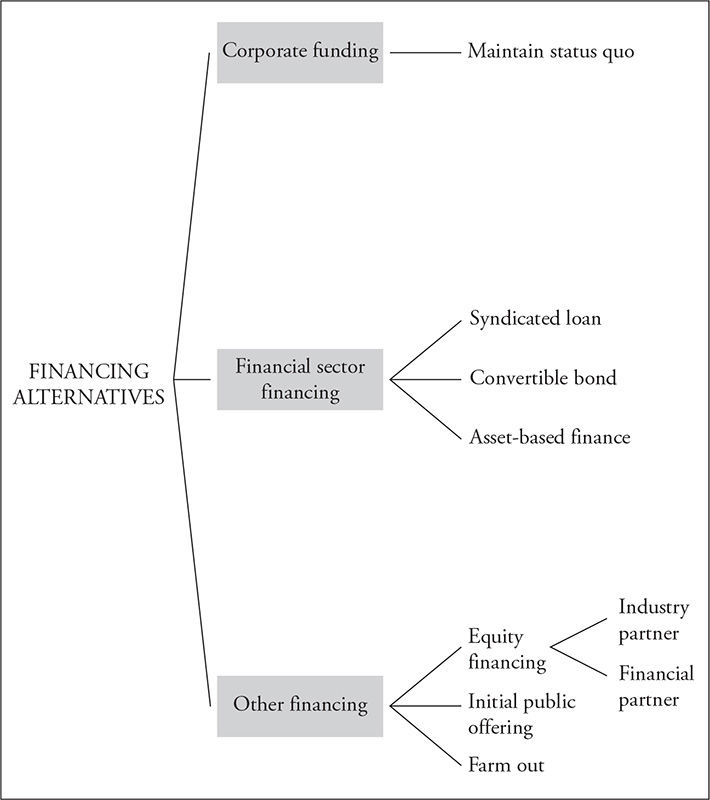
Figure 8.10. Financing Options for Oil & Gas Company
Several options emerged from the scenario exercise as insights were gained. For example, the idea of an initial public offering (IPO) came directly from workshop conversations on reviewing the scenarios. The next step was to design a workshop to consider each financing option in each scenario and to determine a set of optimal options that “worked” across the whole set of scenarios. Participants were asked to review the Mule scenario and complete a worksheet listing the financing options with potential risk and potential benefit rankings for each option. The ranking scale was 1–10 for both potential risk and potential benefit. To be clear, this was not a prioritizing activity: a ranking of 10 on risk could be used numerous times, and it was entirely acceptable for a given option to receive a ranking of 10 on both potential risk and potential benefit.

Figure 8.11. Oil & Gas Company’s Potential Risk/Benefit Plot for the Mule Scenario
Participants completed the activity individually (in real time), and afterward a group conversation and reflection was facilitated. Participants engaged in dialogue around what they saw as particularly high risk / high benefit, what stood out, and what did not. After 30 minutes of group conversation, participants could change and finalize their rankings based on any insights or points of view that may have shifted their perceptions during the conversation. The facilitator collected their ranking worksheets, and the process was repeated for the Eagle, Salmon, and Porcupine scenarios. Once the workshop was complete, data were compiled and plotted on a potential risk/benefit matrix. Figures 8.11–8.15 show the outputs.
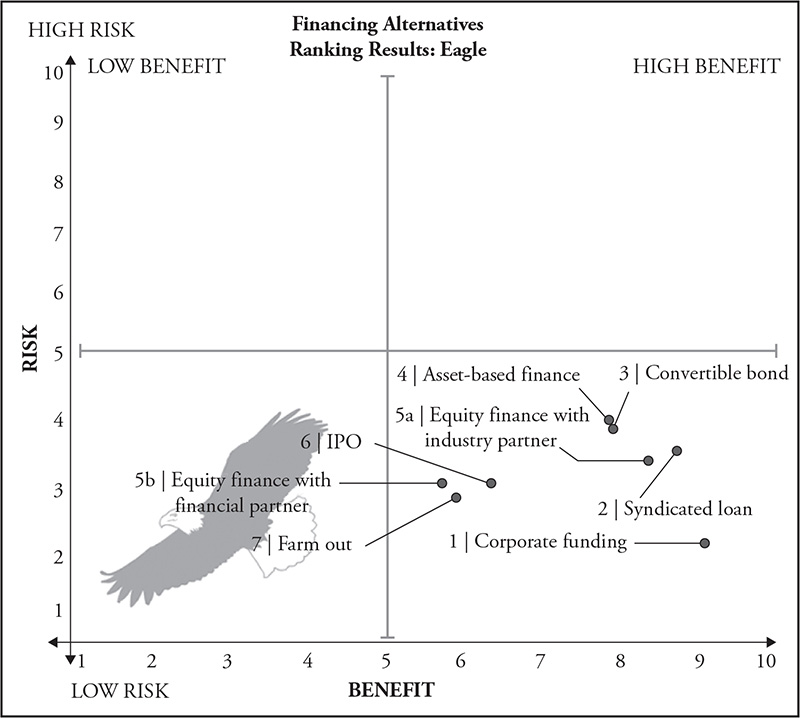
Figure 8.12. Oil & Gas Company’s Potential Risk/Benefit Plot for the Eagle Scenario
In the slightly difficult Mule scenario, there are few viable options. Seeking corporate funding has the highest potential benefit, but it also carries a bit of risk. Lower-risk options include farm out, IPO, and equity finance with a financial partner, but they are also lower in potential benefit.

Figure 8.13. Oil & Gas Company’s Potential Risk/Benefit Plot for the Salmon Scenario
In the more optimistic Eagle scenario, all options fell in the high benefit, low risk category. In this scenario, the environment favors Oil & Gas Company, and all options could be on the table.
The Salmon scenario provided some challenges that put the options toward the middle. Again, all options carry some risk under the circumstances. Of the set, a syndicated loan, convertible bond, IPO, and equity financing with an industry partner are worth considering.

Figure 8.14. Oil & Gas Company’s Potential Risk/Benefit Plot for the Porcupine Scenario
The most difficult scenario—the Porcupine scenario—did not leave much room for assessing viable options. In these conditions, the recommendation was to delay operations or abandon the project. An IPO could be an option to keep the project alive, but the risk outweighs the benefit.
Finally, across the set of scenarios, corporate funding, asset-based financing, and IPO carry possible value. In this situation, these options were recommended for more detailed study and analysis.

Figure 8.15. Oil & Gas Company’s Potential Risk/Benefit Plot—All Scenarios
Of course, there can be problems with averaging averages, but these are not statistical exercises—they are practical exercises. The idea of combining ratings across people and across groups requires caution. It is never recommended that the resulting outputs are simply followed blindly. It is important to recognize that the outcomes are based on participant perceptions of potential risk and benefit, which is why it is so critical that the participants really understand the issue, decision, and options. The purpose of this workshop is to vet the options down to a manageable few that can be studied more closely and potentially implemented.
Granularity and Comparability of Options
One important lesson in working with decisions and options is to ensure there is granularity and comparability of the options. To clarify, in order for the assessment of potential risk and benefit to be useful, the options need to be at least roughly similar. For example, in the Environmental Firm example above, there was a real lack of comparability. Acquiring a firm in California is far more resource intensive than making a few strategic hires in California. In this case, the assessment of potential risk and benefit was difficult because the options were so varied.
To correct for this, once a list of options is generated, it is extremely useful to consider a general scope, schedule, and budget for each option before working through potential risk and benefit rankings. Once this is accomplished, the options can be grouped into similar categories and the assessment of potential risk and benefit can be completed for each category of similar options. This will make the assessment of potential risk and benefit more accurate and useful. In the Oil & Gas Company example above, there was considerable alignment among the options: there were eight different financing options to retrieve the newly discovered resources from the ground.
Workshop Format and Guidelines: Decisions and Options
Time: 4 hours.
Participants: 5–15.
Assumptions: You have a set of scenarios and a defined decision with a set of options.
Workshop Format: The purpose of this workshop is to assess the potential risk and potential benefit of specific options in each scenario and across the set of scenarios. This is an activity that requires individual input as well as group dialogue and debate.
Instructions:
• Participants read scenario 1 and individually consider the potential risk and potential benefit of each option in scenario 1.
• Participants write their rankings (1–10) on the worksheet.
• Participants discuss their individual rankings and identify options of high risk and benefit overall (consensus is not required).
• Repeat this process for each scenario.
• When the process is complete for all scenarios, input rankings into an Excel file (or other software) to generate risk/benefit plots.
• Using the Excel tool, filter by scenario to display the potential risk and potential benefit plots.
• Find the options that collect in the “high benefit / low risk” quadrant as viable options.
• Find the options that collect in the “high risk / low benefit” quadrant as options that might be removed.
Summary
This chapter has demonstrated how to use a set of scenarios to understand the potential risks and benefits of specific options for a decision. Using scenarios in this way is a more specific version of windtunneling, and the goal is to find options that are beneficial in multiple or all scenarios. Another goal is to identify options that don’t make sense under any circumstances and can therefore be removed from the list of possible options or actions. This approach is extremely useful in reducing the list of possible options down to a manageable few that can be studied further and potentially implemented.