
Broadening Access to Large Online Databases by Generalizing Query Previews
Egemen Tanin, Catherine Plaisant and Ben Shneiderman[email protected], Human-Computer Interaction Laboratory, Institute for Advanced Computer Studies, Institute for Systems Research, and Department of Computer Science, University of Maryland at College Park, College Park, MD 20742, + 1 301 405-2725. E-mail address: [email protected], [email protected]
ABSTRACT
Companies, government agencies, and other types of organizations are making their large databases available to the world over the Internet. Current database front-ends do not give users information about the distribution of data. This leads many users to waste time and network resources posing queries that have either zero-hit or mega-hit result sets. Query previews form a novel visual approach for browsing large databases. Query previews supply data distribution information about the database that is being searched and give continuous feedback about the size of the result set for the query as it is being formed. On the other hand, query previews use only a few pre-selected attributes of the database. The distribution information is displayed only on these attributes. Unfortunately, many databases are formed of numerous relations and attributes. This paper introduces a generalization of query previews. We allow users to browse all of the relations and attributes of a database using a hierarchical browser. Any of the attributes can be used to display the distribution information, making query previews applicable to many public online databases.
INTRODUCTION
Companies, government agencies, and other types of organizations are making their large databases available to the world over the Internet. IBM (e.g., www.patents.ibm.com), US Census Bureau (e.g., ferret.bls.census.gov), NASA (e.g., eos.nasa.gov/eosdis), and the World Health Organization (e.g., www.who.int/whosis/) are only a few of these organizations. The designers, engineers, and operators of these public online databases are facing various challenges. The users of the Internet form the most varied user pool in terms of their backgrounds, interests, ages, and genders. Hence, designing effective user interfaces to accommodate such a variety of users is one of the challenges.
Designers of user interfaces for traditional offline databases mostly use command languages or form fillin interfaces in their designs. They generally serve a homogeneous user domain. Recent advances in database and user interface research enabled designers to create visual user interfaces that are easier to use and learn than the traditional approaches. However, most of these advanced interfaces, even for online databases, still continue to target a narrower user domain than the general population. Employees of a bank accessing an Online Analytical Processing (OLAP) Server from their houses form a good example of such a restricted user pool. Customers of a bank accessing an Online Transaction Processing (OLTP) Server form another one. Thus, we need different approaches to serve the users of the public online databases.
Designers of user interfaces for many databases generally make the following assumptions during their design processes:
a) Users are informed about the data that they are working on or they will submit known-item queries rather than probing the database,
b) Users know or have the will to understand a specific querying environment,
c) Users will have the bandwidth or the time to access large databases.
Most of these assumptions are not valid for the user domain of user interfaces for public online databases. Many user interfaces do not give users an indication of the availability of data. However, this is essential for public online databases to guide the users in the query formulation process. Unguided novice users may waste time by submitting queries that have zero-hit or mega-hit result sets. Traditional user interfaces require users to fill lengthy forms or form complex queries. However, users of public online databases do not have the time or the will to learn a query language or they are annoyed when they have to fill a lengthy form. A more efficient, simple, and easy to learn approach for defining queries is needed. Finally, users of a public online database have to access large amounts of data using a low bandwidth congested network. Hence, strategies that introduce efficient means of communication are needed.
Query previews [3, 12] form a novel approach for querying large online databases. Query previews supply data distribution information about the database that is being searched and give continuous feedback about the size of the result set for the query as it is being formed. Queries are incrementally and visually formed by selecting available items from a set of charts. Query previews take advantage of the fact that users are generally interested in a subset of the database. Once the scope has been narrowed, a second phase can start with local data. This second phase can be a simple list of hits or a sophisticated user interface that will allow users to visualize the hit set. The multi-phase approach will increase the network performance of the overall system. Figures 1 and 2 show a sample query preview panel [14] using the three commonly used attributes of a NASA database, the Global Change Master Directory (gcmd.nasa.gov). The distribution of data over these attributes is shown with bar charts and the result set size is displayed as a separate bar at the bottom.

Figure 1 A sample query preview developed at the Human-Computer Interaction Laboratory, for NASA’s Global Change Master Directory. Topic, Year, and Area are three most frequently used attributes of the data. These attributes are selected to show the data distribution information. The distribution is shown with bar charts. The result set size is displayed as a separate bar at the bottom.
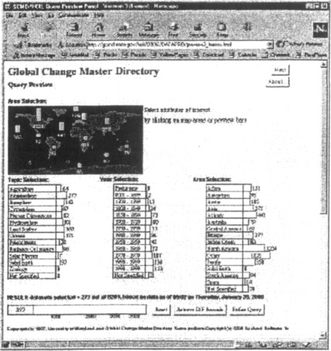
Figure 2 When users select attribute values (e.g. Atmosphere for Topic and Europe for Area in this snapshot), the bars are updated immediately to reflect the distribution of the data that satisfies the query. The result set size is also updated accordingly.
Recent work by [6] shows that many users prefer query previews and perform better with them. Users report that query previews are easy to use and understand. These results increase our hopes to serve a broad public user domain in a more satisfactory way.
Unfortunately, current applications of query previews use just a few pre-selected attributes of the data. The distribution information is displayed only on these attributes. These implementations of query previews work over a single table that has a relatively low number of attributes. The simplicity of the data structures and a user interface with only a few pre-selected attributes are the positive aspects of these implementations. However, databases are generally formed of numerous relations and attributes. Therefore, pre-selection of a few attributes is an important restriction of the query preview approach. Application of query previews to many public online databases requires this restriction to be relaxed.
This paper introduces a generalization of the query preview approach. We allow users to browse all the relations and attributes of the database with a hierarchical browser. All the attributes of the database can be used to display the distribution information using bar charts and can be expanded, visualized, and manipulated. Thus, with this generalization, the query previews are made applicable to many public online databases. This will help us to serve a broader user domain with a simple novel user interface.
RELATED WORK
Many researchers are trying to devise methods for more successful querying. The Rabbit system, by Williams [16] and the work of Heppe, Edmondson, and Spence [9] were early demonstrations of the benefits of progressive querying. Other systems show relevance of results: for example Veerasamy and Navathe [15] used histograms, and Hearst [7] used TileBars to visually present relevance of results to the terms used in the query. WebTOC [11] uses a hierarchical outliner and a bar chart presentation to preview the size and type of items (e.g., image, sound, etc.) within each branch and serves a very wide user domain, the Internet. Eick [4] proposes to augment sliders of visualization systems with density plots or bar charts. Antis, Eick, and Pyrce [2] introduce methods for visualizing the schemas of relational databases. Dynamic queries [1,5,13,17] use a direct manipulation approach to facilitate query formulation with a visual representation of query components and results. They allow rapid, incremental, and reversible control of the query. Results are presented visually. Continuous feedback guides users in the query formulation process. Marchionini and Greene [10] discuss the importance of user interface issues in public access and use of government statistical information. Hearst [8] lists many approaches to user interfaces for information retrieval systems.
QUERY PREVIEWS
The concept of query previews [3, 12] was triggered by the need to extend the dynamic querying idea [1,5,13,17] to large networked databases. Query previews show the contents of a database during the query formulation process. In order to guide users in the query formulation process, query previews provide aggregate information on some pre-selected attributes of the data. Distribution of data over some attribute values is shown graphically using representations such as bar or pie charts. When users select a value on any of the attributes by just clicking on the related representations of a query preview panel, the rest of the user interface is updated immediately. This is called tight coupling. Actions are easily reversible, and error prevention instead of error correction is used. For every action users take, feedback is given continuously. As users see the potential size of their result set before submitting the query, they are less likely to create queries that return zero or mega hits. Users see the trends in the data and they learn where the data has gaps or clusters. (Figures 1 and 2 show a sample query preview panel.) The server load will be reduced if users do not waste their time with zero hit queries or consume network resources in downloading large sets of useless results.
Query previews only need aggregate information about the database. The data distribution information is represented with multidimensional histograms. Each cell of a histogram represents a count of the records from the database mapping to that cell. Hence, whatever the size of the data is, only the counts are needed to form a query preview panel. The size of this information is fixed regardless of the size of the data. Only the counts are incremented with each insertion to the database. This makes query previews a powerful tool for large online databases.
GENERALIZING QUERY PREVIEWS
Current applications of query previews use a few pre-selected attributes of the data. The distribution information is displayed only on these attributes. However, databases are generally formed of numerous relations and attributes. Therefore, pre-selection of a few attributes is a restriction of the query preview approach.
To relax this restriction, we combine a hierarchical browser and the query preview approach to let users browse all the relations and attributes of the database. With this generalization all the attributes of the database can be used to display the data distribution information.
Figure 3 presents a sample hierarchical browser. In this example, we use the Environmental Protection Agency (EPA) as our sample organization and a fragment of the Toxic Release Inventory from the EPA data collections as our sample database.

Figure 3 A hierarchical browser represents the schema for the database. The root is tagged with the name of the database. Each relation is represented by a separate branch. Each branch may contain a few leaves representing the attributes of that branch. In this example, Contact Info and Chemical Info branches are expanded to demonstrate this feature.
This sample database is formed of approximately 400,000 reports of toxic material releases to the environment from various facilities in United States. We put together four relations from this database, which are Contact Info, Release Info, Chemical Info, and Facility Info. Each relation contains a few sample attributes, e.g., Contact Info contains Contact Phone and Contact Name as its attributes.
The root of our browser is tagged with the name of the database. Each relation is represented by a separate branch. Each branch may also have leaves representing different attributes of that branch (relation). The result bar is visible on top of the panel showing the total number of hits (reports for our example with EPA data) to the current query. At any time, the users can fetch these hits by simply pressing the fetch button on the left of the result bar. We attach the distribution information next to the related branch of that attribute.
Some of the attributes do not have the distribution information attached to them. For example, Contact Name of the Contact Info relation of Figure 3 does not have anything attached to it. The nature of the Contact Name attribute does not allow a useful representation. There are almost as many names in the database as the number of reports. Even if there were some overlaps, the total number of unique names would be so large that representing them with bars would simply clutter the display without adding much to the presentation. Finding a useful representation of such attributes will be beneficial to further generalization of the query previews. In this paper, we focus on other types of attributes, e.g., gender and age. These have useful representations. Figure 4 shows such an attribute. This attribute, the Reporting Year, is an attribute of the Release Info branch. It is represented as a folder. It can have other branches under it. Still, it is an attribute of the Release Info branch. This visual difference is used to show the expandability of this attribute. These types of attributes are expandable into buckets. Buckets show the possible values or ranges of values for that attribute. The distribution of data is shown over them.
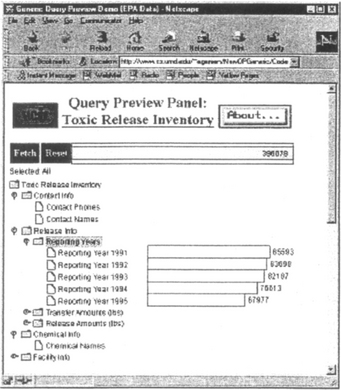
Figure 4 The Reporting Year attribute of the Reporting Info branch is expanded. A set of bars is attached to this presentation to show the distribution of data over this attribute.
In Figure 4, we see five bars showing the reports submitted in each of the five years of the EPA Data. The users can immediately see the number of reports has declined about 25% over the five years. Other attributes of the database can be expanded similarly. Figure 5 shows such a display that reveals high numbers of reports for the Southeast and Midwest, but relatively few for the Northwest.

Figure 5 Facility Region attribute is expanded showing the data distribution on another set of bars. Each bar is used to show a different region.
Bars also form a mechanism for input to the user interface. Figure 6 shows such an example action. The reporting year 1994 is selected by just clicking on the bar.

Figure 6 Selections on bars form an input mechanism. This panel shows that for 1994 there were 76,613 reports and shows the distribution by Facility Regions.
Upon any selection, the distribution information on all the other bars including the result bar is updated. A silhouette of the initial bar settings is kept to show the original sizes of the bars. The text field below the fetch button displays the selected values in text form. This is essential since the bars can also be collapsed to make room for other expansions. In this case, the visual feedback from the collapsed bars may be lost. Hence, the text field is a reminder for the previous selections. Another reminder for selections can be placed next to the attribute names. At any time, users can reset their selections by simply clicking on the reset button next to the fetch button. Figure 7 shows some further selections and updates on the bars. The session can continue as long as the users want to explore the database. When users want to see the hits to their query, they can fetch the desired reports from the EPA database matching their selections. They can view this hit set as a simple list or they can continue querying on it using various types of local tools.
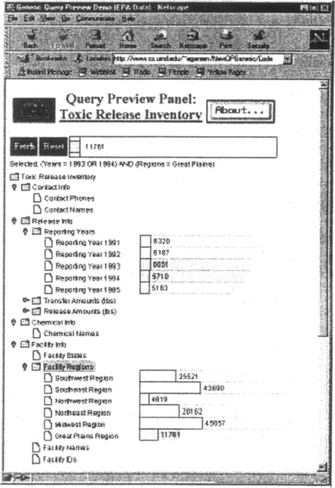
Figure 7 Further selections from the EPA data. Users continue to see updates on the bars as they make their selections. This panel shows “(1993 OR 1994) AND (Great Plains)” will produce 11,761 reports.
As bars expand and collapse the desired data distribution information is brought from the database server. This creates short delays during the query formulation process. Despite these delays, the amount of data that is downloaded from the network is very small, and does not introduce large interruptions or a significant network load. In general, we do not fetch the hits, but only the distribution information about the hits at these intermediate connections. In some cases, the distribution information can already be cached to improve performance. In some other cases, it can be a subset of the previous distribution, so a second connection can be avoided. In our example, the size of the total distribution information is only 8 Kbytes.
One limitation on the distribution information is the number of attributes that can be simultaneously displayed. This number is equal to the number of dimensions of data representing the distribution information. As this number grows, the amount of data needed grows exponentially. Thus, manipulating many attributes of the database at the same time may not be feasible. A solution to this problem is downloading the actual attribute values for the matching hits after the first few selections. After the initial selections, the size of the hit set may be drastically reduced. This will relax the restriction of not downloading large amounts of data from the server. Therefore, this solution can allow us to continue working on a local minimized version of the database.
CONCLUSIONS
Query previews form a novel visual approach for querying large online databases. On the other hand, current applications of query previews use only a few pre-selected attributes of the data. Unfortunately, many databases are formed of numerous relations and attributes. Applicability of query previews to many public online databases requires this restriction to be relaxed. This paper introduces a generalization of query previews. We allow users to browse all the relations and attributes of a database with a hierarchical browser. All appropriate attributes of the database can be used to display the distribution information using bar charts and can be expanded, visualized, and manipulated. Hence, with this generalization, we strongly believe that query previews will increase the accessibility to large online databases.
Some attributes of the database remain unused to show the data distribution. This is caused by the nature of these attributes (e.g., Social Security Number). As a future work, we believe relaxing this restriction on as many attribute types as possible forms a useful step in advancing the applicability of query previews.
ACKNOWLEDGEMENTS
This work is supported in part by NASA, US Census Bureau, and NSF Digital Government Programs. Thanks to Dr. Marchionini and Dr. Beigel for their comments on the previous versions of this paper.
REFERENCES
1. Ahlberg, C., Shneiderman, B., Visual Information Seeking: Tight Coupling of Dynamic Query Filters with Starfield Displays. Proceedings of the ACM CHI ’94 Conference. 1994:313–317.
2. January Antis, J., Eick, S., Pyrce, J. Visualizing the Structure of Relational Databases. IEEE Software. 1996; 72–79.
3. Doan, K., Plaisant, C., Shneiderman, B., Query Previews in Networked Information Systems. Proceedings of the Forum on Advances in Digital Libraries. 1996:120–129.
4. Eick, S., Data Visualization Sliders. Proceedings of ACM UIST ’94 Conference. 1994:119–120.
5. Goldstein, J., Roth, S., Using Aggregation and Dynamic Queries for Exploring Large Data Sets. Proceedings of the ACM CHI ’94 Conference. 1994:23–29.
6. Greene, S., Tanin, E., Plaisant, C., Shneiderman, B., Olsen, L., Major, G., Johns, S. The End of Zero-Hit Queries: Query Previews for NASA’s Global Change Master Directory. International Journal of Digital Libraries. 1999; 2(2):79–90.
7. Hearst, M., TileBars: Visualization of Term Distribution Information in Full Text Information Access. Proceedings of the ACM CHI ’95 Conference. 1995:59–66.
8. Hearst, M. User Interfaces and Visualization. In: Modern Information Retrieval. Los Alamitos, CA: ACM Press, Richardo Baeza-Yates and Berthier Ribeiro-Neto; 1999:257–323.
9. Heppe, D., Edmondson, W., Spence, R., Helping both the Novice and Advanced User in Menu-driven Information Retrieval Systems. Proceedings of HCI ’85 Conference. 1985:92–101.
10. ils. unc. edu/~march/ Marchionini, G., Greene, S., Public Access and Use of Government Statistical Information. Presented to the Federal Information Services. NSF Workshop, 1997.
11. Nation, D., Plaisant, C., Marchionini, G., Komlodi, A., Visualizing Websites Using a Hierarchical Table of Contents Browser: WebTOC. Proceedings of the 3rd Conference on Human Factors and the Web, 1997.
12. Plaisant, C., Bruns, T., Doan, K., Shneiderman, B. Interface and Data Architecture for Query Previews in Networked Information Systems. ACM Transactions on Information Systems. 1999; 17(3):320–341.
13. Shneiderman, B. Dynamic Queries for Visual Information Seeking. IEEE Software. 1994; 11(6):70–77.
14. Tanin, E., Lotem, A., Haddadin, I., Shneiderman, B., Plaisant, C., Slaughter, L. Facilitating Network Data Exploration with Query Previews: A Study of User Performance and Preference, CS-TR-3879. Department of Computer Science, University of Maryland; 1998.
15. Veerasamy, A., Navathe, S., Querying, Navigating and Visualizing a Digital Library Catalog. Proceedings of the Second International Conference on the Theory and Practice of Digital Libraries, 1995.
16. Williams, M. What Makes RABBIT Run. International Journal of Man-Machine Studies. 1984; 21(4):333–352.
17. Williamson, C., Shneiderman, B., The Dynamic Home Finder: Evaluating Dynamic Queries in a Real-Estate Information Exploration System. Proceedings of ACM SIGIR ’92 Conference. 1992:338–346.