
Capital Investment and Income Generation
Capital is not only long lived but also income generating. By its nature, capital investment is intended to generate income. As the capital stock expands, and the service it renders grows, income generation grows as well. The resulting income, of course, is earned by the owners of capital, not labor. The long-lived nature of capital and its income-generating ability can result in prolonged period of capital income production. Consequently, a substantial shift in the distribution of income between labor and capital is observed in the deployment period.
As the stock of capital expanded over the 1944–1974 deployment period, the complementary of labor and capital increased labor’s income as massive industrial and business transformation, not only deployed a vast quantity of tangible and intangible capital but also drove a substantial increase in the demand for labor. The result was an increase in labor’s income share. See Figure 4.1—U.S. nonresidential net fixed investment and U.S. top 1 percent income share.
However, as the deployment period of the Third Industrial Revolution became the installation period of the Fourth Industrial Revolution, the long-lived capital of the prior era continued to provide services and generate income. Capital services are derived from the stock of tangible and intangible assets. Such services differ from the capital stock because short-lived assets, such as equipment, provide more service per unit than long-lived assets, such as structures. Unlike the stock of tangible and intangible assets, capital services are owned by those providing the service.1
![]()
where
cst = Capital Services
aget = Age of Capital
It = Investment in new capital
δt = depreciation of capital
Kt = Capital Stock
Longer-lived and older assets deliver less service, while shorter-lived and younger assets deliver more service. In addition, the current period net additions are the most productive service delivery providers. Figure 2.3 shows the net additions to the capital stock and Figures 2.6, 2.7, and 2.8 show the age of the capital stock.
To measure the impact that capital services have on wealth as well as their influence on income distribution, household financial assets are estimated as a function of capital services, equity market values, and real interest rates.
![]()
where
fhat = Annual Net Additions of Household Financial Assets
shat = Current Period Stock of Financial Assets
s&pt = Rate of Change of S&P 500 Index
rt = Real U.S.Long-term Treasury Rate
Figure C.1 shows the ratio of net new household assets to the stock of assets. Figure C.2 shows both capital services along with the household assets ratio. Figure C.3 financial market return metrics. All data enter equation (C.2) and are represented as Hodrick–Prescott (HP) trends.
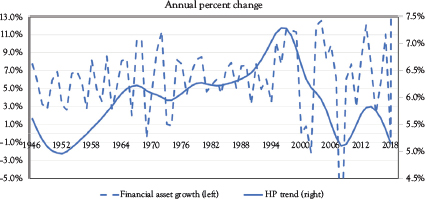
Figure C.1 U.S. household and nonprofit asset growth as a percent of fixed assets
Source: Households and nonprofit organizations; Total financial assets, Financial Accounts of the United States, Z.1, Federal Reserve Board.

Figure C.2 U.S. household and nonprofit asset growth as a percent of fixed assets and capital services
Sources: Financial Assets, see Figure C.1, Capital services, Figures 3 (nonresidential net capital investment), 6 (Age total and 3 categories), and 7 (Age adjusted).
Table C.1 provides estimates of equation (C.2) over four time periods. In three of the four periods, capital services are highly correlated with household assets, suggesting that the income-generating capability of tangible and intangible assets is important for the accumulation of household financial assets. Over the entire period, 1946 to 2018, and the most recent period, 1987 to 2018, the coefficient estimates are stable and with the expected signs. In the 1987–2018 period, equity market value changes are highly correlated with household financial asset values and, at the margin, add to explainability of household financial asset accumulation. Similarly, real interest rates have also added to household wealth.
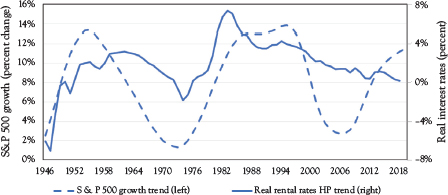
Figure C.3 U.S. real long-term treasury rates and S&P 500 growth
Sources: S&P 500, Federal Reserve Bank of St. Louis, FRED Economic Data; US Real Long Term Interest Rates, 1946-1964, NBER Series 13033 from US Treasury Department, Treasury Bulletin; 1965-2018, Federal Reserve Bank of St. Louis, FRED Economic Data, 10-Year Treasury Constant Maturity Rate, Percent, Monthly, Not Seasonally Adjusted.
In the 1946–1974 period—the years most closely aligned with the Third Industrial Revolution deployment period—capital services are highly correlated with changes in household financial assets. During the near 30 years of capital deepening, the income generation very likely provided a source of household financial assets. The 1946–1975 period was one of strong growth in the real sector while the equity market apparently was anticipating slower growth in the period ahead, which, to some extent, turned out to be correct. The coefficient on the S&P 500 term has a negative sign and is significantly different from zero. Real interest rates rose over the period as increasing demand for financial capital contributed to the increase in financial assets while also, presumably, as contributed to the eventual slowdown in growth and capital deepening.
Secondly, the 1975–2007 period, the income generated from capital services are only weakly correlated with household asset values while changing equity market values are more highly correlated. The 1975–2007 period—the installation period of the Fourth Industrial Revolution—realized less benefit from the capital services in place from the earlier period. Meanwhile, equity market gains—as rents from the new technology are captured—were highly correlated with gains in household financial assets. With real interest rates in a long period of decline during the 32 years, the coefficient is negative sign and is significantly different from zero (See Saez and Zucman 2020).
Table C.1 Household financial asset flows as a percent of household asset stock
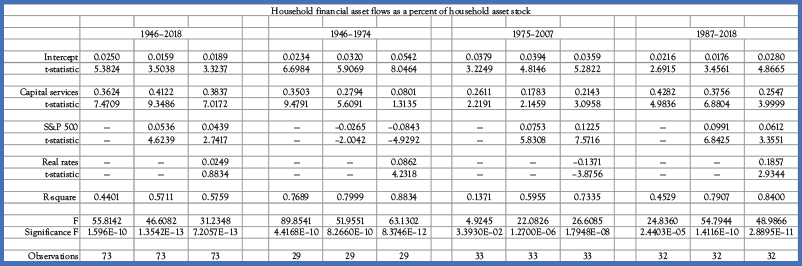
The long-lived nature of capital assets means embodied vintage technology remains in place for an extended period. The long life also means the capital stock requires replacement infrequently, resulting in extended periods of adjustment. Further, the income-generating capability of capital services provides a long-lasting source of income and wealth. Prior to 1975, capital services were highly correlated with financial asset accumulation. In the post-1975 period, equity and debt assets—perhaps the fruit of the earlier period—are highly correlated with asset accumulation while income generating capital services recede in their correlation.
1 See Bureau of Labor Statistics Glossary.