
Chapter 13
Online Temperature Tracker
Ingredients
- 1 Arduino
- 1 Arduino USB cable
- 1 Arduino power supply
- 1 breadboard
- Your computer
- A home wifi network and the password for it
- A web browser
Special items
- Your assembled SparkFun WiFi Shield
- 1 thermistor (model TMP36)
When explorers sailed the seven seas finding new (to them) places, plants, and peoples, they often kept careful logs—a diary noting the day, the time, and what they observed. Arduinos may not be seaworthy, but they are excellent at logging their observations. With this project, we’ll get Arduino logging and we’ll put that log online.
Concepts: Logging and Charting Sensor Data Online
Keeping track of observations is super useful. With lots of observations over time, you can see the peaks and valleys in your numbers and discover things you didn’t know.
We’ll be tracking the temperature inside your house (or wherever you set up your Arduino). If you were to do this by hand, you might set an alarm clock to check a thermometer every hour and then write it down. That’s exactly what we’ll have your Arduino do—with the added bonus that it’ll work even when you are asleep or away!
Instead of paper, we’ll use a free online service called data.sparkfun.com to store the temperatures—which will allow you to see and use the data.
The wifi board is the same one we assembled in the chapter “Get Your Arduino Online.” If you’ve skipped ahead, you’ll need to go back to that section before doing this project.
The thermistor comes in almost every Arduino starter kit, and can be also purchased separately online. For links to kits and parts for this project, visit http://keefe.cc/temp-tracker.
Steps
Wire Up the Parts
The setup for this project almost exactly the same as the one in “Ice, Ice Blinky,” but with the SparkFun wifi board mounted on top of the Arduino.

Figure 13-1: The wiring diagram for the “Online Temperature Tracker” project, with the SparkFun wifi board atop the Arduino
Here’s how to wire it up:
Getting the WiFi Shield On Top
- Attach the wifi shield you assembled in “Get Your Arduino Online” to the top of the Arduino, being careful to make sure all of the metal pins go into the corresponding holes.
- Connect the square-ish end of your Arduino USB cable to your Arduino.
- Connect the flat-ish end of your Arduino USB cable to your computer.
Wiring Up the Thermistor
- Notice that the thermistor has three legs, and also that it has both a flat side and a rounded side.

Figure 13-2: The position of the temperature sensor, with the flat side facing at the printed numbers along Column a
- Insert the three legs of the thermistor into in the breadboard’s Column a at rows 1, 2, and 3 with the flat side facing the breadboard’s printed numbers. The rounded side will be facing the other direction, toward the breadboard’s center canal. You’ll have to separate the legs a little to get them in each of the holes.
- Connect one end of a jumper wire (preferably a red one) to the
5Vpin on the wifi board and connect the other end to the breadboard’s Row 1—let’s use Column e. - Connect one end of another jumper wire (any color; I used yellow) to the wifi board’s
A0pin, and the other to the breadboard’s Row 2 at Column e. Notice that we’re staying on the same side of the breadboard’s center canal. - Connect one end of a (preferably black) jumper wire to any of the wifi board’s
GNDpins, and the other end of the wire to the breadboard’s Row 3 at Column e.
Load Up the Code
Use your favorite code-fetching method one last time, with feeling:
From the Web
- Use a web browser to visit http://keefe.cc/temp-tracker.
- Follow the same instructions as in previous chapters.
From the Bundle
- Find your
family-projects-sketches-masterfolder, and double-click it to open it. - Click on the
temp_trackerfolder. - Follow the same instructions as in previous chapters.
From the Back of This Book
- Highlight the entire code block for this chapter from Appendix B.
- Follow the same instructions as in previous chapters.
No matter how you got the project code into your Arduino software, be sure to save your work, using File → Save.
Get a Free Data Account
To store your data online, you need to create a free account at data.sparkfun.com. So let’s do that:
- With an Internet browser, go to http://data.sparkfun.com.
- Click on the red button that says “Create a free data stream immediately at data.sparkfun.com.”
- Give your data a title, like “Temperature At Our House” (keep in mind things here will be made public).
- Add a description, like “Temperature sensor in the living room.”
- Choose “public” for your data. This will make it easier to chart your information later.
- Under “Fields,” type
temp. This one is important; make sure it’s justtempand that it’s lower-case. - Give it an “alias,” which is just a short name you’ll use to find your data. Something like
karenstemps. - The tags and location areas are optional.
Okay! Now you get to a page with a lot of numbers and letters on it, including things like a “Private Key.” You’ll need all of these, and should have them handy down the road. SparkFun makes keeping track of them really easy with a box at the bottom to “Send yourself a copy of your keys.” Let’s do that now.
- Put your email address into the box at the bottom of the page, to make sure you get a copy of everything on this page. Whew!
- Next, highlight and copy the line of letters and numbers labeled “Public Key” using Edit → Copy from your browser’s menu bar.
- Switch to the Arduino software.
- Using Edit → Paste, paste your public key near the top of the program in place of
YourPublicKeyHere.//////////////////////// // SparkFun Data Keys // //////////////////////// const String publicKey = "YourPublicKeyHere"; const String privateKey = "YourPrivateKeyHere"; - Repeat the copy-paste process with your the letters and numbers labeled “Private Key,” pasting them into your code in place of
YourPrivateKeyHere. - Finally, go back to your web browser and click the link in the “Public URL” box. It’ll take you to a mostly blank page. This is your data page, where your data will appear. Bookmark it so you can come back. (It’s also in the email you sent yourself.)
Great! We’re almost there.
Insert Your WiFi Info
Once again, we need to put your wifi network information into the Arduino program. So switch back to your Arduino software.
- Look for these lines near the top of the Arduino program:
////////////////////////////// // WiFi Network Definitions // ////////////////////////////// const char mySSID[] = "YourWiFiNetworkNameGoesHere"; const char myPSK[] = "YourWiFiPasswordGoesHere"; - Replace
YourWiFiNetworkNameGoesHerewith the name of your home wifi network, keeping the quotes. - Do the same with
YourWiFiPasswordGoesHere. - Save your work using File → Save.
Make It Go
- Upload the code to your Arduino by pressing the arrow button at the top of the blue window or using Sketch → Upload.
- Open the Serial Monitor using Tools → Serial Monitor to watch the progress as it works!
On startup, and every two minutes after that, the Arduino will take a reading from the temperature sensor and send it to your page on data.sparkfun.com. Let’s see if it’s there.
- Go back to your web browser and the “data page” you bookmarked (the link is also in the email you sent yourself if you didn’t bookmark it).
- Use your browser’s “reload” or “refresh” button to get a fresh version of the page.
- You should see data like this:

Figure 13-3: Temperature readings posted at data.sparkfun.com
If you don’t see information like this, check out the “Fixes” section below.
Try holding the thermistor in your hand or touching it to a piece of ice. Wait at least a minute and then refresh the data page again. See if the new values reflect what you did.
If all is well, let’s make the check every hour instead of every two minutes.
- Back in the Arduino code, find this line and change the 2 to 60:
/////////////////// // Sensor Values // /////////////////// int waitMinutes = 2; - Upload the code to your Arduino again by pressing the arrow button at the top of the blue window or using Sketch → Upload.
Now you’re set!
Your temperature logger no longer needs your computer to function, so you can disconnect the USB cable from your computer and your Arduino. To make it operate solo, simply plug in the Arduino power supply. The code will automatically start running again once the Arduino is powered up, and it’ll check—and post—the temperature every hour as long as it has power.
Fixes
If you are seeing entries on data.sparkfun.com, but they are all zeros, there are a couple of things to check:
- Make sure the column name above the zeros says “temp.” That has to match the Arduino code, which is sending a value for “temp.” If the top of the column says something else, here’s how to fix it:
- On your data page, click the “Manage” button at the top right of the page.
- When asked, enter your private key for your data, which is in the email you sent yourself (and also in your Arduino code now).
- Click “Edit.”
- In the “Fields” section, edit what’s there to include one called “temp” (and delete any you’re not using, clicking the “x” next to its name).
- Click “Save.”
- Make sure your thermistor is connected properly. You can check this by opening up the Serial Monitor using Tools → Serial Monitor. The readings will appear here before getting sent to SparkFun. If they aren’t values you’d expect, carefully go through the “Wire Up the Parts” section above.
What’s Going On?
Here’s the entire chain of events:
- The ambient temperature changes the resistance of the thermistor.
- Every hour, your Arduino checks the electricity passing through the thermistor, detects the resistance, and converts that into degrees.
- It then sends that number over the Internet to data.sparkfun.com, using the same technique you use when you submit the word “Arduino” to a search site.
- The SparkFun site adds a timestamp and stores the value online for you.
This all happens super quickly!
Code Corner
Pretty Printing
Whether you’re printing data to the screen in the Serial Monitor or “printing” data to another server, via the wifi board, how you format your printing can be key.
Throughout this book, you’ve probably seen Serial.println() and Serial.print(). Notice the subtle differences—the first one has an extra ln after the print part. That reads as “print-line,” which means print what’s in the parentheses, and then make a new line.
So this code . . .
Serial.print("The number of legs on an octopus is ");
Serial.println(8);
. . . would show up in the Serial Monitor as . . .
The number of legs on an octopus is 8Notice the extra space I added after is so the 8 wouldn’t smash up against it, like is8.
Instead of the number 8, I could have used a variable in that second set of parentheses, like so:
int legs = 8;
Serial.print("The number of legs on an octopus is ");
Serial.println(legs);
which would output the same result.
This is the niftiest way to get variables into lines that you print to the Serial Monitor.
Taking It Further
Once you have your data online, now what?
Well, you can download it to your own computer if you wanted, using the “CSV” button. The file you download will open in any spreadsheet program. From there, you can analyze it as you please.
You’ve also created a kind of API (remember: Another Person’s Information or, really, application programming interface). If you right-click the JSON button, you can copy the link location of that button. That Internet address is a live link to your data. Since you made your data public, that link can be used by other programmers to make their own smart objects!
More fun for you, though, may be to visualize your data.
Chart Your Data
Since your data is now online, you can use many different services to play with it. One is called Plot.ly, at http://plot.ly, which will allow you to quickly chart your data for free.
- In your web browser, open a new tab or window.
- From your data page at data.sparkfun.com, right-click or control-click the the “CSV” button near the top, and choose “Copy Link Address” (or the similar option on your system).
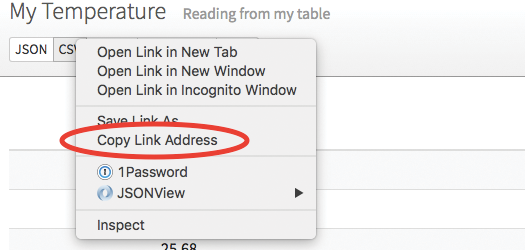
Figure 13-4: Right-click the “CSV” button to copy the link to your data.
- Now go to http://plot.ly and click the “New Chart” button.
- You’ll be asked to log in or sign up. Choose the “Sign Up” tab, enter your details, and pick a password (it’s free).
- You’ll get a screen full of stuff, but the data will be missing. Click the “Import Data” link near the top.

Figure 13-5: On the Plot.ly page, choose “Import Data.”
- In the next window, click “By URL.”
- The link to your data CSV should still be in your computer’s memory, so paste it into the box using Edit → Paste.

Figure 13-6: Use the “By URL” option and paste in the address to your data CSV.
- Press
EnterorReturn. - Under “Chart Type,” pick “Line plot.”
- For the “X” box, select “timestamp.”
- For the “Y” box, select “temp.”
With those settings, you should see your data visualized!
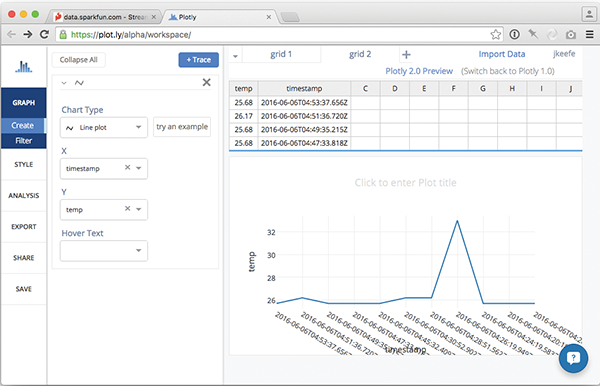
Figure 13-7: After setting the Chart Type, the X and the Y values on the left, I get a chart of my data on the right.
Plot.ly has lots of other features you can explore to adjust and share your chart. The entire service is just one example of how you can use your data once it’s online and available to play with.