
There is no freedom quite like the freedom of being constantly underestimated." | ||
| --Scott Lynch | ||
When I first started programming, I used print statements. Having to write this book, I took a look at some of my earliest code samples, and it turns out that most of it was commented out print statements used for checking the value of variables. Note that I started off writing C using Notepad, and compiling all that through the command line, so no green run button and no IDE. I knew about GDB, but it was so hard to even set a simple breakpoint that I stuck to my print statements. Most of the bugs I had encountered so far had been obvious bugs staring at me in the face. After a few mishaps, I started to print everything that I could so that I could take a look at where the program was and what was happening, making sure not to underestimate bugs or the extent of my own stupidity.
In this chapter, we are going to be talking about PyCharm's powerful debugging tools and use them to understand, examine, and yes, debug our programs. We are going to:
- Take a look at how we can run Python scripts in running mode and debugging mode
- Understand the different components of the debugging toolset
- Use variables and watches to make sure we miss nothing
- Utilize frames to zoom in and out of different layers of a program—from your scripts right down to the Python standard library
- Evaluate expressions at breakpoints
- Use the Python console and Python prompt to gain a better understanding of program execution
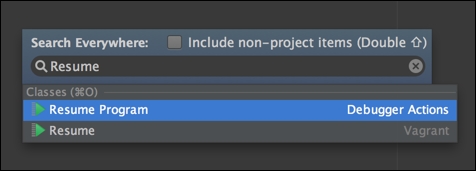
You can run a .py file in two modes: running and debugging. If you run a program, then even if you set breakpoints (points at which PyCharm will stop program execution), nothing will happen. It's only when you run it in debug mode that breakpoints become effective. The way I like to run or debug my programs is through the Resume Program action:
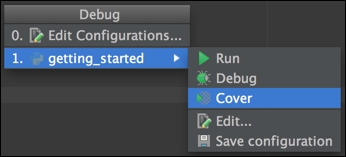
You can then choose any of the different ways to run/debug your program. By default, if you press Enter, you will go into debug mode, if you press Shift + Enter, the program will just run. You can also choose coverage by pressing the left arrow:
As soon as you start debugging, a window appears underneath and you have so many options that it's hard to make sense of it all. Let's focus on managing breakpoints for now. To the bottom-left of the window, you can see a bunch of buttons:

This is the View Breakpoints button. This allows you to see different types of breakpoints that are available to you:

The breakpoint we set is a line breakpoint, but by default, in debug mode, program execution will suspend when you get an exception. You can actually disable this, but this only makes sense when you're looking for certain exceptions. Say, you only want to catch TypeError exceptions:
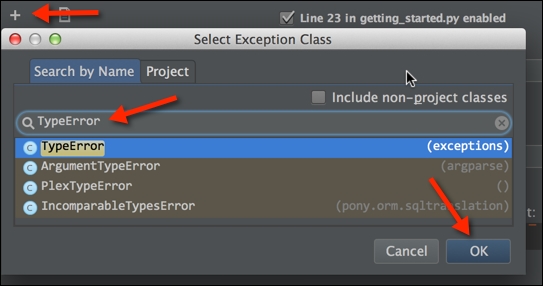
You add TypeError to your list of exceptions; you can also add exceptions that are only available in your project. So, with that added, we now have:
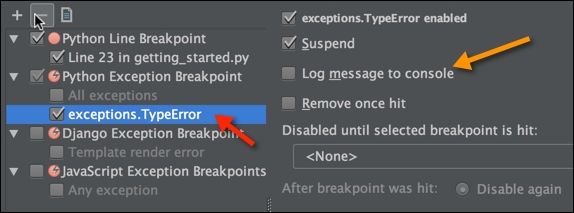
Unfortunately, you do not have the same fine-grained control as you do with line breakpoints, where you can evaluate expressions to pause execution. But, it still allows you to narrow your focus on certain exception types:

In the preceding example, the breakpoint will only execute if the Person object is None. If this condition is true, this will be logged to the console, and so will the expression. In this case, it will simply print the string.
You can of course toggle all the breakpoints in debug mode as well:
