
4
Research in Response to Societal Questions
Sustainability, and in particular climate change mitigation, is becoming a central tool to ensure our global competitiveness and the well-being of our citizens. That is why sustainability is truly a priority for our Presidency. Europe must seize the effects of research and innovation to differentiate the economy and develop the competitiveness of European industry. (Kulmuni 2019)
In Europe, there are around 3,000 higher education institutions and many other research organizations such as the CNRS in France, the Max Planck Gesellchaft and Helmholtz Gemeinschaft in Germany, the CNR in Italy and the CSIC in Spain. About half of all the Higher Education Institutions are considered ‘research active’ and around 850 award doctorates. These universities and research organizations employ around 900,000 public sector researchers. One should note also that much of the research funding available in Europe is institutional funding […]. Institutional funding can be formula-based, negotiated or historical. What that means is that in many European countries, project funding, defined as money attributed to a group or an individual to perform a research activity limited in scope, budget and time, is rather limited although the recent evolution has been in the direction of increasing it, unfortunately often correlated with a sharp decrease of recurrent funding […]. By contrast, in the US there are only around 400,000 public sector researchers and only around 300 out of over 4,000 Higher Education Institutions award doctorates. Federal research funding is heavily concentrated on the most research-intensive of these institutions. In 2014, 76% of the federal research expenditure for Higher Education Institutions went to the 108 classified as ‘very high research’ under the Carnegie classification (NSBSEI 2016). The top American universities also remain highly attractive to the best scientists from around the world. So, from this very quick ‘survey’ we can readily see that individual researchers in the US have more resources on average, and crucially there is ample project funding available for individual researchers from multiple sources. There is a clear hierarchy of research institutions with the top ones having won a global reputation. (Bourguignon 2019)
The worst is to come from the combination of five major characteristics of globalization: an unequal machine that undermines social fabrics and stirs up protective tensions; a boiler that burns scarce resources, encourages monopoly policies and accelerates global warming; a machine to flood the world with liquidity and encourage banking irresponsibility; a casino where all the excesses of financial capitalism are expressed; a centrifuge that can blow up Europe. (Artus and Virard 2008)
All these revolutions, all these mutations are the stages of a progression of human consciousness, and this progression always implies a double collaboration: collaboration with nature and collaboration between humans. Indeed, none of these transformations could be achieved by a few isolated individuals. As Newton said, the so-called ‘inventors’ are scientists, ‘dwarves on the shoulders of giants’. These giants represent all human collectives – not to mention the psychological and social conditions that made these inventions possible. (Viveret 2012)
We need ‘construction words’ to think about the alternatives we carry. (Aries 2010)
Don’t tell yourself stories, don’t abuse yourself, on the understanding that you are the easiest person to abuse. (Feynman 2000)
We know what to do, but we don’t do it because the cost (objective or subjective) of implementation is perceived as too high. (Valaskakis 2014)
Bertrand Gille (1978) had, in his history of techniques, defined what a technical system is. He wrote: ‘All the techniques are to varying degrees dependent on each other and there must necessarily be a certain coherence between them: this overall consistency at the various levels of all the structures, of all the groups and all the sectors, constitutes what can be called a technical system.” What makes this system move? How are new technologies emerging? In practice, when a technology becomes mature, what was neglected in its development phase in terms of dysfunctions or constraints, becomes sufficiently limiting to serve as a call for new ideas based on scientific knowledge. Two models, although reductive, can be proposed:
- – the first takes into consideration the positive contribution of science to strengthen and conceptually improve autonomous knowledge that has been previously exploited in a given field (for example, the transformation of matter and energy) and to advance it;
- – the second, more innovative model, is to allow the emergence of new technological eras (electricity at the end of the 19th Century, nanotechnologies today, etc.). This last aspect has already been partially presented in the previous chapter.
The emergence of new technologies in a given system results from a demand for transformation, linked to forms of dysfunction, that must be solved by new means (in the case of electricity, apart from transmission belts, the driving force could not be divided, factories had to be in immediate proximity to energy “production” sites, transport was limited by insufficient control of networks, lighting, etc.). Moreover, this technological discomfort is at the moment when current technology is beginning to saturate itself (which from a perceptual point of view leaves only the impression of inadequacy to needs) with stagnant performance. The new technology relieves this discomfort for a while and finds new application niches (model 1). For the second to manifest itself, it is necessary to find situations of exceptions that will lead to a real breakthrough (as in the case of the transistor, 60–70 years ago and of elements of lesser magnitude from the previous chapter).
Process Engineering (PE) was created in the middle of the 20th Century on the basis of autonomous knowledge (roughly speaking, industrial chemistry), with little connection to scientific knowledge of the time. The reconciliation between Chemical Engineering (CE) and/or PE sciences, has made it possible to successfully understand and anticipate dysfunctions and to promote the optimization of production systems. In the current production system, however, PE is confronted with its inclusion in various dynamics that combine the issue of the sources of materials to be transformed (increasingly poor), fluctuations in their costs, waste management, occupational health and safety conditions, the environment, the image of the activity (“chemistry is dirty”), etc., as well as the contribution of other disciplines (chemistry, materials, digital, etc.). In this chapter, we summarize a collective work mainly focused on aspects of complexity exploration in which PE must find a place.
4.1. General framework
Indeed, for the classical scientific method to be applied, it presupposes two prerequisites: on the one hand, that the interactions between the parties are nil or negligible and, on the other hand, that the relationships that describe the behavior of the parties are linear. It is only under the combination of these two conditions that their summativity becomes possible. Put in this way, it is clear that this analytical method is insufficient. (Dutriaux 2019)
A reflection carried out in 2014 (André et al. 2014) at the request of the Centre national de la recherche scientifique or the French National Center For Scientific Research (CNRS) examined how these two models of improvement and breakthroughs can be considered (and how to support them) according to the major trends that are emerging: global warming, depletion of reserves, transition to a society of individuals, well-being, health, etc. The notions of performance and efficiency of production systems have been broadened to include the short and long term, in line with the current material and human constraints where technical, economic, societal and human uncertainties and variability have never been so important. Most competitiveness is based more on product quality, variety, the richness of the services associated with it (downstream; goals) and their degree of innovation than on costs alone (upstream; means). The resources in matter and energy, which we now know to be limited, whether by their depletion, their difficulty of access, the prevention of their extraction (example: shale gas) or by their unaffordable price, redimensions the space of possible solutions, in particular by recycling and reuse.
All these elements are not of the same nature and PE sciences can only address them with a set of partners from complementary disciplinary backgrounds: other engineering sciences and digital sciences and technologies. All must cooperate with managers, economists, sociologists and ergonomists, industrialists, training centers, etc. Despite its successes, the fragmentation of science into disciplines has been detrimental to the development of an integrated vision of production systems. It is now a question of drawing on this diversity of complementary expertise (i.e. experimenting to define ways of optimization) to put them in synergy with a common vision and a shared understanding. These areas also cannot be addressed in isolation because they only make sense together. In this context, it will be interesting to examine whether the “lifecycle” thinking that must inform research to propose sustainable solutions, satisfies all stakeholders.
In this chapter, it is a question of considering a teleological perspective in which the logic of action is governed by the application purpose. Operating under these conditions, we are increasingly placed in a systemic context that is based on that of the totality (at least perceived), normally constituting something more than the sum of our disciplinary contributions. Downstream-oriented actions are then based on holistic thinking.
Several approaches for the evolution of production systems are now being put forward in many recent reports:
- – “mass” personalization (Sundar and Marathe 2010; Haddou-Benderbal 2018): “Customization requires that the adaptation of the product be carried out by the consumer during the coding experience, while the company takes charge of this step in personalization, based on information collected in advance. The method of revealing preferences therefore differs” (Merle 2010). If manufacturing systems are to be reconfigurable in the vision of the Factory of the Future, because it aims to effectively adapt to the increasing complexity of manufacturing environments, this aspect may be less time-consuming for products used to make materials and for materials used to produce objects and devices. However, for a product engineering industry, this aspect cannot be ignored. Table 4.1 summarizes the key elements of this domain according to Mourtzis (2016):
Table 4.1. Differences between mass-production, mass-customization and customization
Mass-production Mass-customization Personalization Production objective Economies of scale Economies of scale
Economy of rangeEconomies of scale
Economy of range
Differentiation of valueClient’s role Buyer Buyer after choice Buyer after choice
Participation in the design processDesired product features Quality
Cost
DesirabilityQuality
Cost
VarietyQuality
Cost
Variety
Efficiency and effectivenessProduction system Dedicated manufacturing system Reconfigurable manufacturing system On-demand manufacturing system Product structure 

- – circular economy: it should be recalled that the concept of the circular economy corresponds to a generic term for different schools of economic thought: methods of product design “Cradle 2 Cradle” avoiding in particular the use of toxic materials; “biomimicry” integrating design characteristics and processes observed in nature; industrial ecology and blue economy of use and reuse of materials, as well as the limits of their systems (Ing 2019; The Beam 2019). According to IISD (2019), 400 million tons of metal is recycled each year. But, according to the same report, only 5% of lithium is recycled, even though it has significant economic importance for the storage of electrical energy! Several reasons were mentioned, including the public’s perception of the lower efficiency of storage devices using recycled materials, but also the lack of economically acceptable processes. However, cobalt and lithium are in a strategic position for energy transition (see Appendix 3).
Digitalist (2018) recalls that this model appeared in the Kalundborg industrial park in Denmark where, since a pioneering experiment began in 1972, industries have regularly exchanged materials and raw materials. Successfully creating wealth without generating waste is the objective of the circular economy, set up in 1972 (Koch and Wellers 2018). Although no company can boast of having achieved such an ambitious and undefined recycling target, it seems indisputable that the principles of this economy are becoming increasingly popular and are reflected in many research programs (see for example Gourdon 2010; Buclet 2015; Ernoult 2018; EU 2018a; France Stratégie 2018; Gomez 2018; Jansens 2018; Morgan 2018; Poux, Cognet and Gomez 2018; Roussel 2018). Figure 4.1 illustrates the principle of the circular economy according to the EU (2018a). According to ADEME (2019), the recycling potential is significant and insufficiently exploited: 66% paper recycling, 50% steel recycling, 58% glass recycling but only 6% polymer recycling.

Figure 4.1. General principle of the circular economy
Figure 4.2 from USGS (2019) shows the importance (for the United States) of primary sources of mineral reserves in the economic activity of the country. The import component of these materials is a very important factor to be taken into account in international competitiveness and in maintaining the purchasing power of citizens. Not only are reserves running out, but this is already an economic problem that alone justifies the exploration and development of the principles of the circular economy
After several months of consultations, France presented its roadmap on the circular economy, which contains 50 measures to promote its transition to a more sustainable economy (French Republic 2018). In concrete terms, the objectives of the roadmap are many:
- – reducing resource consumption by 30% by 2030 (compared to French GDP in 2010); for example, according to Shahan (2019), plastics now account for 0.89 gigatons of CO2 equivalent, they are estimated at 1.34 gigatons in 2030 and 2.80 gigatons in 2050 (equivalent to 615 coal-fired power plants!). In this simple example, the idea of recycling is legitimate;
- – reducing by 50% the amount of non-hazardous waste that will be landfilled by the year 2025 (compared to French GNP in 2010);
- – reducing greenhouse gas emissions by about eight million tons per year by improving recycling of plastics;
- – creating up to 300,000 new jobs.
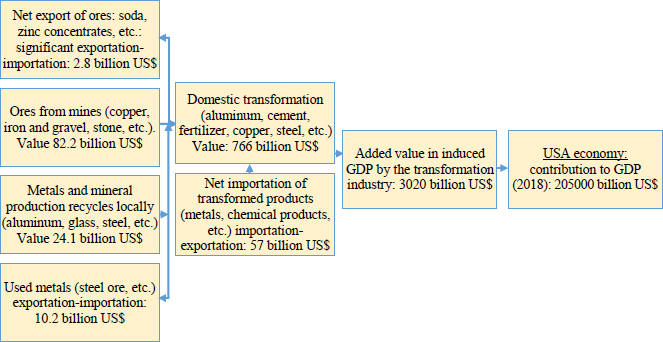
Figure 4.2. Importance of primary material supplies in the US economy
Figure 4.3 (Garcia-Serna et al. 2007) presents the (new) difficulties in integrating sustainable development paradigms into process activities (paradigm tectonics).

Figure 4.3. “Tunnel effect” in PE involved in sustainable development
But, as we have understood, when, for example, metals are diluted in a computer device at lower concentrations than those found in current ores, it is generally preferred to use primary sources. “All that would remain, not to prevent but to delay this deadline, is recycling. However, the cost itself is so prohibitive that little is invested in this sector. Alloys and composite materials, multilayers at the origin of extraordinary properties of modern objects, are difficult to separate and require a reevaluation of manufacturing methods in order to take into account, from the design stage, the perspective of recycling at the end of its life. The recycling of electronic equipment requires polluting chemical operations to separate the components. However, cleaner and more promising methods are being researched” (Aumercier 2018). Under these conditions, unless the recovery process is inexpensive in relation to the price of metal (an example is gold), only major components (but generally of modest cost) are recycled. In addition, according to UNEP (2013), in conventional pre-treatment processes for electronic waste (e.g. with magnetic separations), rare earth materials such as neodymium, praseodymium, dysprosium and terbium, which are contained in permanent neodymium magnets in laptops, are found as fine particles in steel recycling. They are therefore lost in any recovery process (IFRI 2018a). Thus, between 0 and 1% of rare earth materials would be recovered. What concerns these rare metals is applicable to many materials. If we wish to avoid the effects of global warming (POST 2019), for EMF (2019), artificial intelligence (AI) can play an important role in this increasingly unavoidable systemic change. It makes it possible to learn more quickly what feedback represents, to react more effectively by taking into account a large number of parameters and data, particularly on environmental aspects. For PIPAME (2019a), today, the process industries sector, in which the notion of optimization is essential, “learning systems more accurately reproduce the operation of a machine in real conditions. They are beginning to identify factors of sub-optimal use or dysfunction that are beyond the control of human experts and allow better anticipation of maintenance. In the field of energy transition, identifying the multiple intermittency factors in electricity production and consumption is an important challenge for learning technologies. This will make it possible to better ‘anticipate’ solar or wind production or even to optimize distribution”. According to the same source, AI is oriented towards:
- – accumulation of digital data and increase in computing power to improve performance;
- – the search for new ways of learning similar to that of humans;
- – learning how humans work.
For example, this report cites the problem of water consumption, which can be optimized through the use of satellite analysis, sensors and automatic learning devices, even reducing water consumption by 25%. Another situation is mentioned, that of the optimal use of renewable energies, which requires better control of forecasts, if only because of the increase in wind and solar production capacity: “Smart Grid systems provide additional reliability in the integration of these intermittent renewable energies into the electricity grid, thanks in particular to intermittent production monitoring and forecasting models that use certain AI services to exploit multiple data (weather, climate and sensor data).”
In this context, according to Pagoropoulos et al. (2017), the concept of “Industry 4.0” can already be applied to the recovery of certain materials:
- – data collection via the Internet of Things (IoT): identification of “tags” (cookies) attached to objects that have a salvage value;
- – data integration facilitated by relational database management systems and database processing systems. Faced with the dizzying proliferation of data, these technologies make it possible to integrate heterogeneous data sources while specifying a data architecture that makes it possible to meet the analytical needs of the information architecture;
- – data integration in the circular economy: metadata analysis is considered a viable approach to exploit information from various recording systems such as IoT sensors to enable better decision-making. Figure 4.4 (Mazzucato 2018) highlights, one example, the interest of the circular economy (much remains to be done on this subject, however, according to (Marion 2018); see also European Commission 2019; Eurostat 2019);

Figure 4.4. An example of a circular economy
- – territorialization of production and knowledge considering regional specificities and decentralization of power and knowledge (Janneret 1994; Stephen 2015). A territory, in its dynamics, is confronted with a series of opportunities and threats that, at one time or another, guide its development choices, summon social capital and the collective intelligence of the actors (Woesner 2010). This systemic approach is difficult because it combines local and global history, optimization of material and human resources and information. While it is a question of understanding the stages of its endogenous nature on the basis of a set of actors confronted with globalization, this productive path is far from being mastered;
- – knowledge-based economy. The knowledge-based economy corresponds to the sector of production and service activities based on knowledge-intensive activities (Foray 2009; Stiglitz and Greenwald 2014; Chapon 2017; Švarc and Dabić 2017). It is linked to the imperatives of technological innovation to meet the dual need for a rapid pace of continuous innovation in new products/devices and services and to overcome waves of knowledge and technology obsolescence (Powell and Snellman 2004). This trend, which is more technological and high-tech, is favored by the contributions of digital technology and must/can take into consideration training aspects (see Volume 1); Figure 4.5 (Tostain 2016) illustrates the modes of achievement of the field;

Figure 4.5. Knowledge economy
- – service and economy of functionality. This economy is based on the sale of a performance of use and no longer on the sale of consumer goods (products, energy, materials, etc.). Its interest is to provide integrated solutions for goods and services that lead to lower consumption of resources, an increase in people’s well-being and sustainable development of the territories (Sentilhes 2016; ADEME 2017a);
- – development of new skills. Despite the increased deployment of new technologies in many production sectors, the number of jobs has not decreased, which is an apparent paradox. However, automation can replace individual manual work. Today, this idea is being extended to the digital sphere. Human-machine interactions make it possible to increase productivity, which in general leads to an improvement in consumers’ purchasing power, which stimulates global demand for goods and services and thus creates more jobs. Nevertheless, for this transition to take on its full dimension, new skills are essential (Deloitte 2017);
- – communities of actors with high interoperability. “Interoperability is the ability of a product or system, with fully known interfaces, to work with other existing or future products or systems without restriction of access or implementation. A distinction must be made between ‘interoperability’ and ‘compatibility’” (Wikipedia 2018). Interoperability between computer systems corresponds to their ability to exchange information without “translating” it. It is the condition for the cooperation of professionals moving from a silo approach to an integrated and more efficient activity;
- – innovation integrated into a continuous process essential to the competitive positioning of research, companies and their performance (Schneider and Spieth 2013; Liu et al. 2014). “Integrated innovation is the coordinated application of scientific, technological, social and business innovation to develop solutions to complex challenges” (see Figure 4.6 (GDC 2010)). Product (only) innovation is the integration of existing functions to create a new product that meets needs. For integrated innovation, Iansiti (1998) proposed a theory of technological integration, defined as the set of investigation and evaluation activities aimed at selecting all the new technical approaches to be followed in a development program; it takes into account technological aspects as well as social innovation, etc.
These are indeed systemic innovations that are expected. How do we integrate technological innovations into system solutions in which creativity, technology, training, organization, form a more or less coherent whole? How can we go beyond technology to properly consider global performance and knowledge management for industrial renewal or its “simple” adaptation to a new social paradigm? So, what research needs to be undertaken to meet these needs?

Figure 4.6. Integrated innovation
The development of new advanced production/manufacturing technologies is, in the current liberal system, a priority objective. New manufacturing processes must, as much as possible, save energy and raw materials. The target then remains the search for a financial benefit for the company. These processes are based on increasingly in-depth knowledge of transformation processes and procedures, as well as increasingly powerful information technologies (computers, sensors, interfaces, virtualization tools, rapid development tools, models that are increasingly close to reality, multidisciplinary and multi-level models, processing methods and tools). The intelligence embedded in these technologies makes it possible to obtain, in principle, very complex products, with high added value and taking into account environmental and social constraints. Products can be customized and meet the needs of individuals. Traditional industries have gained a clear competitive advantage through the use of these technologies, which reduce production times, increase productivity and supply the domestic market. In production (equipment, workshop, factory), these technologies must ensure an optimization of the joint product-process-service design on the one hand and greater controllability on the other. Industrial production systems must be responsive and become even more agile, flexible and adaptable. The time-to-market period must be shortened, as must the ramp-up. However, for some transformations, the time periods can be quite long.
DEFINITION.– Agility: “Ability to foster and respond to change in order to best adapt to a turbulent environment. It is a combination of flexibility, for expected changes and adaptability, for unexpected changes. All this tends to galvanize productivity by driving value and reducing time-to-market, while ensuring optimal quality of what is produced and stakeholder engagement” (Deloitte Digital 2015).
The performance of products and production systems must be ensured even with high variability (achievements, specifications). New ways and means of cooperation are being developed on a large scale with pilot installations and demonstrators. Industrial organizations should transform themselves to better integrate technological leaps and meet societal objectives.
4.2. Some additional elements
Process industries will gradually replace traditional raw materials with new resources. (Legrand 2018)
The demands of the market are becoming increasingly high day by day. Any economic development must take into account the following elements:
- – knowing the status of a product;
- – customizing a product;
- – tracking interventions on the product and its waste;
- – ensuring the sustainable distribution of the product;
- – allowing access to characteristic or product-related information;
- – offering new services associated with the product;
- – knowledge of risks over the entire product life cycle for operators, users and the environment;
- – knowing how to reuse raw and other materials, or even the intelligence that has been put into them for their synthesis or manufacture;
- – integrating production into an effective sustainable development framework.
Apart from the “classic” activities of “core” PE and their proliferation, it seems that some very general priorities have been identified:
- – new methodological approaches: intensification, microfluidics, molecular-level PE and nanotechnologies, additive manufacturing, object-product-oriented PE, etc.;
- – clean, safe and energy-efficient processes and raw materials; processes of scarcity (following the exhaustion of reserves, recycling);
- – processes of “hidden” chemistry (the Photomaton example);
- – processes for the production of ultra-pure products;
- – green chemistry and associated processes (biomass, biorefinery, biomimicry, etc. (Invest 2018);
- – chemistry and processes for health (from design to use including recycling);
- – recycling and waste management, including highly diluted but risky substances, strategic recovery of rare products in low concentrations; pollution treatment (air, water, soil);
- – new products and devices for energy;
- – PE of additive manufacturing;
- – co-design in the structure-functionality interface; replacement of rare products by “intelligent” structures with equivalent functionality;
- – socially responsible research, ISO 26000 and ethics;
- – anticipation of developments in standardization/normalization.
4.2.1. Some additions and considerations
By establishing as a basic axiom that innovation in the field requires the association (integration) between products and materials, André et al. (2013) envisage cooperation between chemistry, biology, PE, economists, sociologists, etc., to propose solutions that combine products and processes over the entire lifecycle (within a sustainable development framework). Figure 4.7 (Fiksel 2003) positions the “process” component within sustainable development.

Figure 4.7. Sustainable development and process engineering. For a color version of this figure, see www.iste.co.uk/schaer/process2.zip
Larger populations, economic growth and climate change are putting pressure on resources. The objective of continuous growth will lead to an increase in the consumption of these resources if nothing is changed (even implementing detection principles using artificial intelligence, according to Panja et al. 2017). Chemistry and PE can play a role in providing the necessary tools to maximize the sustainable use of resources, as well as to enable sustainable recovery, reuse and recycling in consumption cycles (Lower 2013; WCS 2017):
- – on the basis of “creative” research on new subjects that break with existing ones, it seems important to propose ways of proceeding: prospective; active monitoring; mobilization of people and resources; etc., which cannot be bypassed;
- – co-design in the structure-functionality interface; replacement of rare products by “intelligent” structures with equivalent functionality but using more common elements whose arrangement makes it possible to achieve a given functionality (potential case of nanosciences and nanotechnologies). This observation leads to the definition of “trajectories” of creative and risky research to explore couplings between structures and desired functionalities, before reaching a context closer to the relationship with the socio-economy. It is against this “trial and error” approach that it will be possible to carry out a cross-fertilization and confident combining of PE and the skills of other partners;
- – health, safety, environment: pollution aspects both inside and outside companies are necessary conditions for the establishment of a material and energy transformation plant; they involve maintenance that is as predictive as possible so that any accident can be avoided (Laurent 2011; Restoueix 2016; Vincent 2016);
- – socially responsible research (André 2013), ISO 26000 and ethics;
- – standardization: the activity, outside the context of research and innovation, must reintegrate normative aspects allowing economic development more in line with the needs of Western society. PE must therefore commit to supporting through technological progress resulting from its active interface activity to promote (if possible with its partners), the implementation of an international standardization of sustainable production that is more restrictive than those corresponding to current “ethical” standards? (alliance with the industrialists of the sector to be researched).
Materials and products are supports in services that are constantly evolving; the complexity that PE must now explore to master it (Maldonaldo and Gomez-Cruz 2012) lies in the set of products and services that are combined in varied and personalized solutions. Figure 4.9 (according to Maldonaldo and Gomez-Cruz 2012) illustrates this aspect.

Figure 4.9. The increasing complexity of engineering sciences
COMMENT ON FIGURE 4.9.– Additional elements not shown in the figure: meta-engineering (systems and software supporting engineering; meta-design and meta-methodologies); conventional engineering (“intelligent” solutions; knowledge representation); classical engineering (prediction; predictability; transparency; stability; reliability; central control); reverse problems (reuse; analysis of existing systems; reversibility; traceability; deconstruction; geometric models); systems engineering (vertical and/or horizontal integration of systems; synergies; coordination; interoperability); non-conventional engineering (“emerging” solutions; stability; feedback; controllability; observability); complex systems engineering (non-linearity; non-linear dynamic systems; uncertainty; linkability; sustainability; multi-level perspective); bio-inspired engineering (evolution dynamics; adaptability; development; self-organization; scalability; resilience; robustness; self-repair; living technology). 1) matter and energy; simple or even complicated systems; local research; exact methods; heuristics; simple solutions; 2) information and computation; complex non-linear systems; more global research; metaheuristics; solution space; 3) combining classical engineering with business problems; 4) linearization of non-linear systems; 5) inadequacy; learning; fuzzy logic; statistical methods; 6) distributed systems; connectivity; 7) flexibility.
4.3. Energies
It should be recalled that the field of material processing is a major energy consumer since it used 16.6 million tons of oil equivalent in 2014, an increase of 9% compared to 2013, according to UIC (2015). About 62% of this net consumption is related to raw material uses, the rest to energy uses (manufacturing, electricity production, heating and other uses). However, this figure must be compared with the overall consumption of fossil energy, which is around 15 billion tons of oil equivalent/year according to Cassidy (2019). However, it is important to try to be less greedy in processes (Martin 2002). The chemical sector is the largest consumer of energy relative to other sectors, as shown in Figure 4.10 (ICO 2015), supported by INSEE (2017, 2019), Schwarz and Tognola (2015) and Statista (2015).
NOTE.– According to Martin (2002):
- – 1 Toe = 107 kcal PCI or 42 GJ (PCI = lower calorific value; G = 109);
- – MTep = 106 tons of oil equivalent;
- – 1 ton of oil or petroleum products = 1 ton of oil equivalent per convention;
- – 1 ton of coal = on average 0.66 tons of oil equivalent;
- – 1 ton of lignite = on average 0.23 tons of oil equivalent;
- – 106 m3 of natural gas = 0.855 tons of oil equivalent;
- – 1 m3 of wood = 0.245 tons of oil equivalent.

Figure 4.10. Annual energy consumption of the process industries (KTep). For a color version of this figure, see www.iste.co.uk/schaer/process2.zip
Process engineering’s involvement is relatively recent in terms of energy production; most of the activity was focused on optimizing its consumption in relation to a transformation of the material. It is only recently that it is possible to engage in research and studies to define and design processes and installations related to energy systems (electricity, gas, nuclear, oil, renewable energies, etc.). In this context, it rediscovers its “traditional” know-how: the optimization of energy production, the recovery of energy waste, the reduction of consumption, while identifying technical, environmental and regulatory constraints to ensure the feasibility of the processes it wishes to implement. There are thus several disciplines such as thermal transfers, thermodynamics, fluid mechanics, heat exchangers, thermal design, renewable energies, combustion, etc. The reduction of energy consumption is an essential element in the dimensioning of a 100% renewable electricity mix. Residential consumption is the main source of electricity savings identified by ADEME (2017b), an area in which PE is not yet very active.
The concept of environment is a bio-construct. Environmental objects are therefore composite, systemic, evolving, constrained and complex (Legrand 2001); the same applies to energy from renewable sources. Appendix 3 recalls the links that may exist between PE and the environment. For Bonnet et al. (2018), the global situation of choosing and developing new forms of energy or optimizing old ones is a complex process expressed in Figure 4.11. Obviously, the position of PE research can only cover part of this whole (subject to strategic and financial disruptions).
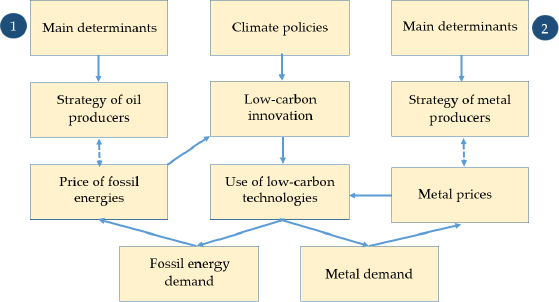
Figure 4.11. Elements and interdependencies in the geopolitics of renewable energy
COMMENT ON FIGURE 4.11.– 1) degree of economic diversification; credibility of climate policies; non-conventional hydrocarbons; risk of failed assets; social cost of oil and gas; political stability; 2) local externalities; concentration of reserves; recycling; demand from other sectors; propensity to coalition of actors; discovery of new deposits.
The Energy Roadmap for 2050 (EU 2011; JRC 2018) states that “the share of renewable energy sources (RES) increases significantly in all scenarios, reaching 55% of gross final energy consumption in 2050. The share of RES in electricity consumption reaches 64 % in the ‘high energy efficiency’ scenario and 97 % in the ‘high RES share’ scenario, which provides for a large amount of electricity storage to absorb variations in the RES supply, even when demand is low”.
But, as Figure 4.12 illustrates, there would not be much room for new energies that would use GC skills (Jacobson 2019) because they would be likely to pollute the planet. The debate remains open.

Figure 4.12. Renewable energy in 2050 according to Jacobson (2019)
COMMENT ON FIGURE 4.12.– 1) domestic photovoltaic panels (14.89%); 2) industrial solar (21.36%); 3) concentrated solar (9.72%); 4) onshore wind turbines (23.52%); 5) marine wind turbines (13.62%); 6) commercial rooftop solar panels (11.58%); 7) tidal energy (0.58%); 8) geothermal energy (0.67%); 9) hydroelectricity (4.00%); 10) underwater turbines (0.06%).
According to the Alliance nationale de coordination de la recherche pour l’énergie (ANCRE), cited by Marion (2019), “for the same amount of energy produced, wind and solar power plants require up to 15 times more concrete, 90 times more aluminum and 50 times more copper and iron than traditional fossil fuel power plants. The 6 megawatt onshore wind turbines, 170 meters high, will consume about 1,500 tons of steel and several tens of kilograms of rare earth materials, 70% more than previous technologies”.
SIA Partners (2019) indicate the major energy fields of the future without CO2: nuclear, wind and photovoltaics, which are also outside PE. Other forms exist such as solar thermal, hydropower, geothermal and biomass energy (Futura-Sciences 2014; Adelaide University 2017; De Hemptinne et al. 2017). But, by using different findings presented in this chapter, PE effectively contributes to work on energy production in specific areas.
NOTE.– Table 4.2 from McCall (2017) summarizes the relationships between the nature of materials and the nature of energy production patterns with many interdependencies, some of which will become critical due to the depletion of high metal density ores.
Table 4.2. Mineral and energy platform relationship
| Clean energy | Technology | Products | Components | Processed materials | Basic materials |
| Electricity generation | Turbines | Wind turbines | Nacelle: generator Tower Wings | Metal processing (steel) Control – command | Steel; neodymium alloys; dd dysprosium alloy Aluminum Silicon Semiconductors, copper, silver, polymeric Steel, aluminum Concrete Carbon fibers, other fibers including glass, polymers, metal |
| Energy efficiency | Lighting | LED | LED | Methyl-Gallium triage Sapphire Trimethylindium YAG dyestuffs | Gallium Sapphire Indium Yttrium oxide Copper; silver |
| Energy storage | Batteries for vehicles | Electrochemical compartments | Air conditioning | Electrolyte Anode Cathode Separator | Lithium Graphite Polypropylene Polyethylene Cobalt Nickel Copper Steel Cooling gases Copper Steel Aluminum |
IHS Markit and Energy Futures Initiative (2019) proposed, on this basis, technological support in the field of clean energy with a vision to guide innovation. This study identifies the following technologies as areas with high innovation potential:
- – storage and battery technologies;
- – small modular reactors and advanced nuclear reactors as sources of low-carbon electricity and process heat;
- – hydrogen as a clean energy carrier, as a storage medium and as a facilitator of decarbonization in the industrial and transport sectors (Béguin 2016; Australian Government 2019; NAP 2019b; Tréquouët 2019);
- – advanced manufacturing technologies;
- – energy technologies in the building sector;
- – systems: modernization of the electricity grid and smart cities;
- – large-scale carbon management as the main component of deep decarbonization: carbon capture, use and storage, solar fuels and biological carbon sequestration, etc.
These are the proposed action goals for process engineering.
4.3.1. Biomass
Figure 4.13 (Bar-On et al. 2018) represents essentially terrestrial biomass, or about 500 gigatons of carbon (compared to 11.2 gigatons used anthropogenically according to (Canadell and Carlson 2017)). Located on the surface, it potentially constitutes a very large reserve of carbon that can be exploited as long as the CO2 produced is properly recycled. However, it should be noted that we work in these “two-dimensional” conditions and not with concentrated sources (coal, oil, nuclear), which generally leads to higher operating costs compared to today’s conventional energy systems.

Figure 4.13. Potentially available biomass (in gigatons of carbon equivalent). For a color version of this figure, see www.iste.co.uk/schaer/process2.zip
Biomass, mainly of vegetable origin, can be a source of heat, electricity or fuel from various processes such as direct combustion, gasification, pyrolysis or, for example, methanization (Aro 2016). It has the advantage of local production, but the disadvantage of a modest surface density compared to conventional sources such as gas, coal or oil. Biomass comes from various sectors and materials such as wood, crops (grown especially for energy production), agricultural and forestry residues, food waste and organic materials from municipal and industrial waste (EU 2012). Biomass energy includes (Futura-Sciences 2014):
- – the historical source of wood (Cazzaniga et al. 2019). It can produce heat, electricity or biofuels (hydrolysis of cellulose to glucose, then fermentation to ethanol) (see Dufour 2016; Mellouk 2007). According to the University of Michigan (Umich 2015), the world’s forests cover 3.4 billion hectares (see Figure 4.14). But every year, 16 million hectares disappear. Today, forests cover more than a quarter of the world’s total land area (excluding the polar regions). Just over 50% of the forests are in the tropics and the rest are in temperate and boreal areas (northern coniferous forests). Wood is a historical energy base that is gaining interest for economic and environmental reasons. The exploitation of this wood is already a complex process, as illustrated by JRC (2019). The analysis of woody biomass flows in the forest sector illustrates material and energy practices along a differentiated value chain, by feeding wood processing industries for the manufacture of products or being used for energy production. “Industrial wood processing generates by-products or co-products that are in turn used as inputs”;

Figure 4.14. Global forest deposit. For a color version of this figure, see www.iste.co.uk/schaer/process2.zip
- – biofuels, liquid or gaseous, derived from the processing of plants such as rapeseed or beet (first generation: (Naik et al. 2010; Mohr and Raman 2013)), derived from cellulosic materials (second generation: (Schenk et al. 2008; WB 2010))) or derived from microorganisms such as microalgae (third generation: (Schmidt and Dauenhauer 2007; Cogne et al. 2011; Chailleux et al. 2012; Olkiewicz et al. 2015; Correra et al. 2017)). These different processes are direct applications of PE knowledge in the transformation of matter and energy. However, it should be taken into account that in 2050, the planet is expected to be populated by 9.8 billion people with an increase in the amount of food per capita (about 50%) linked to the increase in purchasing power. This constraint must be taken into account in relation to energy production via biomass (WRI 2018; Choi et al. 2019).
4.3.2. Electrochemistry, photochemistry
For many years, researchers have been trying to use CO2 cost-effectively in order to transform it into substances of chemical interest (as nature does with photosynthesis) or energy. Many processes exist, but have not resulted in doing better than Nature (see, for example, Weng et al. 2016; Rao et al. 2017; Takeda 2017, etc.). The other route consists of hydrogen production by photosynthesis or photo-catalysis (see, for example, Graetzel et al. 2012; Ismail and Bahnemann 2014; Colon 2016; Meloni et al. 2016; Torres-Martínez et al. 2017; EU 2019, etc.). As long as process efficiencies (which are progressing) do not represent an industrial interest, it is unlikely that PE will take them seriously.
4.3.3. Storage of electrical energy
Since energy from renewable sources is not constant and cannot be controlled, it is essential to be able to store the electrical energy produced when Renewable Energy Systems (RES) are available for use when they are not. Advanced technologies such as energy storage systems with superconductors, super capacitors, batteries (Alotto et al. 2014), hydrogen storage, compressed air storage, hybrid renewable energy power plants and hydro-pumped storage are developing (EU 2012). It is the field of batteries, in which transport–reactivity coupling is of great importance, that is of interest to PE researchers. Figure 4.15, from Alotto et al. (2014), illustrates the state of the situation in terms of storage:

Figure 4.15. Relationships between storage power and duration
COMMENT ON FIGURE 4.15.– 1) lead battery; 2) sodium-sulfur battery; 3) lithiumion battery; 4) fuel cell; 5) double layer electrical capacity; 6) super-capacitor magnetic storage; 7) electrochemical storage; 8) flywheel storage (8a) laboratory stage; 9) thermal storage; 10 and 10a) compressed gas storage; 11) hydraulic pump storage; 12) redox flow batteries with electrolytic membranes.
For the most part, it is the electrochemical component that involves PE (Lapicque et al. 1994; Poizot and Dolhem 2011; Lapicque et al. 2016). Figure 4.16, by Alotto et al. (2014), highlights the transport–reactivity coupling phenomena, particularly in the vicinity of the membrane.

Figure 4.16. Transport-reactivity coupling in an electrolytic system for energy
4.3.4. Processes related to negative greenhouse gas emissions
NAP (2019a) in its report on this topic, provides an overview and proposes directions for action to reduce greenhouse gas emissions. Some of the proposals are written in the short term as:
- – carbon storage in plants (including trees) and sediments;
- – the change in certain agricultural practices;
- – the use of biomass for energy;
- – CO2 sequestration: its concentration from emission sources for landfilling or electrochemical transformation into carbon (Esrafilzadeh et al. 2019);
- – carbon dioxide mineralization (see NAP 2019a).
These accessible technologies leave a large place for PE, especially since the experts who contributed to this publication estimate the cost of CO2 transformation at less than 100 dollars/ton. There is all the more “wheat to grind” as these R&D and industrialization axes can only be deployed if essential environmental concerns have been resolved:
- – forests established at high altitudes reduce albedo, inducing a net warming despite the cooling caused by the absorption of CO2 by vegetation;
- – forests established in regions with low rainfall could have effects on river flows and on water resources in general;
- – the competition between biomass energy and food must be regulated, especially with a growing world population;
- – the use of biomass for energy can be associated with the production of chemicals and materials for use (Stafford et al. 2017);
- – for sequestration, mineral extraction could correspond to large quantities of waste rock with risk of contamination of water and/or soil;
- – with increased agricultural productivity, there is a risk of increased emissions of other greenhouse gases such as methane and nitrogen oxides. A realistic compromise must therefore be found between the production of utilities and associated pollution, even if the base of the material has ecological foundations (NAP 2019a);
- – air capture and CO2 mineralization options require significant energy input (energy over-consumption). Direct capture requires between 5 and 10 GJ/ton of CO2 (which corresponds to the combustion of about 300 liters of gasoline and 1 ton of CO2);
- – Moreover, as Figure 4.18 also from Stafford et al. (2017) shows, biomass energy is not free of defects.

Figure 4.18. Comparison of the different forms of energy in terms of pollution
COMMENT ON FIGURE 4.18.– 1) diesel; 2) petroleum; 3) GLP; 4) hybrid-electric; 5) natural gas; 6) electricity; 7) bio-diesel; 8) ethanol; 9) biogas; 10) hydrogen and electricity.
4.3.5. Energy and raw materials
By comparing the technologies needed to fight climate change with the technologies currently in use, researchers conclude that solar, wind and fuel cells are technologies that require higher consumption of several metals.
The World Bank concludes that demand could increase for aluminum (including its key constituent, bauxite), cobalt, copper, iron ore, lead, lithium, nickel, manganese, platinum group metals, rare earth metals (including cadmium), molybdenum, neodymium and indium silver, steel, titanium, zinc. “For example, the effect of greater fuel cell use is significant and could mean a 1,000 percent increase in demand for some metals such as nickel and lithium” (WB 2017).
4.3.6. Consequences in terms of a low-carbon industry
Fleiter (2019) proposes – in the context of avoiding the production of greenhouse gases – alternative technologies for the transformation of matter using hydrogen, electricity, etc. The value of this report lies in the positioning of emerging technologies in terms of TRL (technology readiness level), illustrating possible paths, based on financial reports. All PE unit operations are affected by this analysis. This is part of the work on energy such as that proposed by WEF (2019b) and ETC (2018) and summarized in Figure 4.20 (which also analyzes the energy situation and its transition to lower carbon emissions country by country).

Figure 4.20. Process-energy relations
COMMENT ON FIGURE 4.20.– 1) photovoltaic; 2) electric vehicles; 3) lighting, data centers and networks; 4) onshore and offshore wind turbines, hydro turbines, bio-energy, nuclear; 5) smart-grids, hydrogen, digitization, energy storage; 6) oil saving in vehicles, maritime transport and rail; 7) air conditioning and building equipment; 8) chemicals, metals (including iron and aluminium), cement, pulp and paper; 9) ocean, geothermal, concentrated solar, CO2 sequestration; 10) renewable heat; 11) biofuel, electric aviation; 12) heating, insulation; 13) sequestration and frugal processing industries.
80% of the environmental impact of a product, service or system is determined at the design stage […]. So design can help reverse this trend by rethinking the processes behind the manufacture of products, as well as the resources used to manufacture or use them. (Thackara 2006)
Design thinking, on the other hand, tries to find a balance between the points of view of users, technology and companies, it is also integrative […]. It is imbued with design ideas, but with an ethic focused on people and sustainability. (Brown 2009)
4.4. Life Cycle Assessment (LCA)
The purpose of Life Cycle Assessment (LCA) is to know and be able to compare the environmental impacts of a system (of any kind) throughout its lifecycle, from the extraction of raw materials required for its manufacture to its end-of-life treatment (landfilling, recycling, etc.), including its use, maintenance and transport phases (Belboom and Leonard 2016; ADEME 2018; Stewart et al. 2018; CDD 2019). LCA thus makes it possible:
- – “to quantify contributions to the environmental impacts of a system (by lifecycle stage or subsystem: components, materials used, processes) in order to identify ways to eco-design or improve the system’s environmental performance;
- – to compare, from an environmental point of view, two systems with the same function, with the same amount of service rendered (see the notion of functional unit)” (Wikipedia 2019).
It is an interesting and particularly useful tool to judge the interest of a new process from different points of view, particularly from an environmental point of view. The LCA method makes it possible to compare technologies with each other, from resource extraction to dismantling at the end of their life (from cradle to grave) and thus strengthens the innovation process before construction. It also makes it possible to identify the weak points of a system, to facilitate the implementation of regulations or to eco-label products with the most moderate environmental footprint. Its global approach avoids pollution transfer from one design phase to another (Becaert et al. 2010). The main rules of environmental design are (Becaert et al. 2010):
- – reducing, optimizing or substituting the use of non-renewable raw materials;
- – reducing energy consumption or substituting its use by renewable energy sources;
- – minimizing the risk of exposure to humans and nature to hazardous substances (for example, indoor air quality has a direct influence on the cognitive abilities of employees in offices. When the organization of space meets the rules of sustainable development and ventilation is well provided, workers’ productivity increases significantly (Combe 2018).
An LCA thus consists of determining all the elementary flows that exist between the technosphere (human activities) and the natural environment, then quantifying the associated environmental impacts (climate change, ozone depletion, eutrophication, etc.).
4.4.1. Life Cycle Assessment limitations
The results of an LCA are directly correlated with the geographical location considered (see for example Becaert 2010, 2011; Levasseur 2011; Micheaud 2011; Bayon 2012; Mendes da Luz et al. 2018). Indeed, the specific characteristics of a country, such as the energy mix, are fundamental components to be taken into account, which makes the results generally non-exportable. They also depend heavily on the basic assumptions. LCA assesses potential, not actual, impacts. Indeed, we do not know the spatial or temporal data of the emissions, which is possible in a risk analysis approach. The results of an LCA cannot therefore be considered as legally binding. LCA is a complex process that requires a lot of information. It is often essential to have access to databases or even specialized software (such as “Simapro” or “GaBi”). Nevertheless, some data remain unavailable (confidential, difficult to use, etc.) requiring validation by independent experts as stipulated in ISO standards 14040 and 14044, which define rules and good practice in the field.
4.4.2. Life Cycle Assessment methodology
The first step in an LCA is to define the purpose of the study and how it will be conducted to achieve the outcome. We must specify:
- – the functional unit (FU): in the case studied by Bayon (2012), it was a question of “producing 1 kWh of electricity from a 2 MW offshore wind turbine”;
- – the system of products to be studied: it consists of a set of elementary processes linked by flows of matter and energy that perform one or more functions. The product system consists of several elementary processes (combined steps that lead to the achievement of the objective). These processes are linked to the environment through elementary flows (resources entering the system, substances emitted) as shown in Figure 4.21. Note the importance of the system boundaries that isolate the case studied from the rest of the “technosphere” and specify the level of detail desired. The process tree is the global schema that defines the study framework and links the different phases together;

Figure 4.21. Elementary boundary and processes of a product system
- – a lifecycle inventory is then carried out: it quantifies the flow of materials, energy and pollutants into and out of the system during the lifecycle. Specific databases provide emission and extraction factors per unit of elementary flow. It is therefore possible to multiply the masses of the flows listed by these factors, which leads to total emission and extraction flows that can be used during impact assessment (Becaert 2010; Rajagopal 2018).
An important phase of the work consists of scaling the data, which informs the extent of the stress on each elementary process in its contribution to the functional unit (for example, in the case treated, concrete for the foundations will be counted once for an average lifetime of the turbine of 20 years, while the lubricating oil used during maintenance will be taken into account each year).
Once emissions and the quantity of resources extracted from the environment have been established, an attempt is made to assess the impact of pollutants and phenomena on the natural environment. This is achieved using a Life Cycle Impact Assessment (LCIA) method that moves from previously calculated impact categories to broader and more representative categories, thus assessing the magnitude and importance of the environmental consequences of the system under consideration (see Figure 4.22). There are different levels of impact characterization: the “problems” category is located in the middle of the chain of causes and effects (mid-point) while the “damage” category translates the consequences at the end of the chain (end point), so they are directly observable (human health, ecosystem quality, for example). Figure 4.22 (Micheaud 2011) shows the transition from the inventory to the various categories studied:

Figure 4.22. General approach to impact assessment
4.4.3. Environmental mechanism: cause-and-effect chain (Becaert 2010)1

Figure 4.23. Cause-and-effect chain in an LCA
Although the damage approach facilitates external communication, it creates more uncertainty in its implementation. Intermediate characterization factors allow impacts to be located at a mid-point scale, in the middle of the cause-and-effect chain. They convert the results of the lifecycle inventory analysis into a common category indicator unit. This brings us back to a given environmental impact category. For example: ozone depletion, aquatic acidification, human toxicity, etc. An intermediate impact score is obtained by multiplying the mass emitted or extracted by these factors and summing the total mass in each intermediate category as follows, as expressed by Jolliet et al. (2005):
with:
- – SIi intermediate impact score associated with category i (in kg equivalent of the reference substance);
- – ms mass of substance emitted or extracted;
- – FIs,i, intermediate characterization factor of the substance s in intermediate category i.
The damage caused to the biosphere (end point level) is quantified in a similar way according to the expression of Jolliet et al. 2005:
with:
- – SDd the damage characterization score for category d (in kg equivalent of the reference substance);
- – ms the mass of the substance s emitted or extracted;
- – FDn,d the damage characterization factor linking damage category d to substance s.
There are different methods of impact assessment in the literature. Some are a direct result of the activities studied (CFC emissions, etc.), others are more consequence-oriented (such as the destruction of stratospheric ozone that causes diseases such as cataracts or cancer). This is the case for EDIP (Denmark), LUCAS (Canada) or the CML method established by the University of Leiden (Netherlands), etc. “Damage” methods go as far as possible in the cause-and-effect chain and are translated into easily understandable categories, even for people who are not experts in scientific matters. This is the case with the Eco-Indicator 99 method (Netherlands) (Becaert 2010). The most complete method is certainly Impact 2002+ (Switzerland) since it considers both “problem” and “damage” impacts. Table 4.4 (Jolliet 2005) illustrates the transition from inventory results to the different categories considered.
An important phase of an LCA is the interpretation of the results. This is a delicate phase that relies heavily on initial assumptions and simplifications. This is why it is always important to highlight them well, in order to avoid misinterpretation. We can start by targeting the hot spots that correspond to the lifecycle stages that have the greatest impact on the environment. Then, a sensitivity analysis allows us to test the robustness of the results by modifying the initial parameters (Micheaud 2011).
Table 4.4. Impact 2002++ method: from global to local
| Categories of damage | Median category |
| Human health | Toxicity Respiratory effects Ionizing radiation Depletion of the ozone layer Photochemical oxidation |
| Ecosystem quality | Water ecotoxicity Terrestrial ecotoxicity Water and soil acidification Aquatic eutrophication Land use Depletion of the ozone layer Photochemical oxidation |
| Climate change | Global warming |
| Resources | Non-renewable energy sources Mining of ores |
- 1 See Figure 4.23.