
PuppetDB ecosystem provides web dashboards that definitely help user interaction:
- PuppetDB comes with an integrated performance dashboard
- Puppetboard is a web frontend that allows easy and direct access to PuppetDB data
PuppetDB integrates a performance dashboard out of the box; we can use it to check how the software is working in real time. It can be accessed via HTTP at the URL http://puppetdb.server:8080/pdb/dashboard/index.html if you set host = 0.0.0.0 on the PuppetDB configuration. Remember that you should limit HTTP access to unauthorized clients only, either by firewalling the host's port or setting host = localhost and having a local reverse proxy where you can manage access lists or authentication:
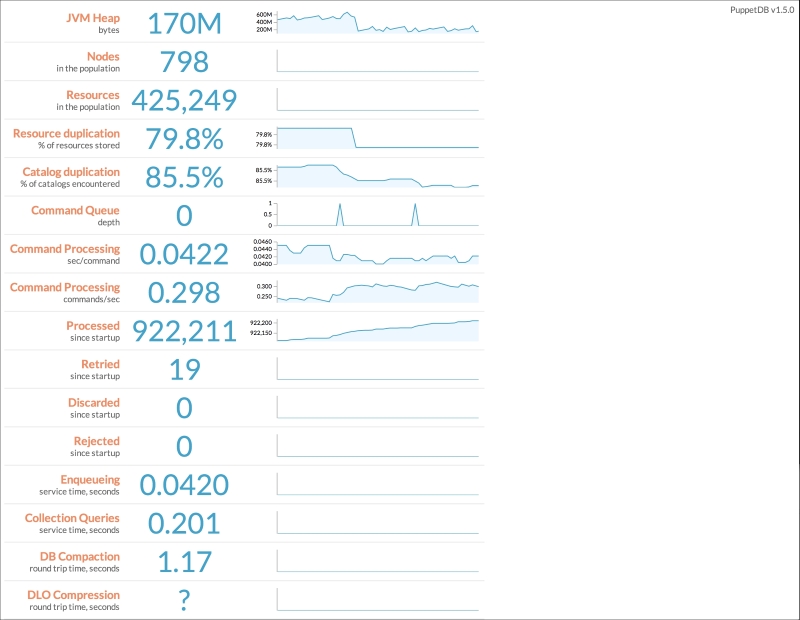
The PuppetDB performance dashboard
From the previous picture, the most interesting metrics are as follows:
- JVM Heap memory usage: It drops when the JVM runs a garbage collection.
- Nodes: The total number of nodes whose information is stored on PuppetDB.
- Resources: The total number of resources, present in all the catalogs stored.
- Catalog duplication: How much the stored catalogs have in common.
- Command queue: How many commands are currently in the queue; this value should not be constantly greater than a few units.
- Command processing: How many commands are delivered per second.
- Processed: How many commands have been processed since the service started.
- Retried: How many times commands submission has been retried since startup. A retry can be due to temporary reasons. A relatively low figure here is physiological; if we see it growing, we are having ongoing problems.
- Discarded: How many commands have been discarded since startup after all the retry attempts. Should not be more than zero.
- Rejected: How many commands were rejected and delivery failed since startup. Should not be more than zero.
The amount of information stored on PuppetDB is huge and precious, and while it can be queried from the command line, a visual interface can help users explore Puppet's data.
Daniele Sluijters, a community member, started a project that has quickly become the visual interface of reference for PuppetDB: Puppetboard is a web frontend written in Python that allows easy browsing of nodes' facts, reports, events, and PuppetDB metrics.
It also allows us to directly query PuppetDB, so all the example queries from the command-line we'll see in this chapter can be issued directly from the web interface.
This is a relatively young and quite dynamic project that follows PuppetDB's APIs evolution; check its GitHub project for the latest installation and usage instructions: https://github.com/nedap/puppetboard.