
Chapter 10: Intelligent Query Processing
This chapter covers intelligent query processing—a family of features whose purpose is to improve the performance of existing workloads with no application changes or minimal implementation effort. Originally, SQL Server 2017 introduced three of those features under the name of adaptive query processing, and several features have been added to the latest two releases, up to SQL Server 2022. One of those features, memory grant feedback, has been improved with every release.
In general, you can make these features available by enabling the applicable database compatibility level for the database, which could be either 140, 150, or 160 for SQL Server 2017, SQL Server 2019, and SQL Server 2022, respectively. However, as of SQL Server 2022, some of the new features require the query store to be enabled, for example, to persist the information of queries and plans. Every intelligent query processing feature can be disabled if you found a problem or a performance regression, either at the database level by changing the database compatibility level, or at the query level by using a specifically documented hint.
At this moment, intelligent query processing covers 13 features, and we will cover the most important ones in this chapter, including memory grant feedback persistence and percentile, cardinality estimation feedback, the degree of parallelism feedback, interleaved execution, table variable deferred compilation, adaptive joins, and query compilation replay. You can refer to the official SQL Server documentation for more details about these features or other additional intelligent query processing features.
In this chapter, we will cover the following topics:
- Overview of intelligent query processing
- Parameter-sensitive plan optimization
- Memory grant feedback
- Cardinality estimation feedback
- Degree of parallelism feedback
- Interleaved execution
- Table variable deferred compilation
- Adaptive joins
Overview of intelligent query processing
As mentioned in the previous chapter, it is strongly recommended that you enable the query store to get help on troubleshooting query performance problems. In addition, starting with SQL Server 2022, the query store is required to persist the information of queries and plans for some of the new intelligent query processing features. Figure 10.1, which is taken from the official SQL Server documentation, shows all of these features, including the version of SQL Server on which they were released:

Figure 10.1 – The features of intelligent query processing
As suggested earlier, a specific compatibility level is required to enable most of these intelligent query processing features. Table 10.1 shows a summary of the database compatibility level required for the features introduced with SQL Server 2022. In addition, cardinality estimation feedback, memory grant feedback persistence and percentile, compilation replay, and the degree of parallelism feedback require the query store to be enabled. Approximate percentile, query compilation replay, and the degree of parallelism feedback are enabled automatically in SQL Server 2022 with any database compatibility level. This is summarized in Table 10.1:

Table 10.1: The minimum compatibility level requirement of SQL Server 2022 features
As expected with any SQL Server feature, all intelligent query processing features introduced with SQL Server 2017 and SQL Server 2019 are available in the later versions, assuming their corresponding database compatibility level has been enabled. However, as of SQL Server 2022, one feature, memory grant feedback, includes the enhancement from the last two releases earlier, even with the original compatibility level of 140. More details on memory grant feedback will be discussed next.
Finally, all of these intelligent query processing features are available on any edition of SQL Server. As a reminder, although not directly related to intelligent query processing features, as covered earlier in the book starting with SQL Server 2016 Service Pack 1, for the first time in the product history, SQL Server provided a consistent programmability surface area for developers across all SQL Server editions. This means that previously existing Enterprise Edition-only features, such as in-memory OLTP, columnstore indexes, partitioning, database snapshots, compression, and more, were made available to any edition of SQL Server.
Parameter-sensitive plan optimization
Without a doubt, one of the most important intelligent query processing features introduced with SQL Server 2022 is parameter-sensitive plan optimization. Parameter-sensitive plan optimization was covered in detail in Chapter 8, Understanding Plan Caching, where we also covered parameter sniffing. As we learned, getting an execution plan tailored to the current parameters of a query naturally improves the performance of your applications. This saves optimization time and CPU resources because the query does not need to be optimized again. However, although the query optimizer and the plan cache work well together most of the time, some performance problems can occasionally appear.
Given that the query optimizer can produce different execution plans for syntactically identical queries, depending on their parameters, caching and reusing only one of these plans may create a performance issue for alternate instances of this query that would benefit from a better plan. Parameter-sensitive plan optimization helps with this problem by automatically enabling multiple active cached plans for a single parameterized statement. A different cached plan could be used depending on the parameter and expected data size. For more details about parameter-sensitive plan optimization, please refer to Chapter 8, Understanding Plan Caching.
Memory grant feedback
The memory grant feedback feature was introduced with SQL Server 2017 and has been improved and enhanced in the following two releases. The original release was memory grant feedback for batch mode, and its row mode version was introduced in SQL Server 2019. This feature helped to adjust memory grant sizes for both batch and row mode operators. SQL Server 2022 improves on this feature by adding persistence and percentile capabilities.
Let’s start by explaining why this feature is needed. We need to remember that SQL Server uses the buffer pool to store the pages read from disk, and this memory buffer pool uses most of the memory available to a SQL Server instance. However, a memory grant is additional memory that is allocated to a query, and it is only required for operations such as sorting or hashing. This additional memory is only required for the duration of the query. Sorting and hashing operations were covered in Chapter 4, The Execution Engine, where we indicated that memory is required to store the rows to be sorted by the Sort operator, or to store the hash data of Hash Join and Hash Aggregate operations. As a reminder, a hash join requires two inputs, the build input and the probe input, but only the former requires memory. In some very rare cases, a memory grant is also required for parallel plans with multiple range scans.
As you might have guessed, finding the adequate size for a memory grant will be estimated by the query optimizer. Getting an incorrect estimation can lead to two different performance problems. First, underestimating a memory grant will lead to a query not having enough memory and needing to use disk space on tempdb, in other words, performing expensive spills to disk, which will also lead to additional query processing. Second, overestimating the required memory will lead to memory waste, and such wasted memory can lead to reduced concurrency, especially when this overestimation is happening in multiple queries at the same time. Although the processes obtaining the excessive memory grant will perform as expected, other processes requesting memory might have to wait until some memory is released.
Persistence and percentile
SQL Server 2022 has improved the memory grant feedback feature in a couple of ways. The original memory grant feedback feature, either batch or row, was adjusted in size based only on the most recent query execution, that is, the most recently used grant. In addition, in the first two releases, the memory grant feedback was usually disabled for parameter-sensitive queries.
The second limitation was that this memory grant size adjustment was only stored in the query plan inside the plan cache. So, if the plan was evicted from the cache, the memory information was lost and the memory grant feedback process would have to start again, impacting the performance of the first executions. As covered in Chapter 8, Understanding Plan Caching, a plan can be evicted from the plan cache for multiple reasons including memory pressure or by executing several commands. In addition, some operations or commands can clear the entire plan cache for a database or SQL Server instance. Two examples could be a database failing over within an availability group or a SQL Server instance being restarted.
SQL Server first improves on the original feature by persisting the memory grant size information along with other query information in the query store. In this way, the grant information will survive across cache evictions or even server restarts. In the second improvement, the memory grant adjustments are now based on the recent history of executions, instead of just the most recently used grant. SQL Server inspects the entire history of memory grant adjustments and will consider the 90th percentile of it, plus an additional buffer.
Although using a history of grant adjustments can make almost every query execution easier and reduce or eliminate spills to disks, it can also waste memory in cases when only a small amount of memory is needed, as we will see in the following example. For this example, we might need more data than is available on AdventureWorks2019. So, let’s use the same table and test the stored procedure, as we did in Chapter 8, Understanding Plan Caching, so we can show big memory variations:
CREATE TABLE dbo.SalesOrderDetail (
SalesOrderID int NOT NULL,
SalesOrderDetailID int NOT NULL,
CarrierTrackingNumber nvarchar(25) NULL,
OrderQty smallint NOT NULL,
ProductID int NOT NULL,
SpecialOfferID int NOT NULL,
UnitPrice money NOT NULL,
UnitPriceDiscount money NOT NULL,
LineTotal money,
rowguid uniqueidentifier ROWGUIDCOL NOT NULL,
ModifiedDate datetime NOT NULL)
Run the next INSERT statement exactly as it is:
INSERT INTO dbo.SalesOrderDetail (
SalesOrderID,
SalesOrderDetailID,
CarrierTrackingNumber,
OrderQty,
ProductID,
SpecialOfferID,
UnitPrice,
UnitPriceDiscount,
LineTotal,
rowguid,
ModifiedDate)
SELECT * FROM Sales.SalesOrderDetail
WHERE ProductID = 897
-- WHERE ProductID = 870
-- GO 10
This will only insert two rows with ProductID 897. Now change the last three lines to look like the following:
-- WHERE ProductID = 897
WHERE ProductID = 870
GO 10
This will insert all of the records with ProductID 870 10 times for a total of 46,880 rows. Now we will create our test procedure:
CREATE OR ALTER PROCEDURE test (@pid int)
AS
SELECT * FROM dbo.SalesOrderDetail
WHERE ProductID = @pid
ORDER BY OrderQty
Since the persistence and percentile improvements have been incorporated into the original memory grant feedback release, you need at least a compatibility level of 140. Additionally, we need to enable the query store:
ALTER DATABASE AdventureWorks2019 SET COMPATIBILITY_LEVEL = 160
ALTER DATABASE AdventureWorks2019 SET QUERY_STORE = ON
ALTER DATABASE AdventureWorks2019 SET QUERY_STORE CLEAR ALL
Use the following code to start with a clean buffer pool and a clean plan cache:
DBCC FREEPROCCACHE
DBCC DROPCLEANBUFFERS
You could start testing the feature by running a few executions of our test procedure. For example, let’s start with ProductID 897, which only returns a couple of rows:
EXEC test @pid = 897
You could inspect the graphical or XML plan to look for the memory grant information. Although your values might vary, you will get something similar to the following:
<MemoryGrantInfo SerialRequiredMemory=”512” SerialDesiredMemory=”544” RequiredMemory=”512” DesiredMemory=”544” RequestedMemory=”1024” GrantWaitTime=”0” GrantedMemory=”1024” MaxUsedMemory=”16” MaxQueryMemory=”195760” LastRequestedMemory=”0” IsMemoryGrantFeedbackAdjusted=”No: First Execution” />
In addition to all the memory information, we will inspect the value of IsMemoryGrantFeedbackAdjusted. In this case, “No: First Execution” means that the memory grant feedback did not adjust the memory, as this is the first optimization and execution. Run it a second time:
EXEC test @pid = 897
This time, we get the following:
<MemoryGrantInfo SerialRequiredMemory=”512” SerialDesiredMemory=”544” RequiredMemory=”512” DesiredMemory=”544” RequestedMemory=”1024” GrantWaitTime=”0” GrantedMemory=”1024” MaxUsedMemory=”16” MaxQueryMemory=”208192” LastRequestedMemory=”1024” IsMemoryGrantFeedbackAdjusted=”No: Accurate Grant” />
Now, IsMemoryGrantFeedbackAdjusted shows that this is an accurate grant, so there is no need to trigger the memory grant feedback yet. Now let’s run the version returning 46,880 rows:
EXEC test @pid = 870
As expected, the current memory grant will not be enough to run this query, and we will get the following warning on the Sort operator:
Operator used tempdb to spill data during execution with spill level 1 and 1 spilled thread(s), Sort wrote 452 to and read 452 pages from tempdb with granted memory 1024KB and used memory 1024KB
The plan, showing the Sort warning, can be seen in Figure 10.2:
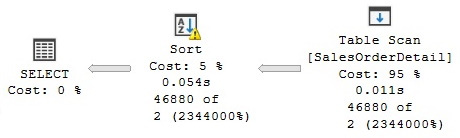
Figure 10.2 – Sort with a spill to tempdb
Additionally, you could inspect the Warnings element on the XML plan, which contains all the information about the previous warning:
<Warnings>
<SpillToTempDb SpillLevel=”1” SpilledThreadCount=”1” />
<SortSpillDetails GrantedMemoryKb=”1024” UsedMemoryKb=”1024” WritesToTempDb=”452” ReadsFromTempDb=”452” />
</Warnings>
If you run this query once more, you will get additional memory and the warning on the Sort operator will disappear.
Finally, and as expected for our extreme example, once the memory grant is stable, running our original test, which only returns two rows, will get us a warning on the SELECT operator:
EXEC test @pid = 897
This results in the following output:
The query memory grant detected “Excessive Grant”, which may impact the reliability. Grant size: Initial 8056 KB, Final 8056 KB, Used 16 KB
In the same way as before, the following warning can be seen on the XML plan:
<Warnings>
<MemoryGrantWarning GrantWarningKind=”Excessive Grant” RequestedMemory=”8056” GrantedMemory=”8056” MaxUsedMemory=”16” />
</Warnings>
Let’s try a new exercise with multiple executions to inspect the value of IsMemoryGrantFeedbackAdjusted. Run the following code to start a clean test:
ALTER DATABASE AdventureWorks2019 SET QUERY_STORE CLEAR ALL
DBCC FREEPROCCACHE
DBCC DROPCLEANBUFFERS
Run the following to execute our test procedure with two different parameters:
EXEC test @pid = 897
GO 2
EXEC test @pid = 870
GO 3
EXEC test @pid = 897
GO 3
Look up the IsMemoryGrantFeedbackAdjusted value on the eight resulting execution plans, which might be easier to see on the XML plan. You might get something like the following, where each entry corresponds to each different plan in order:
IsMemoryGrantFeedbackAdjusted=”No: First Execution”
IsMemoryGrantFeedbackAdjusted=”No: Accurate Grant”
IsMemoryGrantFeedbackAdjusted=”No: Accurate Grant”
IsMemoryGrantFeedbackAdjusted=”Yes: Adjusting”
IsMemoryGrantFeedbackAdjusted=”Yes: Stable”
IsMemoryGrantFeedbackAdjusted=”Yes: Stable “
IsMemoryGrantFeedbackAdjusted=”Yes: Stable “
IsMemoryGrantFeedbackAdjusted=”No: Percentile Adjusting “
IsMemoryGrantFeedbackAdjusted=”No: Percentile Adjusting “
As mentioned earlier, “No: First Execution” means that the memory grant feedback did not adjust the memory as this is the first optimization and execution. When we try the second execution with the same parameter, we now get “No: Accurate Grant”, which means that this is an accurate grant, so there is no need to trigger the memory grant feedback yet. Bear in mind that these two first executions only return two rows each.
However, when we use the parameter of 870, which returns 46,880 rows each, things change a bit. First, “Yes: Adjusting” means that the memory grant feedback has been applied and could be later adjusted. On the other side, “Yes: Stable” means that the granted memory is now stable.
Finally, when we run again the procedure with the parameter of 897, we can see that the memory grant percentile-adjusting feature has been triggered. This memory grant feedback process will continue until it gets to a stable point.
Although we tested this feature with two extreme examples, while implementing the feature in your environment, you should validate that, in fact, you are getting the required memory and are not getting SpillToTempDb warnings. If you need to disable any or both of those features, you can use the following statements for memory grant feedback persistence and percentile, respectively:
ALTER DATABASE SCOPED CONFIGURATION SET MEMORY_GRANT_FEEDBACK_PERSISTENCE = OFF
ALTER DATABASE SCOPED CONFIGURATION SET MEMORY_GRANT_FEEDBACK_PERCENTILE = OFF
With that, we have learned all about memory grant feedback. Now we will move on to another new core SQL Server 2022 feature, that is, cardinality estimation feedback.
Cardinality estimation feedback
As mentioned in Chapter 6, Understanding Statistics, the cardinality estimator estimates the number of rows to be processed by each operator in a query execution plan. Similar to the concept of memory grant feedback, and also based on the query store, cardinality estimation feedback is another intelligent query processing feature introduced with SQL Server 2022, which can learn and adjust based on the history of previous query executions. As we learned in Chapter 6, Understanding Statistics, the cardinality estimator uses different model assumptions to perform cardinality estimations. In addition, starting with SQL Server 2014, SQL Server has two different cardinality estimators to choose from.
The cardinality estimator feedback feature works by analyzing repeating queries. If an existing model assumption appears incorrect or produces a suboptimal query plan, the cardinality estimator will identify and use a model assumption that better fits a given query and data distribution. The cardinality estimator feedback is based on USE HINT query hints. Now, let’s look at an example; later, we will show you the model assumptions covered in the current release of the cardinality estimator feedback feature.
So, AdventureWorks2019 might not have the size or complexity for a good example, but let me show you the concept anyway. We will take a look at the so-called correlation model assumptions. We analyzed the following query in the cardinality estimator section of Chapter 6, Understanding Statistics, where we saw how two different models provided two different cardinality estimates, of the 388.061 and 292.269 rows, for the old and new cardinality estimator, respectively.
Let’s review this again. Test this with the old cardinality estimator and validate an estimated value of 292.269 rows, as shown in Figure 10.3:
ALTER DATABASE AdventureWorks2019 SET COMPATIBILITY_LEVEL = 110
SELECT City, PostalCode FROM Person.Address WHERE City = 'Burbank' OR PostalCode = '91502'
Try the new cardinality estimator on the same query and validate 388.061:
ALTER DATABASE AdventureWorks2019 SET COMPATIBILITY_LEVEL = 160
SELECT City, PostalCode FROM Person.Address WHERE City = 'Burbank' OR PostalCode = '91502'
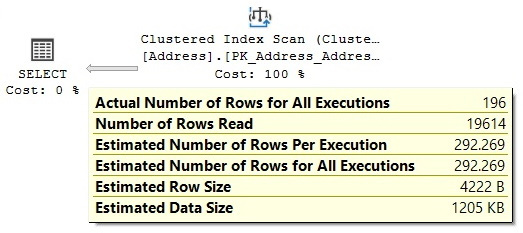
Figure 10.3 – Cardinality estimator model assumption
Essentially, this means that the cardinality estimator applies two different models, out of a total of three possibilities for correlation model assumptions. You can force any of those three models using a hint such as in the following three queries. You might not want to use these hints directly in your code, so I include them here just for illustration purposes. You can test the following code using a compatibility level of 160 and validate their three different estimations for the same query predicates:
SELECT City, PostalCode FROM Person.Address WHERE City = 'Burbank' OR PostalCode = '91502' -- estimates 388.061
OPTION(USE HINT('ASSUME_FULL_INDEPENDENCE_FOR_FILTER_ESTIMATES'))SELECT * FROM Person.Address WHERE City = 'Burbank' OR PostalCode = '91502' -- estimates 292.269
OPTION(USE HINT('ASSUME_PARTIAL_CORRELATION_FOR_FILTER_ESTIMATES'))SELECT City, PostalCode FROM Person.Address WHERE City = 'Burbank' OR PostalCode = '91502' -- estimates 196
OPTION(USE HINT('ASSUME_MIN_SELECTIVITY_FOR_FILTER_ESTIMATES'))By default, the old and new cardinality estimators apply the first two models, respectively. The third model returns an estimation of 196 rows. Unfortunately for our testing, even when the cardinality estimation improves, meaning it is getting close to the actual number of rows in our test query, because of the database simplicity, all three choices still produce the same execution plan.
Let’s try the cardinality estimator feedback feature anyway. The feature is enabled by default using the latest compatibility level. We will need the query store, too. Run the following code to set up our test:
ALTER DATABASE AdventureWorks2019 SET COMPATIBILITY_LEVEL = 160
ALTER DATABASE AdventureWorks2019 SET QUERY_STORE = ON
ALTER DATABASE AdventureWorks2019 SET QUERY_STORE CLEAR ALL
ALTER DATABASE SCOPED CONFIGURATION CLEAR PROCEDURE_CACHE
DBCC DROPCLEANBUFFERS
Additionally, let’s configure an extended events session with the following events and start it using SQL Server Management Studio. Also, use the Watch Live Data feature to see the captured events. For more details on how to do this, you can refer to Chapter 2:
CREATE EVENT SESSION test ON SERVER
ADD EVENT sqlserver.query_feedback_validation
Run our query multiple times and see the events that have been captured:
SELECT City, PostalCode FROM Person.Address WHERE City = 'Burbank' OR PostalCode = '91502'
GO 30
You might catch the data, as shown in Figure 10.4, on query_feedback_analysis on Watch Live Data:

Figure 10.4 – The query_feedback_analysis event
Essentially, this means that the cardinality estimation feedback feature is going to try the indicated model during the next execution. This is performed via the query store and using the specified hint, ASSUME_FULL_INDEPENDENCE_FOR_FILTER_ESTIMATES. This will be validated in the next execution, which will trigger a query_feedback_validation event. In our case, since there is no performance benefit, as the same plan is being used, the change is discarded and the original model assumption is used again.
However, assuming that this will get us a better performance, which you can validate by comparing the original_cpu_time and feedback_validation_cpu_time values of the query_feedback_validation event, the query store will keep the hint and it will be used for future execution.
So, in summary, you don’t have to do anything to benefit from this feature. If you want to know whether it is being used in your environment, you can examine the listed events and, in addition, take a look at the sys.query_store_query_hints and sys.query_store_plan_feedback catalog views.
The current cardinality estimator feedback implements performance feedback using three different categories of model assumptions: correlated model assumptions, containment model assumptions, and optimizer row goals. We covered the correlated model assumptions in our previous example, which, as you can see, is used to estimate the selectivity of predicates within a specific table or view. The official SQL Server documentation currently defines these models as follows:
- Fully independent: In this model, the cardinality of predicates is calculated by multiplying the selectivity of all predicates. This is the default model for the old cardinality estimator.
- Partially correlated: In this model, the cardinality is calculated by using a variation on exponential backoff. This is the default model for the new cardinality estimator.
- Fully correlated: In this model, the cardinality is calculated by using the minimum selectivity of all the predicates.
In Chapter 6, Understanding Statistics, we learned how to calculate the cardinality for all these three cases.
In addition, current cardinality estimator feedback provides two models for join containment. They are defined in the official SQL Server documentation, as follows:
- Simple containment: This model assumes that join predicates are fully correlated. In this scenario, filter selectivity is calculated first, and then join selectivity is factored in.
- Base containment: This model assumes there is no correlation between join predicates and downstream filters.
Finally, by default, the cardinality estimator can detect performance problems with row goal optimizations and can, optionally, disable it if any inefficiency is detected. Row goal optimizations are used on queries with the TOP, IN, and EXISTS keywords, the FAST query hint, or the SET ROWCOUNT statement.
For more details about the cardinality estimator, please refer to Chapter 6, Understanding Statistics.
Degree of parallelism feedback
Based on the same concept as the memory feedback and cardinality estimation feedback features, and also relying on the query store, the degree of parallelism feedback works by identifying parallelism performance problems for repeating queries. The degree of parallelism feedback bases its decisions on the CPU time, the elapsed time, and the parallelism parallel-related waits.
Based on the feedback of recent query executions, the degree of parallelism feedback can automatically change the degree of parallelism and, again, monitor the performance of the query to see whether the change helps. The minimum value for a new query degree of parallelism that the feedback can recommend is 2, meaning the query cannot go to a serial plan. The maximum degree of parallelism is the max degree of parallelism server setting. As suggested, the feedback is persisted as it uses the query store.
Interleaved execution
Interleaved execution is a feature introduced with SQL Server 2017 and, in its current release, only supports multistatement table-valued functions. A well-known problem with multistatement table-valued functions is that they do not provide a cardinality estimate, which, in some cases, can create a performance problem as the query optimizer might not have good enough information to produce an efficient plan. With interleaved execution, SQL Server will pause query optimization, execute the multistatement table-valued function, and use an actual and accurate row count, to continue the query optimization.
Let’s test the feature using the following multistatement table-valued function:
CREATE FUNCTION dbo.tvf_Sales(@year int)
RETURNS @Sales TABLE (
SalesOrderID int,
SalesOrderDetailID int,
CarrierTrackingNumber nvarchar(25),
OrderQty smallint,
ProductID int,
SpecialOfferID int,
UnitPrice money,
UnitPriceDiscount money,
LineTotal money,
rowguid uniqueidentifier ROWGUIDCOL,
ModifiedDate datetime)
AS
BEGIN
INSERT @Sales
SELECT * FROM Sales.SalesOrderDetail
WHERE YEAR(ModifiedDate) = @year
RETURN
END
Since the feature is enabled by default, let’s run the following code using a hint to disable it and see its original behavior:
SELECT * FROM dbo.tvf_Sales(2011) s
OPTION (USE HINT('DISABLE_INTERLEAVED_EXECUTION_TVF'))The plan from Figure 10.5 is generated, which shows a default estimated number of rows of 100, as follows:

Figure 10.5 – A plan with the interleaved execution feature disabled
As you might have noticed, this estimation of 100 takes the query optimizer to produce a Nested Loops operator. This might not be the best choice for the actual number of rows. Run the query again without the DISABLE_INTERLEAVED_EXECUTION_TVF hint:
SELECT * FROM dbo.tvf_Sales(2011) s
JOIN Sales.SalesOrderHeader h ON s.SalesOrderID = h.SalesOrderID

Figure 10.6 – A plan using interleaved execution
The final plan, as shown in Figure 10.6, shows a correct and actual number of rows, which is used by the query optimizer to create a more efficient execution plan.
Table variable deferred compilation
Similar to multistatement table-valued functions, table variables have the limitation that they do not support optimizer statistics and just provide one-row guess estimates. Table variable deferred compilation provides a solution to this problem. As its name suggests, this feature defers the optimization of a statement that references a table variable. By using table variable deferred compilation, the query processor can use the actual cardinality instead of the original guess of one.
Let’s translate our multistatement table-valued function example to a table variable using the following code. Since the scope of a table variable is a batch, you will need to run all three next statements, DECLARE, INSERT and SELECT, at the same time:
DECLARE @Sales TABLE (
SalesOrderID int,
SalesOrderDetailID int,
CarrierTrackingNumber nvarchar(25),
OrderQty smallint,
ProductID int,
SpecialOfferID int,
UnitPrice money,
UnitPriceDiscount money,
LineTotal money,
rowguid uniqueidentifier ROWGUIDCOL,
ModifiedDate datetime)
Insert some data by running the following INSERT statement:
INSERT @Sales
SELECT * FROM Sales.SalesOrderDetail
In the same way as before, let’s use a hint to disable this feature, so we can see the behavior before SQL Server 2019:
SELECT * FROM @Sales s
JOIN Sales.SalesOrderHeader h ON s.SalesOrderID = h.SalesOrderID
OPTION (USE HINT('DISABLE_DEFERRED_COMPILATION_TV'))
Figure 10.7 – A plan with table variable deferred compilation disabled
This will create the plan in Figure 10.7. Now run all three statements again removing the DISABLE_DEFERRED_COMPILATION_TV hint, as shown in the following code:
SELECT * FROM @Sales s
JOIN Sales.SalesOrderHeader h ON s.SalesOrderID = h.SalesOrderID
WHERE YEAR(s.ModifiedDate) = 2011
This will create the plan in Figure 10.8, which shows that the actual number of rows is used and more likely will build an optimal query plan:

Figure 10.8 – A plan with table variable deferred compilation
Now, we will explore a feature introduced with SQL Server 2017, Adaptive joins.
Adaptive joins
Adaptive join is a feature released on the first version of intelligent query processing as part of the originally called adaptive query processing family of features. Additionally, adaptive query processing originally included memory grant feedback and interleaved execution. Although memory grant feedback started with batch mode and was later enhanced to include row mode, adaptive join remains a batch mode-only feature.
The main purpose of an adaptive join is to leave the decision of which physical join to utilize until the execution time when the number of rows needed to be processed is known. Only Nested Loops and Hash Joins are considered on the current release, and the choice is deferred until after the first input has been scanned.
This feature will be selected by the query optimizer only if the best choice for a join could be either a Nested Loops join or a hash join. If the best choice is a Merge Join operator, an adaptive join will not be considered at all. In addition, this feature assumes that the initial join is a hash join, so the execution will start by reading what is considered the build input. Depending on a calculated threshold, if a specific number of rows is met, execution will continue as a hash join; otherwise, it will use the existing rows already read by the build input to execute as a Nested Loops join. It is easier to understand by looking at an example. Let’s create a new table. Drop the table if you still have a table with the same name:
CREATE TABLE dbo.SalesOrderDetail (
SalesOrderID int NOT NULL,
SalesOrderDetailID int NOT NULL,
CarrierTrackingNumber nvarchar(25) NULL,
OrderQty smallint NOT NULL,
ProductID int NOT NULL,
SpecialOfferID int NOT NULL,
UnitPrice money NOT NULL,
UnitPriceDiscount money NOT NULL,
LineTotal money,
rowguid uniqueidentifier ROWGUIDCOL NOT NULL,
ModifiedDate datetime NOT NULL)
INSERT INTO dbo.SalesOrderDetail (
SalesOrderID,
SalesOrderDetailID,
CarrierTrackingNumber,
OrderQty,
ProductID,
SpecialOfferID,
UnitPrice,
UnitPriceDiscount,
LineTotal,
rowguid,
ModifiedDate)
SELECT * FROM Sales.SalesOrderDetail
GO 50
Create a columnstore index on our new table:
CREATE CLUSTERED COLUMNSTORE INDEX CIX_SalesOrderDetail
ON dbo.SalesOrderDetail
We are ready to run our query:
SELECT * FROM dbo.SalesOrderDetail sod
JOIN Sales.SalesOrderHeader soh
ON sod.SalesOrderID = soh.SalesOrderID
WHERE ProductID = 897
This will produce the query plan that is shown in Figure 10.9:

Figure 10.9 – A plan using adaptive joins
Notice the new Adaptive Join operator, which you can see has three inputs. The first or top input is the build input, which, as mentioned before, is executed as the build input assuming a hash join has been selected. The second or middle input is the input that would be executed if a hash join was finally selected. The third or bottom input is the input that would be executed if a Nested Loops join was selected.
By looking at the plan, you could figure out that the actual join type selected was Nested Loops. You can tell because the Clustered Index Seek operator shows that 100 out of 3,103 rows have been processed. The Clustered Index Scan operator shows 0 out of 3,146 rows, meaning it was not used. Finally, you can confirm this by looking at the Adaptive Join properties, where you can see the actual join type is Nested Loops. In addition, the Adaptive Threshold Rows property on the same operator has a value of 595.506 rows. The adaptive join will continue using a hash join if the build input is at or over this value. It will run as a Nested Loops join if the number of rows is lower.
Summary
In this chapter, we covered the most important intelligent query processing features of all three releases up to SQL Server 2022. Of course, new to SQL Server 2022 is that some of the features, such as memory grant feedback, cardinality estimation feedback, and the degree of parallelism feedback, now require the query store to persist the information of queries and plans. Memory grant feedback had the limitation that the feedback was lost when plans were evicted or SQL Server was restarted.
The first release of intelligent query processing, in SQL Server 2017, introduced three of those features under the name of adaptive query processing, and usually, you can make these features available by enabling the applicable database compatibility level of the database. Similarly, any intelligent query processing feature can be disabled if you find a performance regression, either at the database level, by changing the database compatibility level, or at the query level by using a specifically documented hint.
In this chapter, we covered memory grant feedback persistence and percentile capabilities, cardinality estimation feedback, the degree of parallelism feedback, interleaved execution, table variable deferred compilation, adaptive joins, and query compilation replay. Please refer to the official SQL Server documentation for more details about these features or other additional intelligent query processing features. In the next chapter, we will explore data warehouses and the various features around them.