Chapter 4 - Nexus
“We envisioned the cloud a decade before its arrival and that is why the Nexus is the most dominating tool in the industry today”
- Tera-Tom Coffing
Nexus is Available on the Cloud

Why the Nexus Chameleon should be your query tool of choice:
1)Queries every major system
2)Provides visualization and automatically writes the SQL
3)Can perform cross-system joins with a few clicks of the mouse
4)Converts table structures and moves the table and data between systems
5)Compares and synchronizes databases
6)Can move an entire database of tables or views between systems
7)Has the "Garden of Analysis" to re-query answer sets inside your PC
8)Provides a dashboard of graphs and charts for answer sets
Download the Nexus for a free trial at www.CoffingDW.com and use Nexus in-house or on the cloud. Nexus is on the Amazon (AWS) cloud, the Microsoft Azure cloud and the Century Link cloud.
Nexus Queries Every Major System

Nexus is designed to work with every system in your enterprise, on-premises systems and cloud systems. Nexus works with traditional systems, such as DB2, Oracle, SQL Server and Teradata. Nexus also works with newer systems, such as Netezza, Greenplum, Kognitio, Hana, Matrix, Aster Data and Vertica. Nexus also works with your top cloud systems, such as Amazon Redshift, Microsoft Azure SQL Data Warehouse and Hadoop.
How to Use Nexus

The important buttons and function keys you need to know about are listed above.
Why is Nexus Special? Visualization and Automatic SQL

Right click on any table or view in your Nexus system tree and choose "Super Join Builder". Your table, or view, will be shown visually, along with its columns and their data types. Press the "Add Join" drop down menu and see what other tables or views can be joined. Click on the columns you want on your report and a checkmark appears. Nexus automatically writes the SQL for you. You now have the ability to develop at record speeds.
Why is Nexus Special? Cross-System Joins

Did you ever even imagine that you would be able to join tables from different systems? Above, we are joining a Teradata table to an Oracle table to a Vertica table. Just checkmark the columns you want on your report and Nexus handles everything behind the scenes. Nexus builds the SQL, converts the table structures and moves the tables to the Hub system. The report comes flying back with no intervention from the user.
Why is Nexus Special? The Amazing Hub System

Nexus allows the user to select which system they want to process the data. We just changed the Hub to Vertica (above). Now, the tables from the three systems will be converted, moved and joined on the Vertica system. Nexus allows you to join tables from any system in your enterprise (both on-premises and cloud), but then tops it off by allowing you to process the joins on any system in your enterprise. Need extra processing power? Spin up a server on the cloud and make it the hub. Simply amazing!
Why is Nexus Special? Save Answer Sets as Tables
Nexus allows you to run a join or any query in the Super Join Builder and save the answer set as a table on any system in your enterprise (on-premises or cloud). This is a fantastic way to create a data mart or to save data to your sandbox. It is also great for building a test system. And Nexus makes it so easy. Just click on the "Create Table" button and tell Nexus the system and the table name you desire, and that new table and its data will be there when the query is finished.
Why is Nexus Special? Automated Data Movement

Do you know how long it normally takes to convert the table structures and move data between systems? Sometimes this is a month long project, but not with Nexus. Just right click on any database in your systems tree and choose "Move Data". Pick the target system in which you want the tables and data to move and then checkmark the tables you want to move. Press the blue arrow and the tables with a checkmark move to the Target system. Press Execute and watch the tables light up in green with every successful move. If there is a problem, the table(s) will light up in red.
Why is Nexus Special? Nexus makes the Servers Talk Directly

Whenever Nexus converts and moves data from one system to another the data never lands in a landing zone. When Nexus performs cross-system joins between systems the data moves directly from server to server. Whether you install Nexus on your desktop, laptop, Citrix server or access Nexus via a remote desktop on the cloud, there is no data passing through the Nexus. All data movement, conversions and cross-system joins are done directly between the big systems. Nexus uses Progress Data Direct drivers to establish a connection between systems and this allows the big systems to talk directly. This is the secret sauce that allows Nexus to move billions of rows from one system to another!
What Makes Nexus Special? The Garden of Analysis

Nexus can query all of systems in your enterprise and each answer set is automatically present in the Garden of Analysis. This is a unique concept because any and all answer sets can be re-queried by Nexus inside your desktop. Above, we have four answer sets. We right clicked on answer set 4 (Result 4 – in red). Now, we can click on any tab above and get Aggregates, OLAP, Rank, Grouping Sets, Quantiles, Top, Sort, Join, Charts/Graphs, Dynamic Charts or a Dashboard. All you have to do is press on a table and drag columns in the answer set to the templates and you immediately see the new data.
The Garden of Analysis Grouping Sets Tab

In five easy steps we got three new reports. 1) We made Result 4 the active result set by right clicking on the Result 4 tab and we chose "Set as active Result Set". We then chose the Grouping Sets tab at the top (red circle). 2) We then clicked on the Products drop down menu and chose the column Product_Id. 3) We then clicked on the Date Column drop down and chose Sale_Date. 4) We clicked on the Sum drop down menu and chose Daily_Sales. Our options already had the Grouping Sets, Rollup and Cube pre-selected. 5) We hit the CREATE button. Watch what happens on the next page!
The Garden of Analysis - Grouping Sets Answer Sets

We instantly received three more answer sets (in yellow and pink) for Grouping Sets, Group by Cube and Group by Rollup. What is truly intelligent is that we re-queried Result 4 to get the three new reports and did so inside Nexus. The data warehouse was not re-queried, but instead the Nexus used the processor and memory inside the PC to calculate the analytics. All answer sets are saved to the Garden of Analysis so users can get additional reports by merely clicking on the appropriate tab and selecting the columns they want in the varying templates. Why not have your own data warehouse inside Nexus?
The Garden of Analysis – Join Tab (1 of 4)

To join answer sets together you need a single step. 1) Click on the join Tab (at the top). Notice that we have two answer sets that are named Result 1 and Result 2. Turn the page and see what happens next.
The Garden of Analysis – Join Tab (2 of 4)

In seven easy steps you can sort an answer set. 1) Choose the Join tab at the top (red circle). 2) Choose the Left Table from the Left Table Drop Down (one of the answer sets). 3) Choose the Right Table from the Right Table Drop Down (one of the answer sets) 4) Choose the Left Table Join Column from the menu. 5) Choose the Right Table Join Column from the menu. 6) Pick the join type you want from the Options menu. 7) Hit the Create button. Turn the page to see the actual choices.
The Garden of Analysis – Join Tab (3 of 4)

We Chose the Result 1 answer set for the Left Table from the Left Table drop down menu. We Chose the Result 2 answer set for the Right Table from the Right Table drop down menu. We chose the Customer_Number column from the Left Table Join Column drop down menu. We Chose the Customer_Number column for the Right Table Join Column from the Right Table Join Columns drop down menu. We kept the Join Type of Inner Join. We hit the Create button. Turn the page to see the results
The Garden of Analysis – Join Tab (4 of 4)

The two answer sets are now joined together. You can join answer sets from different systems just as easily.
The Garden of Analysis – Charts/Graphs Tab (1 of 4)

To get charts and graphs for an answer set do the following two steps. 1) Right click on the answer set you want to work with and choose "Set as Active Result Set". That answer set is now ready to be placed into graphs and charts. 2) Click on the Charts/Graphs Tab (at the top). Turn the page and see what happens next.
The Garden of Analysis – Charts/Graphs Tab (2 of 4)

In eight easy steps you can graph and chart an answer set with 35 different graphs and charts. 1) Choose the Graphs/Charts tab at the top (red circle). 2) Choose the column you want as the Y Axis from the Values (Y Axis) Drop Down menu. 3) Choose the column you want to be the X axis from the Labels (X axis) Drop Down menu. 4) Choose the Sort By (Optional) column in which you want to sort from the drop down menu. 5) Choose the optional Partition By column from the drop down menu. 6) Pick the type of chart from the Basic Chart Types options. 7) Pick the Visual Type of chart you want. 8) Hit the Create button. Turn the page to see the actual choices.
The Garden of Analysis – Charts/Graphs Tab (3 of 4)

You can see the columns above that we chose. Because we chose All Types and All Charts in the options tab we got 35 charts and each was placed in the Dashboard. Turn the page to see one of the many charts.
The Garden of Analysis – Charts/Graphs Tab (4 of 4)
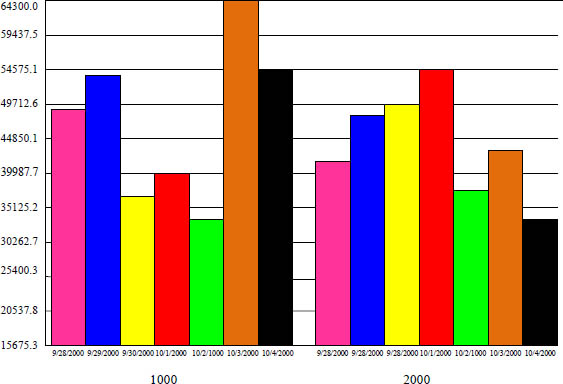
The chart above represents the answer set. This chart has been placed in the dashboard along with 35 other charts depicting the same answer set and parameters.
The Garden of Analysis – Dynamic Charts Tab (1 of 4)

To get Dynamic Charts for an answer set do the following two steps. 1) Right click on the answer set you want to work with and choose "Set as Active Result Set". That answer set is now ready to be placed in a Dynamic Chart. 2) Click on the Dynamic Charts Tab (at the top). Turn the page and see what happens next.
The Garden of Analysis – Dynamic Charts Tab (2 of 4)

You need to take two steps. 1) Make sure you have selected the Dynamic Charts tab at the top (red circle). 2) Hit the Load Visualization button. Turn the page to see what happens next.
The Garden of Analysis – Dynamic Charts Tab (3 of 4)

Dynamic Charts allow you to drop and drag columns from the Attributes and Measures area. As you drop and drag, the charts dynamically change. Above, you can see the Sale_Date (in red) and the Product_ID (in blue) and the Daily_Sales column (in pink). The next slide will show how we drop and drag these Attributes and Measures to get our chart.
The Garden of Analysis – Dynamic Charts Tab (4 of 4)

Notice how we dragged the attributes and measures to the varying parts of the application. Because we put the Daily_Sales column in the level of detail, the actual Daily_Sales will appear if you hover your mouse over any of the bars.
The Garden of Analysis – Dashboard Tab (1 of 5)

Once you create and save graphs and charts to the dashboard you can view your graphs and charts in varying ways. Just left click on the Dashboard Tab at the top. Turn the page and see what happens next.
The Garden of Analysis – Dynamic Charts Tab (2 of 5)

The slideshow will display the many graphs one at a time in intervals of seconds. Hit the pause button to stop and examine any particular slide.
The Garden of Analysis – Dynamic Charts Tab (3 of 5)

The scroll will scroll the graphs and charts across the screen from right to left. Hit the pause button to stop and examine any particular graph or chart. Hit the speed bar to speed up or slow down the scrolling.
The Garden of Analysis – Dynamic Charts Tab (4 of 5)

The Compare allows you to compare two different charts. The drop down menus are there so you can pick chart 1 vs chart 2.
The Garden of Analysis – Dynamic Charts Tab (5 of 5)

The thumbnails show all of the graphs and charts in your dashboard. This gives you a broad view that allows you to double click on any thumbnail and see it in actual size. You can also use the menu (at the top) to send selected graphs to Garden Tabs, Compare Selected Graphs, or Delete Selected Graphs.
Getting to the Super Join Builder

Right click on any table in your systems tree and choose Super Join Builder. You will be placed inside the Super Join Builder.
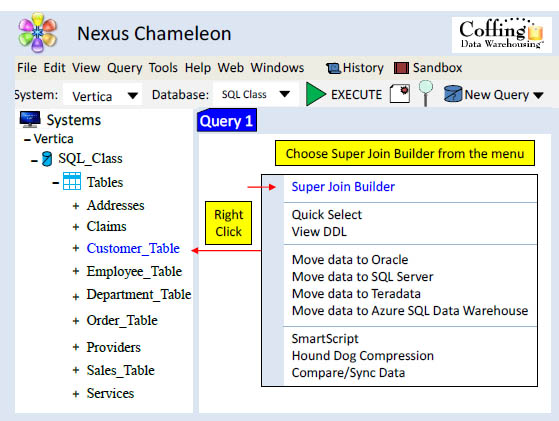
The Super Join Builder is the First Entry in the Menu

Right click on any table in your systems tree and a menu will appear. Choose Super Join Builder (top menu item) and the table you selected will be placed inside the Super Join Builder.
The Super Join Builder Shows Tables Visually

This is exactly what you will see when you first enter the Super Join Builder. You will see your table, its columns and the data types of each column. Notice the table name (Customer_Table) and the Vertica icon of V. Turn the page for more.
Using the Add Join Button

One of the greatest features of the Super Join Builder is the Add Join drop down menu. Press the drop down and the menu will show you what other tables or views can be joined to this table.
What to Do When No Tables are Joinable?

You might find that when you click on the Add Join drop down menu that you receive a message that says, "Could not identify any joins to this object". This means that you haven't actually told Nexus what does join to this table. We are about to fix that. The next page shows you how to define joins so that the menu will recognize them.
Drag a Joinable Object into the Super Join Builder

If you want to define how a table joins to another table in the Super Join Builder, you merely left click on the table in the tree and drag it into the Super Join Builder area.
You will see the Add Custom Join Window

When you drag a second table into the Super Join Builder the Add Custom Join window appears. This is the window where you will define the join conditions. Turn the page and watch how we define the columns that join the tables together.
Defining the Join Columns

In four easy steps you can define the join conditions. Nexus will remember this table next time.
Your Tables Will Appear Together

Now that you have defined your tables and the join conditions the tables will appear together in the Super Join Builder. Notice the line connecting the tables points to the columns from both tables that are their respective join conditions.
Select the Columns You Want on the Report

Put a checkmark in the column boxes for all columns you want on the report and Nexus will build the SQL automatically. We have checked the Customer_Number, Customer_Name, Order_Date and Order_Total columns.
Check out the SQL Tab to See the SQL that has been built

When you see your tables in the Super Join Builder you are in the Objects Tab. Now that you have put a checkmark on the columns you want on your report, click on the SQL tab to see the SQL that Nexus has automatically built for you.
SQL Tab

The SQL has automatically been built for you because you put a check on the column you wanted to see on the report. You can hit the Execute button (above the Objects tab) or you can Preview SQL in Nexus. We will show you both options next.
Hit Execute to get the Report inside the Super Join Builder

If you click the Execute button (above the Objects tab) the report will come back inside the Super Join Builder. Turn to the next page and see the report.
The Report is delivered inside the Super Join Builder

The report is delivered.
Let's Join Two Tables Again (1 of 6)

Right click on the table you previously defined in your systems tree and choose Super Join Builder. You will be placed inside the Super Join Builder. The next page will show the Right Click menu. Do you remember where the Super Join Builder is?
Let's Join Two Tables Again (2 of 6)
The Super Join Builder is always the top menu item. Select that and you will be placed inside the Super Join Builder.
Let's Join Two Tables Again (3 of 6)

You once again see your table, its columns and the data types of each column. Watch what happens when we hit the Add Join drop down menu now.
Let's Join Two Tables Again (4 of 6)

What do you think will be in the Add Join drop down menu this time? I bet you already guessed it. Turn the page.
Let's Join Two Tables Again (5 of 6)

Since you previously defined the relationship between the Customer_Table and the Order_Table the Add Join drop down menu will list these tables as joinable. Just use the menu to select the Order_Table and both tables will appear side by side together in the Super Join Builder. Turn the page and see for yourself. You can then look at the dashboard tab (top right) and see the compression savings for every table.
Let's Join Two Tables Again (6 of 6)

Now that you have defined your tables and the join conditions, the tables will appear together in the Super Join Builder. Notice the line connecting the tables’ points to the columns respective join conditions.
The Tabs of the Super Join Builder Philosophy – One Query

The Super Join Builder is one of the most intricate pieces of commercial software ever built. Each tab above performs a different function so that you can quickly build the most efficient query possible.
The Tabs of the Super Join Builder – Objects Tab

The Objects tab is the first screen you will always see when you right click on a table and choose "Super Join Builder". It shows the table you right clicked on in your systems tree (visually). You can then select from the Add Join drop down to see a menu of what other objects can be joined. If you click on an object in the Add Join drop down it will be joined. You can also click the Cube drop down menu to automatically select all objects that are joinable (instantly). Each time you checkmark a column in an object the SQL is automatically built and that column will be on your report. Of course you can always check all columns in an object by putting a checkmark in the Select * check box of an object. Above, we are joining the Customer_Table to the Order_Table and have put a checkmark on the Customer_Name, Order_Date and Order_Total.
The Tabs of the Super Join Builder – Columns Tab)

The columns tab allows you to rearrange columns on your report. You can drag and drop columns to change their order. Notice that the columns are color coded to match the color of the table (in the objects tab) that they came from. Columns at the top are the ones you selected. The columns at the bottom are the ones you did not select. You can throw columns at the top in the trash can and they are no longer on your report, as they will reappear at the bottom. You can even move columns from the bottom up to the top and they will then be on your report.
The Tabs of the Super Join Builder – Sorting Tab

The Sorting Tab allows you to double-click on any column that you want to use in the ORDER BY statement of the SQL. This essentially sorts the report. The Report Columns shows the columns you selected to be on your report. The Additional Columns shows the columns you did not select to be on your report. You can however choose from any of these columns to be the sort key. Double click on a column, or click-and-drag it up, and it will be a sort key. You can have multiple sort keys and you can always choose either ASC or DESC mode.
The Tabs of the Super Join Builder – Joins Tab

Use the Joins tab if you want to change your joins from Inner to Outer joins. The drop down menu (red arrow) allows you to easily adjust your SQL to utilize the outer join of your choice. It is also designed to show you the tables being joined and the join column conditions in the ON CLAUSE. Above, we have decided to keep the default INNER JOIN.
The Tabs of the Super Join Builder – SQL Tab

The SQL tab shows you the SQL that Nexus has automatically generated. The SQL begins being built the first time you checkmark a column in the objects tab, and changes with each change you request from any of the other tabs. We originally requested Customer_Name, Order_Date and Order_Total in the Objects tab. We sorted by Order_Date ASC in the Sorting Tab. Nexus always generates the SQL perfectly for all systems.
The Tabs of the Super Join Builder – Metadata Tab

The Metadata tab will show you the size of your table, including row counts. This will be extremely important when you begin performing cross-system joins. Nexus always thinks about performance tuning first because Nexus has been used (in production) by many of the largest companies in the world. The Metadata tab will also show you the optimizer's plan, which is often called the Explain plan, if you request it by clicking on the magnifying glass (red circle above).
The Tabs of the Super Join Builder – Analytics Tab

The Analytics tab will allow a user to quickly build the SQL needed for Ordered Analytics (OLAP), Rank, and Grouping Sets. These analytics can also be done in the Garden of Analysis after an answer set returns, but on extremely large data sets it can be advantageous to have analytics performed by the data warehouse. The Analytics tab will build the SQL for the user so the user can submit that SQL to the data warehouse to receive an answer set. Start by right clicking on a table in the system tree and choosing Super Join Builder from the right click menu. Then, checkmark the columns you will want on your report, and then go to the Analytics tab.
The Tabs of the SJB – Analytics Tab – OLAP Screen

This is usually the exact screen you see by default when you enter the Analytics tab. We are in the OLAP subtab. You will drop and drag the columns below to the appropriate window, change the moving window parameter and then check the OLAP functions you desire. You can select all of the OLAP functions by checking the Select * checkbox, and you can select the With Partitioning OLAP functions as well. The With Partitioning will reset the calculations on the Partitioning column.
Getting a Simple CSUM in the Analytics Tab – OLAP

In the example above, we dragged the Daily_Sales column to the OLAP box because that is the column we want to perform the calculations on. We dragged the Product_ID column first to the sorting tab and then we dragged the Sale_Date column there also. This means we will first sort the data by Product_ID, Sale_Date. We also checked the CSUM OLAP function. We didn't touch the Partitioning or Moving Window information. The next page shows the SQL tab and the SQL generated.
Getting a Simple CSUM – The SQL Automatically Generated

The SQL above was automatically generated by the previous OLAP screen and was done so the second we checked the CSUM checkbox. The above query will OLAP the column Daily_Sales, but only after first sorting the data by Product_ID, Sale_Date. The Rows Unbounded Preceding will generate a Cumulative Sum. Let's check out the report on the next slide.
The Answer Set of the CSUM
SELECT Product_ID , Sale_Date, Daily_Sales,
SUM(Daily_Sales) OVER (ORDER BY Product_ID ASC, Sale_Date ASC
ROWS UNBOUNDED PRECEDING) AS CSUM_Sale_Date_Sal
FROM Sales_Table ;

The Sales_Table was first sorted by Product_ID, Sale_Date. Then, the Cumulative Sum (CSUM) began. We made 48850 for the first row so 48850.50 is our first CSUM value. Then, we made 54500.22 so 48850 + 54500.22 equals 103350.62. The values from each Daily_Sales entry was continually added.
Getting all of the OLAP functions in the Analytics Tab

In the example above, we will OLAP the Daily_Sales column after first sorting by Product_ID, Sale_Date. We dragged the Product_ID column to the partitioning window. We changed the moving window to 3 and checked all of the OLAP and OLAP with partitioning boxes by merely clicking on SELECT *. The next page shows the SQL tab and the SQL generated.
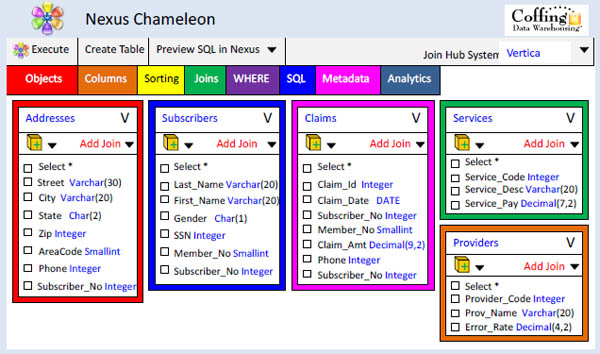
A Five Table Join Using the Menu

You are about to see how the menu system of the Super Join Builder is designed to work. We will first use the menu of the Super Join Builder and then show you an even quicker way (using the Cube method).
The First Table is placed in the Super Join Builder

This is exactly what you will see when you first enter the Super Join Builder. You will see your table, its columns and the data types of each column. Notice the table name (Addresses) and the V for the Vertica icon. Turn the page for more.
Using the Add Join Cascading Menu

The Add Join menu drop down shows that the Addresses table joins to the Subscribers table. Keep cascading down the menu and you see that the Subscribers table joins to the Claims table. Keep cascading all the way until you get to the final table, which is the Services table. Left click on the Services table and all five tables will be in the Super Join Builder.
All Five Tables Are In the Super Join Builder

Now that all five tables are present in the Super Join Builder, all you have to do is checkmark the columns you want on the report. The SQL is built automatically with each mouse click. When you are done selecting the columns, just hit Execute.
A Five Table Join Two Steps (Cube)

Be prepared to be amazed. We are about to do the two-step! These two steps will allow a user to join many tables in an instant. Watch the two steps that it takes to join a table to everything possible. Pick any table in the join of many tables.
Choose Cube with Columns from the Left Top of the Table

On the left side of the table is the Cube drop down menu. Choose the Create Cube with Columns option (highlighted above). The Nexus will join every table possible in the entire lineage instantly, and choose all of the columns. Turn the page!
All Tables are Cubed (Joined Together Instantly)

There were five total tables that were joinable and the Create Cube with Columns choice instantly joined them together, including all of the columns. The SQL has been built automatically (in 2 seconds) and you can hit Execute to get your report.
Choose Cube and then Choose Your Columns

On the left side of the table is the Cube drop down menu. Choose the Create Cube option (highlighted above). The Nexus will join every table possible in the entire lineage instantly, but you can decide what columns you want on the report.
Create Cube - Tables Are Joined Without Columns Selected
All of the tables joinable are present in the Super Join Builder, but none of the columns are selected. You can now select the columns you want on the report. There will also be an X on the top of the tables, so you can delete any table you don't need.
Create Cube – Select the Columns You Want on the Report

Notice that we have checked the columns we want on the report, but that not all columns were selected. The SQL is built automatically with each check or uncheck of a column box. When you are finished choosing the columns you want on the report, please hit Execute (above) or Preview SQL in Nexus, where you can hit Execute in the main Nexus screen.
How to join Vertica, Oracle and SQL Server Tables

We are about to do a three-table join, but the incredible part is that one table is from Vertica, another from Oracle and the third table is from SQL Server. We will start with the Vertica table. We will right click on the Addresses table from the Vertica systems tree and a menu will appear. We choose the Super Join Builder (top menu item) and begin the process.
The Vertica Table is now in the Super Join Builder

The Addresses Table (from the Vertica system) is now in the Super Join Builder. You will see the table, its columns and the data types of each column. Notice that the table name (Addresses) has an icon of V for Vertica in the upper right corner. Now is the time to open up our Oracle system tree. We will do that on the next slide.
Drag the Joining Oracle Table to the Super Join Builder

Open up your Oracle Systems Tree and left click on the Oracle table you want to join and drag it into the Super Join Builder.
Defining the Join Columns

In four easy steps you can define the join conditions. Notice two things about the Subscribers Table from Oracle. First, notice the Oracle icon in the table's right hand corner. Second, notice the number behind the Subscribers name (pink). In the above example, the name is Subscribers931827O. The table will be moved to Vertica temporarily for the life of the join.
Choose the Columns You Want on Your Report

The Vertica and Oracle tables are in the Super Join Builder, the relationships have been defined and so have the data movement strategies. All you need to do now is to checkmark the columns you want from both tables on the report. We have placed a checkmark on the Subscriber_No, State, Last_Name and First_Name columns. The SQL has already been built (automatically), and if you hit the Execute button, the report will return.
Let's Add a SQL Server Table to our Vertica and Oracle Join

Open up your SQL Server Systems Tree and left click on the table you want to join, and drag it into the Super Join Builder.
Defining the Join Columns

1) Choose the correct table that the new table joins with from the table drop down menu. 2) Choose the joining column(s) from the left table. 3) Choose the joining column(s) from the new table on the right. 4) Hit the blue arrow to actually define the join conditions (the SQL will change below to reflect the join). 5) Hit the Add Join Button.
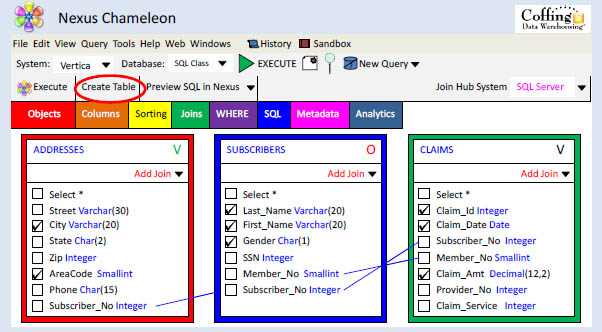
All Three Tables are now in the Super Join Builder

You now have three tables (from different systems) in the Super Join Builder. You have already defined the joining columns and your data movement strategies. Just click on the columns you want on the report and hit Execute. The SQL has already been built and the Oracle and SQL Server tables will be moved temporarily to the Vertica system, where they will be joined. Because we only selected Last_Name and First_Name from the Oracle table and Claim_Date and Claim_Amt from the SQL Server table, only those columns (plus the join condition column – Subscriber_No) will be moved to Vertica.
Change the Hub and Run the Join on Oracle

Nexus allows you to determine on which system the processing will take place. We call this the Hub. Above, we have changed the Join Hub System to Oracle. This means that the Vertica and SQL Server tables will be moved to Oracle, where all three tables will be joined. You can actually change the Hub to any system in our enterprise.
Change the Hub and Run the Join on SQL Server

Nexus allows you to determine on which system the processing will take place. We call this the Hub. Above, we have changed the Join Hub System to SQL Server. This means that the Vertica and Oracle tables will be moved to the SQL Server system, where all three tables will be joined. You can actually change the Hub to any system in our enterprise.
Simply Amazing - Change the Hub to the Garden of Analysis

Nexus allows you to determine on which system the processing will take place. We call this the Hub. Above, we have changed the Join Hub System to the Garden of Analysis. This should be done when the joining tables are not huge. Now, all of the tables will be queried separately, and then joined transparently inside the user's PC. It is as fast as lightning! Brilliant!
Have the Answer Set Saved Automatically to Any System

Nexus allows you to create a table on any system in your enterprise with an answer set from the Super Join Builder. Once the Create Table option (above) is selected, you will be asked on which system you want the answer set saved, which database or schema and the table name. The answer set won't return to your screen, but instead will be saved as a table to the system you have chosen.
Saving the Answer Set to an Oracle or SQL Server System

Above are the screens you will have to fill in if you want to save your answer set to Oracle (on the left) or SQL Server (on the right). Once you hit the Create Table button you will be returned to the Super Join Builder. When you hit Execute, the answer set will be created as a table using the above details.
Saving the Answer Set to a Vertica System

Above is the screen you will have to fill in if you want to save your answer set to a Vertica system. Once you hit the Create Table button you will be returned to the Super Join Builder. When you hit Execute, the answer set will be created as a table using the above details.
Saving the Answer Set to a Teradata System
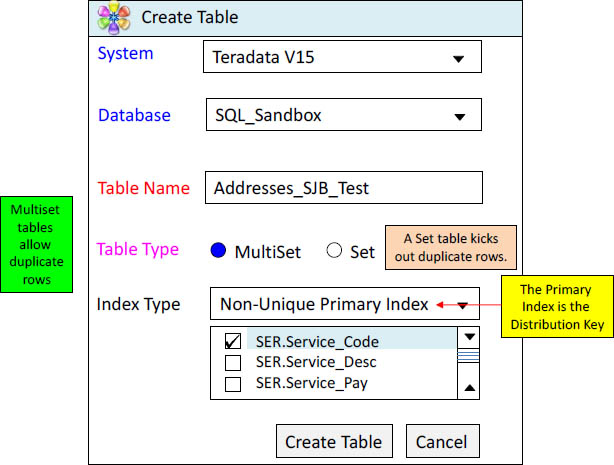
Above is the screen you will have to fill in if you want to save your answer set to a Teradata system. Once you hit the Create Table button you will be returned to the Super Join Builder. When you hit Execute, the answer set will be created as a table using the above details. In Teradata, you will have either a Unique Primary Index, a Non-Unique Primary Index or a No Primary Index (NoPI). Above, we have a Non-Unique Primary Index on SER.Service_Code.