
Chapter 19 – Statistical Aggregate Functions
“You can make more friends in two months by becoming interested in other people than you will in two years by trying to get other people interested in you."
- Dale Carnegie
The Stats Table
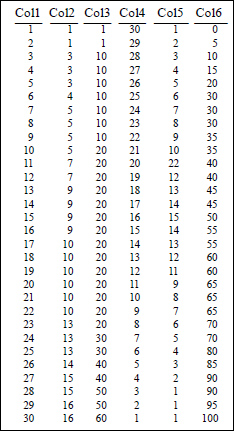
Above is the Stats_Table data that we will use in our statistical examples.
The STDDEV_POP Function
Col1 Numbers
1 2 3 4 5 6 7 8 9 10 11 12 13 14 15 16 17 18 19 20 21 22 23 24 25 26 27 28 29 30
Syntax for using STDDEV_POP:
STDDEV_POP(<column-name>)
SELECT STDDEV_POP(col1) AS SDPCol1
FROM Stats_Table;
SDPCol1
8.66
The standard deviation function is a statistical measure of spread or dispersion of values. It is the root’s square of the difference of the mean (average). This measure is to compare the amount by which a set of values differs from the arithmetical mean. The STDDEV_POP function is one of two that calculates the standard deviation. The population is of all the rows included based on the comparison in the WHERE clause.
A STDDEV_POP Example

The STDDEV_SAMP Function
Col1 Numbers
1 2 3 4 5 6 7 8 9 10 11 12 13 14 15 16 17 18 19 20 21 22 23 24 25 26 27 28 29 30
Syntax for using STDDEV_SAMP:
STDDEV_SAMP(<column-name>)
SELECT STDDEV_SAMP(col1) AS SDSCol1
FROM Stats_Table;
SDSCol1
8.80
The standard deviation function is a statistical measure of spread or dispersion of values. It is the root’s square of the difference of the mean (average). This measure is to compare the amount by which a set of values differs from the arithmetical mean. The STDDEV_SAMP function is one of two that calculates the standard deviation. The sample is a random selection of all rows returned based on the comparisons in the WHERE clause. The population is for all of the rows based on the WHERE clause.
A STDDEV_SAMP Example

The VAR_POP Function
Col1 Numbers
1 2 3 4 5 6 7 8 9 10 11 12 13 14 15 16 17 18 19 20 21 22 23 24 25 26 27 28 29 30
Syntax for using VAR_POP:
VAR_POP(<column-name>)
SELECT VAR_POP(col1) AS VPCol1
FROM Stats_Table;
VPCol1
74.92
The Variance function is a measure of dispersion (spread of the distribution) as the square of the standard deviation. There are two forms of Variance in Vertica, VAR_POP is for the entire population of data rows allowed by the WHERE clause. Although standard deviation and variance are regularly used in statistical calculations, the meaning of variance is not easy to elaborate. Most often variance is used in theoretical work where a variance of the sample is needed. There are two methods for using variance. These are the Kruskal-Wallis one-way Analysis of Variance and Friedman two-way Analysis of Variance by rank.
A VAR_POP Example

The VAR_SAMP Function
Col1 Numbers
123456789 10 11 12 13 14 15 16 17 18 19 20 21 22 23 24 25 26 27 28 29 30
Syntax for using VAR_SAMP:
VAR_SAMP(<column-name>)
SELECT VAR_SAMP(col1) AS VSCol1
FROM Stats_Table;
VSCol1 77.50 |
The Variance function is a measure of dispersion (spread of the distribution) as the square of the standard deviation. There are two forms of Variance in Vertica, VAR_SAMP is used for a random sampling of the data rows allowed through by the WHERE clause. Although standard deviation and variance are regularly used in statistical calculations, the meaning of variance is not easy to elaborate. Most often variance is used in theoretical work where a variance of the sample is needed to look for consistency. There are two methods for using variance. These are the Kruskal-Wallis one-way Analysis of Variance and Friedman two-way Analysis of Variance by rank.
A VAR_SAMP Example

The VARIANCE Function
Col1 Numbers
123456789 10 11 12 13 14 15 16 17 18 19 20 21 22 23 24 25 26 27 28 29 30
Syntax for using VARIANCE:
VARIANCE(<column-name>)
SELECT VARIANCE(col1) AS VSCol1 FROM Stats_Table;
VSCol1 77.50 |
The Variance function is a measure of dispersion (spread of the distribution) as the square of the standard deviation. There are two forms of Variance in Vertica, VAR_SAMP is used for a random sampling of the data rows allowed through by the WHERE clause. Although standard deviation and variance are regularly used in statistical calculations, the meaning of variance is not easy to elaborate. Most often variance is used in theoretical work where a variance of the sample is needed to look for consistency. There are two methods for using variance. These are the Kruskal-Wallis one-way Analysis of Variance and Friedman two-way Analysis of Variance by rank.
A VARIANCE Example

The CORR Function
Col1 Numbers
123456789 10 11 12 13 14 15 16 17 18 19 20 21 22 23 24 25 26 27 28 29 30
Syntax for using CORR:
CORR(<column-name>, <column-name>)
SELECT CORR(col1, col2) AS CCol1and2
FROM Stats_Table;
CCol1and2 0.99 |
The correlation coefficient is a number between -1 and 1.
It is calculated from a number of pairs of observations or
linear points (X,Y) Where
1 = perfect positive correlation
0 = no correlation
-1 = perfect negative correlation
The CORR function is a binary function, meaning that two variables are used as input to it. It measures the association between 2 random variables. If the variables are such that when one changes the other does so in a related manner, they are correlated. Independent variables are not correlated because the change in one does not necessarily cause the other to change
A CORR Example

Another CORR Example so you can compare

The COVAR_POP Function
Col1 Numbers
123456789 10 11 12 13 14 15 16 17 18 19 20 21 22 23 24 25 26 27 28 29 30
Syntax
COVAR(<column-name>, <column-name>)
SELECT COVAR_POP(col1, col2) AS CCol1_2
FROM Stats_Table;
CCol1_2 37.50 |
The covariance is a statistical measure of the tendency of two variables to change in conjunction with each other. It is equal to the product of their standard deviations and correlation coefficients. The covariance is a statistic used for bivariate samples or bivariate distribution. It is used for working out the equations for regression lines and the product-moment correlation coefficient.
A COVAR_POP Example

Another COVAR_POP Example so you can compare

The COVAR_SAMP Function
Col1 Numbers
123456789 10 11 12 13 14 15 16 17 18 19 20 21 22 23 24 25 26 27 28 29 30
Syntax
COVAR_SAMP (expression1,expression2)
SELECT COVAR_SAMP(col1, col2) AS CCol1_2
FROM Stats_Table;
CCol1_2 38.79 |
The COVAR_SAMP function returns the sample covariance for a set of expression pairs deemed (expression1 and expression2). The actual return value data type by default is that of DOUBLE PRECISION. The function eliminates all expression pairs where either expression in the pair is NULL. If no rows remain, the function returns a NULL value.
A COVAR_SAMP Example

Another COVAR_SAMP Example so you can compare

The REGR_INTERCEPT Function

Syntax for using REGR_INTERCEPT:
REGR_INTERCEPT(dependent-expression, independent-expression)
SELECT REGR_INTERCEPT(col1, col2) AS RIofCol1_2
FROM Stats_Table;
RIofCol1_2 -1.35 |
A regression line is a line of best fit, drawn through a set of points on a graph for X and Y coordinates. It uses the Y coordinate as the Dependent Variable and the X value as the Independent Variable. Two regression lines always meet or intercept at the mean of the data points (x,y), where x=AVG(x) and y=AVG(y) and is not usually one of the original data points.
A REGR_INTERCEPT Example

Another REGR_INTERCEPT Example so you can compare

The REGR_SLOPE Function

Syntax for using REGR_SLOPE:
REGR_SLOPE(dependent-expression, independent-expression)
SELECT REGR_SLOPE(col1, col2) AS RIofCol1_2
FROM Stats_Table;
RSCol1_2 1.94 |
A regression line is a line of best fit, drawn through a set of points on a graph of X and Y coordinates. It uses the Y coordinate as the Dependent Variable and the X value as the Independent Variable. The slope of the line is the angle at which it moves on the X and Y coordinates. The vertical slope is Y on X and the horizontal slope is X on Y.
REGR_SLOPE Example

Another REGR_SLOPE Example so you can compare

The REGR_AVGX Function

Syntax for using REGR_AVGX:
REGR_AVGX(dependent-expression, independent-expression)
SELECT REGR_AVGX(col1, col2) AS RSCol1_2
FROM Stats_Table;
RSCol1_2 8.67 |
The REGR_AVGX function is the average of the independent variable (sum(X)/N).
A REGR_AVGX Example

Another REGR_AVGX Example so you can compare

The REGR_AVGY Function

Syntax for using REGR_AVGY:
REGR_AVGY(dependent-expression, independent-expression)
SELECT REGR_AVGY(col1, col2) AS RSCol1_2
FROM Stats_Table;
RSCol1_2 15.5 |
The REGR_AVGY is the average of the dependent variable (sum(Y)/N).
A REGR_AVGY Example

Another REGR_AVGY Example so you can compare

The REGR_COUNT Function

Syntax for using REGR_COUNT:
REGR_COUNT(dependent-expression, independent-
expression)
SELECT REGR_COUNT(col1, col2) AS
RSCol1_2
FROM Stats_Table;
RSCol1_2
30
The REGR_COUNT is the number of input rows in which both expressions are non-null.
A REGR_COUNT Example

The REGR_R2 Function

Syntax for using REGR__R2:
REGR_R2(Y, X)
SELECT REGR_R2(col1, col2) AS RSCol1_2
FROM Stats_Table;
RSCol1_2
0.97
The REGR_R2 is the square of the correlation coefficient.
A REGR_R2 Example

The REGR_SXX Function

Syntax for using REGR_SXX:
REGR_SXX(Y, X)
SELECT REGR_SXX(col1, col2) AS RSCol1_2
FROM Stats_Table;
RSCol1_2
578.67
The REGR_SXX is the sum(X^2) - sum(X)^2/N ("sum of squares" of the independent variable).
A REGR_SXX Example

The REGR_SXY Function

Syntax for using REGR_SXY:
REGR_SXY(Y, X)
SELECT REGR_SXY(col1, col2) AS RSCol1_2
FROM Stats_Table;
RSCol1_2
1125
The REGR_SXY is the sum(X*Y) - sum(X) * sum(Y)/N ("sum of products" of independent times dependent variable).
A REGR_SXY Example

The REGR_SYY Function

Syntax for using REGR_SYY:
REGR_SYY(Y, X)
SELECT REGR_SYY(col1, col2) AS RSCol1_2
FROM Stats_Table;
RSCol1_2
2247.5
The REGR_SYY is the sum(Y^2) - sum(Y)^2/N ("sum of squares" of the dependent variable).
A REGR_SYY Example

Using GROUP BY
SELECT
col3
,count(*) |
AS Cnt |
,avg(col1) |
AS Avg1 |
,stddev_pop(col1) |
AS SD1 |
,var_pop(col1) |
AS VP1 |
,avg(col4) |
AS Avg4 |
,stddev_pop(col4) |
AS SD4 |
,var_pop(col4) |
AS VP4 |
,avg(col6) |
AS Avg6 |
,stddev_pop(col6) |
AS SD6 |
,var_pop(col6) |
AS VP6 |
FROM Stats_Table GROUP BY 1 ORDER BY 1;
