
Corporate Financial Statements
Four general purpose financial statements issued by publicly owned corporations were identified in Chapter 1: balance sheet, income statement, statement of cash flows, and statement of retained earnings. This chapter revisits these publicly available reports in greater detail.
The Balance Sheet
The balance sheet is a snapshot of a corporation’s financial position at a specific point in time. In fact, balance sheets are often referred to as statements of financial position. A corporation’s financial position refers to its assets and the claims to those assets by creditors and shareholders. A balance sheet is aptly named, because the relationship among its elements can be expressed as a rudimentary formula referred to as the accounting equation. The accounting equation simply states that the assets of a corporation equal the sum of its liabilities and shareholders’ equity (A = L + E).
Figure 2.1 provides a simple and straightforward illustration of a corporate balance sheet.1 Notice that Weston’s total assets of $1,000,000 equal the sum of its liabilities ($360,000) plus its shareholders’ equity ($640,000). As expected, the underlying accounting equation (A = L + E) is in balance ($1,000,000 = $360,000 + $640,000).

Figure 2.1 The balance sheet
The heading of Weston’s balance sheet states that all figures are in thousands of dollars. Thus, the reported cash figure of $24,000 actually means that the company’s cash balance is approximately $24 million; likewise, the $1,000,000 total asset figure denotes total resources of approximately $1 billion. This form of restatement is common practice in financial reporting. In fact, some publicly owned corporations are so large that they restate their financial statements in millions of dollars.
The individual elements of a corporate balance sheet—assets, liabilities, and shareholders’ equity—are identified and discussed in the following sections. All references pertaining to specific amounts reported in Figure 2.1 will remain stated in thousands of dollars. For instance, all references to the company’s cash will be stated as $24,000, not $24 million.
Assets
Assets reported in a balance sheet are defined as economic resources expected to bring future benefit. Economic resources are those that can be measured and quantified in monetary terms.2 Future benefit refers to the potential of assets to support and to make possible the generation of future cash flow. Weston’s balance sheet in Figure 2.1 reveals two asset classifications: Current Assets and Noncurrent Assets. Both classifications are composed of economic resources expected to bring future benefit. What distinguishes current assets from noncurrent assets is how quickly their benefits are expected, and the type of benefits they provide.
Current Assets
Current assets are economic resources expected to provide benefits in one year, or in one operating cycle, whichever is longer. With relatively few exceptions, one year is generally longer than one operating cycle for most companies.3 Thus, current assets are usually expected to provide benefits in one year or less. The primary benefit that current assets provide is a continuous source of cash flow to satisfy recurring obligations incurred in daily operations (e.g., acquiring inventory, paying utilities, buying insurance, compensating employees, etc.).
Current assets are listed in the order of liquidity—which means how quickly they are expected to convert into cash. Cash is always listed first, because it is immediately available to satisfy outstanding obligations. Weston’s balance sheet in Figure 2.1 lists accounts receivable (from credit sales made to customers) second, and inventory third. Accounts receivable is considered more liquid than inventory because inventory sold to credit customers does not provide an immediate source of cash flow. Instead, inventory sold on credit is exchanged for accounts receivable, which subsequently convert to cash when collected. The prepaid items shown in Weston’s balance sheet are its least liquid current asset. Prepayments are a topic discussed in Chapter 3.
The critical role current assets play in providing sources of continuous cash flow makes them especially important to investors and creditors.4 Thus, downward adjustments to current asset values are sometimes warranted to reflect declines in their future cash flow potential. For instance, Weston’s $86,000 accounts receivable shown in Figure 2.1 is reported at net realizable value (NRV). This means that Weston’s credit customers actually owe an amount in excess of $86,000; however, management believes that some of these accounts may not be collectible. Thus, Weston’s $86,000 (NRV) figure is an estimate of management’s most reasonable expectation of how much cash will eventually be collected. Although this estimate is somewhat subjective, it is considered more relevant to the external users of the company’s financial statements than the total dollar amount of accounts receivable actually outstanding.5
Noncurrent Assets
Noncurrent assets take much longer than current assets to provide benefits. Their benefits often span many years or decades. Unlike most current assets, noncurrent assets are not generally intended to provide direct sources of cash flow; instead, their primary benefit is the long-term support of cash-generating activities.
Weston’s balance sheet in Figure 2.1 reports noncurrent assets of buildings, equipment, and land. These assets are not expected to provide direct sources of cash flow because they are not currently for sale. Nevertheless, they provide a long-term infrastructure necessary to showcase inventory, sell products, and process customer accounts. Thus, these tangible noncurrent assets derive their value by indirectly supporting a company’s ability to generate future cash flow.6
It is important to realize that noncurrent assets such as land, buildings, and equipment are most often reported in the balance sheet at amounts based on their original acquisition costs, not their current fair market values. For instance, Weston’s balance sheet in Figure 2.1 reports land that was initially acquired for $80,000; however, its current fair market value could actually be much higher. Reporting noncurrent assets on the basis of their acquisition costs is a fundamental tenet of generally accepted accounting principles (U.S. GAAP) referred to as the historical cost convention. The rationale for this controversial principle is that determining the actual value of noncurrent assets can be extremely subjective. Thus, given that most noncurrent assets will not be sold in the foreseeable future, proponents of the historical cost convention argue that it is better to report them at objectively determinable acquisition costs than at subjective estimates of their fair market values.7
Finally, it is important to note that the buildings and equipment shown in Figure 2.1 are reported at a net book value (NBV) of $700,000. Although this figure is based upon the historical costs of these assets, their initial acquisition costs actually were in excess of $700,000. This topic is discussed more fully in Chapter 3; however, at this point, a simple explanation is warranted.
When a noncurrent asset (other than land) is first acquired, the cost of the asset is divided by its estimated years of useful life to determine the amount by which its NBV must be reduced each year in the balance sheet.8 For instance, assume that a business purchased a truck for $80,000 at the beginning of the year and at that time management estimated its useful life to be 8 years. At the end of each year, the truck’s NBV reported in the balance sheet will be reduced by $10,000 ($80,000 ÷ 8 years = $10,000 per year). Thus, after 8 years, its NBV will be zero.
The process described above is referred to as depreciation. Depreciation is not an attempt to measure wear-and-tear, technological obsolescence, or the decline of an asset’s fair market value. It is simply a systematic way to take into account the ongoing expiration of an asset’s future benefit potential with the passage of time. All tangible noncurrent assets other than land undergo this process. Land has an unlimited useful life, so its future benefit potential does not expire with the passage of time. As such, the historical cost of land reported in the balance sheet is not reduced systematically from year to year.
Liabilities
Liabilities are generally defined as economic obligations that require the future use of assets in settlement. Economic obligations arise from transactions that can be measured in monetary terms. In most instances, cash is the asset used to settle these obligations.9
Weston’s balance sheet in Figure 2.1 reveals two liability classifications: Current Liabilities and Noncurrent Liabilities. Both classifications are composed of economic obligations that require future settlement. What distinguishes current liabilities from noncurrent liabilities is when their settlement is due.
Current Liabilities
Current liabilities are obligations requiring settlement within one year, or one operating cycle, whichever is longer. Thus, they require settlement in the same time frame that current assets covert into cash. For reasons discussed previously, this means that current liabilities generally require settlement in one year or less. A company’s survival often hinges upon its current assets being capable of providing enough cash inflow to settle its current liabilities as they come due.
Weston’s balance sheet in Figure 2.1 lists two current liabilities: trade accounts payable and other accrued liabilities. Trade accounts payable are obligations that a company owes to its suppliers for credit purchases of inventory. Trade accounts payable are often a company’s largest current liability. This is certainly true in Weston’s balance sheet, which reports a $98,000 obligation to its inventory vendors. Weston’s only other current liability—other accrued liabilities—represents a combination of miscellaneous obligations other than those arising from inventory purchases. These unpaid obligations often include wages owed to employees, income taxes owed to the IRS, and interest owed to banks and other creditors. In Weston’s case, these obligations total $12,000. Had any of them been considered material in amount, they would be listed separately in the balance sheet with designations such as salaries payable, taxes payable, or interest payable.10 Determining the threshold of materiality is a subjective process requiring a great deal of judgment.
Noncurrent liabilities have settlement dates or maturity dates that often extend many years into the future. Unlike most current liabilities, noncurrent liabilities are backed by formal written contacts, including mortgage bonds, debenture bonds, and long-term notes payable. Most noncurrent liability contracts require scheduled debt service payments until the obligations are fully settled. For instance, a 10-year note payable owed to a bank might involve a series of 120 monthly payments.11 Those payments coming due in the near future—usually within one year—are reported as current liabilities in the balance sheet, designated as the current portion of long-term debt.
Weston’s balance sheet in Figure 2.1 reports only one noncurrent obligation—a $250,000 note payable. This obligation most likely arose from a decision to finance some of its noncurrent assets with debt. Later in this chapter, an examination of Weston’s statement of cash flows will reveal whether any long-term borrowing activity occurred in the current period.
Shareholders’ Equity
A simple two-word definition of shareholders’ equity is shareholder ownership. After subtracting from total assets all of a corporation’s obligations, what remains are ownership claims belonging to shareholders (A − L = E). These ownership claims stem from two sources: contributions from shareholders in exchange for shares of stock, and profits earned by the corporation that are retained and reinvested. The former is generally referred to as paid-in capital (or contributed capital), whereas the latter is referred to as retained earnings.
Paid-in Capital
Shareholder claims to assets arising from their capital contributions appear in the shareholders’ equity section of a balance sheet as common stock. All for-profit corporations raise capital by selling shares of stock to investors, and common stock is the most basic classification of stock that is issued.12 Common shares give investors voting rights in proportion to the number of shares they own—meaning that the more shares individual investors own, the more influence and control they have in determining who will be elected to the corporation’s board of directors. Thus, common stock ownership enables investors to have a voice in strategic decision making.
In the United States, corporations come into existence by obtaining a corporate charter from a particular state. A company does not have to conduct activities or maintain a physical presence in its state of incorporation. Nevertheless, it must abide by the regulatory laws of that state. Thus, the decision to incorporate in a particular state is based largely upon its regulatory flexibility and leniency. Delaware and Nevada attract many businesses to incorporate there for this reason.
Weston’s balance sheet in Figure 2.1 reports common stock of $150,000. Assuming that Weston is a publicly owned corporation, this figure is the total capital contributed by investors in exchange for common stock issued through initial public offerings (IPOs).13 Note that Weston’s common stock is designated as having no par value. Some states require that corporations establish a legal floor beneath which the price per share of an IPO must not fall. This minimum issue price is referred to as par value.14 If Weston were incorporated in a state that required par values, its common stock would be reported in the balance sheet using two separate lines instead of one. The first line would report the total par value raised by selling stock to investors (the par value per share times the number of shares issued). The second line would report the amount received from investors in excess of total par value. Together, the sum of the two lines would equal the $150,000 figure shown in Figure 2.1.
Unlike paid-in capital (which represents equity claims to assets from shareholder investment in common stock), retained earnings are shareholder claims to assets resulting from the retention of corporate profits to finance growth and expansion. The fruits of this good fortune belong to the shareholders—after all, as owners they have equity claims to what the corporation earns. The alternative to retaining profit is to distribute it to shareholders as dividends. The board of directors sets dividend policy and determines the amount of profit to be distributed as dividends and the amount to be retained for financing growth.
Weston’s balance sheet in Figure 2.1 reports retained earnings of $490,000. This figure represents total profits earned by the company over its entire existence, less any dividends declared since it was first incorporated.15 In theory, this amount represents undistributed assets potentially available to Weston’s shareholders as dividends. Yet, an examination of Weston’s assets reveals cash of only $24,000, which is significantly less than the $490,000 retained earnings figure. This is not an unusual situation given that the amount of cash that a company has in its possession is not equivalent to the earnings it has retained since its inception.
The differences between cash flow and earnings will be examined more completely in Chapter 3. At this point, it is time to shift the discussion away from the balance sheet and focus upon the income statement.
The Income Statement
Income statements—sometimes called earnings statements or statements of operations—report an enterprise’s results of operations for a period of time (often one year or one quarter). Conceptually—in its most basic form—an income statement can be expressed as an equation in which net income is the difference between revenue and expenses (Revenue − Expenses = Net Income).16 As discussed previously, net income increases retained earnings in the shareholders’ equity section of a corporation’s balance sheet.
Revenue
Revenues, often referred to as net sales, are increases in assets that result from providing goods and services to customers for a profit. Corporations earn the increases in assets that result from their profit-related activities; so in effect, these assets belong to the shareholders of the corporation. Thus, revenue also may be viewed as increases in shareholders’ equity resulting from profit-related activities. This makes sense, given that earning revenue increases net income, and net income increases retained earnings in the shareholders’ equity section of the balance sheet.
The timing of when revenue should be reported in the income statement is not always clear-cut.17 In most situations, however, revenue should be reported in the income statement whenever all of the following conditions have been met:
- A contract has been established between the seller and the customer.
- The seller’s obligations are clearly identified and stipulated.
- The total contract price is measurable and capable of being allocated to the seller’s specific obligations.
- The seller’s obligation has been satisfied, thereby completing the earnings process.
The first three conditions are satisfied when a seller and a customer mutually agree upon the measurable terms of a sale—such as the delivery of 5,000 gallons of diesel fuel at $4.00 per gallon by a specific date. The earnings process is considered complete when the seller has provided the goods or services in accordance with agreed upon terms.18 Once the first two conditions are met, revenue should be reported in the income statement even if a full cash settlement has not been received, so long as the likelihood of it being received is high. Such is the case in nearly all sales made to credit customers.
Weston’s income statement in Figure 2.2 reports net sales of $960,000. Net sales refers to revenue earned by a business net of any discounts or allowances. Consistent with Weston’s balance sheet, all of the amounts in the income statement are reported in thousands of dollars. Thus, Weston’s net sales in the current year were actually $960 million.
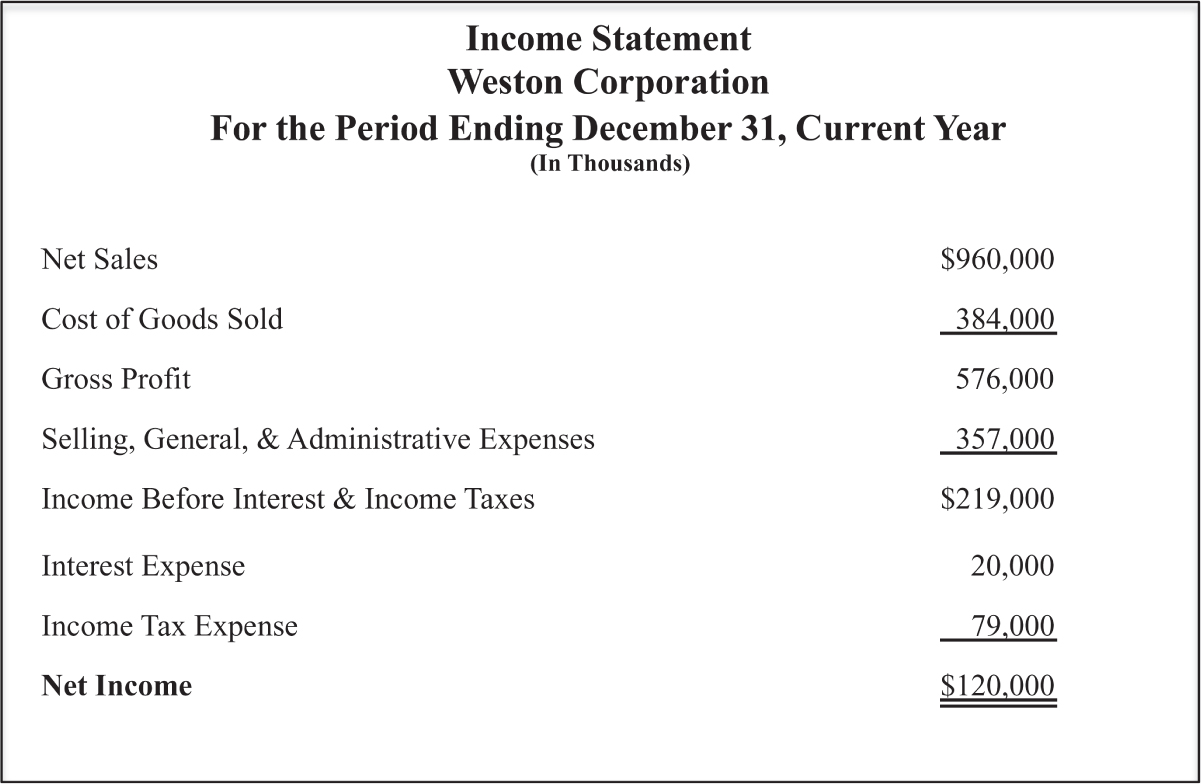
Figure 2.2 The income statement
The $960,000 net sales figure is revenue that Weston earned in the current year. This figure does not equate to the amount of cash it received from customers. As previously discussed, Weston’s balance sheet in Figure 2.1 reports accounts receivable of $86,000, indicating that a portion of its revenue is from credit sales to customers. Differences between cash received from customers and revenue reported in the income statement are examined more closely in Chapter 3.
Expenses
There is no such thing as a free lunch, and there is no such thing as free revenue—all revenue comes at a cost. To that end, expenses represent the cost of resources consumed to generate revenue. Expenses decrease net income reported in the income statement; so in effect, they also decrease retained earnings reported in the shareholders’ equity section of the balance sheet. This makes sense, given that shareholder claims to assets decrease as resources are consumed.
Expenses reported in the income statement arise from a very important tenet of financial accounting called the matching principle. The matching principle requires that income statements match the cost of resources consumed with revenue earned. Matching the cost of resources consumed with revenue earned is sometimes straightforward and objective; other times it is not. In many cases the matching process is rather arbitrary. This makes the measurement of net income for a specific reporting period a rather arbitrary process as well.
To illustrate, assume that a bakery sells bread to grocery stores using a delivery truck. To generate revenue, the bakery must incur certain expenses by consuming resources. In any particular year, several truck-related costs matched with revenue are easy to measure objectively. Examples include the truck’s insurance, fuel, and maintenance expenses, as well as the truck driver’s annual salary expense. But what about the bakery’s initial cost of acquiring the truck? The truck is a noncurrent asset that supports revenue generation for many years. Accordingly, a portion of its acquisition cost is matched with revenue each year over its useful life and its NBV reported in the balance sheet declines by an equal amount. This describes the depreciation process discussed previously. The amount of the truck’s acquisition cost matched each year with revenue reported in the income statement is referred to as depreciation expense.
If the bakery purchased the truck for $80,000, and estimated its useful life as 8 years, the income statement would report an annual depreciation expense of $10,000 ($80,000 ÷ 8 years = $10,000 per year). Likewise, the truck’s NBV reported in the balance sheet would decrease each year by $10,000.19 In essence, depreciation enables a portion of a noncurrent asset’s cost to be matched with revenue in the income statement and its NBV to be reduced in the balance sheet, signifying an ongoing expiration of its future benefit potential. The process keeps the accounting equation (A = L + E) in balance by reducing assets each year by the same amount that retained earnings is reduced in shareholders’ equity. In this simple illustration, the depreciation process reduces assets and equity by $10,000 each year.
Weston’s income statement in Figure 2.2 reports several expense and cost classifications. The $384,000 cost of goods sold figure represents the cost of Weston’s inventory that was matched with current year net sales. Cost of goods sold is referred to as a product cost because it matches the cost to acquire inventory (products) directly with revenue generated from selling it. Weston’s $384,000 cost of goods sold is matched with net sales of $960,000, resulting in a gross profit for the year of $576,000. The importance of measuring gross profit is discussed at length in Chapter 4.
The selling, general, and administrative (SG&A) expenses of $357,000 in Weston’s income statement are considered period costs because unlike product costs, they correspond to the time period in which revenue was generated, not to products that were sold. Weston’s current year SG&A costs may include:
- Marketing and promotion costs;
- Postage and shipping costs;
- Utility costs, such as electricity and natural gas;
- Administrative salaries and wages;
- Professional costs, such as legal and accounting fees;
- Travel costs;
- Office costs, such as telephone, Internet service, and printing costs;
- Depreciation expense associated with noncurrent assets, such as delivery trucks.
Weston’s income statement in Figure 2.2 separately reports interest expense of $20,000 and income tax expense of $79,000. The reason for listing these expenses as separate line items is discussed in Chapter 4. For now, it is important to recognize that the $20,000 interest expense relates to the $250,000 long-term note payable reported in the company’s balance sheet in Figure 2.1.
Weston’s net income figure of $120,000 is the bottom line measure of its results of operations for the current year.20 Any undistributed assets associated with this figure belong to Weston’s shareholders. The total claims to undistributed assets related to earnings are reported in shareholders’ equity of the balance sheet as retained earnings.
The Statement of Retained Earnings
The statement of retained earnings ties together retained earnings reported in shareholders’ equity at the beginning of the year with retained earnings reported in shareholders’ equity at the end of the year. Corporations expand in size as they generate profit, causing both their assets and their retained earnings increase. Any distributions of profit to shareholders as dividends cause both assets and retained earnings to decrease. Thus, the statement of retained earnings reports the net amount by which a corporation’s assets and retained earnings increase each year from the earnings it retains.21 As noted in Chapter 1, many corporations provide a more detailed statement of shareholders’ equity instead of the simpler statement of retained earnings.
Figure 2.3 illustrates how profits reported in the income statement flow through the statement of retained earnings and onto the balance sheet. These linkages are referred to as financial statement integration.

Figure 2.3 Financial statement integration
The financial statement integration diagramed in Figure 2.3 illustrates that net income reported in the income statement directly increases retained earnings. From the statement of retained earnings flows a net change in shareholders’ equity that reflects the portion of net income that was distributed as dividends. The net change in shareholders’ equity equals the net change in assets that results from the corporation’s retention of profits.
Weston’s statement of retained earnings in Figure 2.4 shows retained earnings of $385,000 at the beginning of the current year. This was the retained earnings amount reported in its balance sheet at the end of the previous year. The $120,000 net income figure was taken from the corporation’s income statement in Figure 2.2. The company’s net income, less $15,000 of dividends declared in the current year, is the net increase in Weston’s assets and shareholders’ equity that resulted from retaining $105,000 of its current year earnings ($120,000 − $15,000 = $105,000).

Figure 2.4 The statement of retained earnings
It is important to realize that publicly owned corporations are not required to pay cash dividends to their shareholders, and many profitable corporations do not.22 It is not unusual for relatively new corporations to forgo paying dividends and thereby retain their earnings to finance growth. An obligation to pay dividends arises only if the board of directors declares—as a matter of public record—that a distribution of dividends is forthcoming. Once the dividend has been declared, it typically takes 5 to 7 weeks for it to be distributed.
The Statement of Cash Flows
The statement of cash flows reconciles a company’s cash reserves at the beginning of a reporting period with the cash reported in its balance sheet at the end of the period. It does so by identifying all of a company’s sources and uses of cash during the period that resulted from one of three types of activities: operating activities, investing activities, and financing activities. It is essential to understand how these cash flow activities impact a company’s survival.
Weston’s statement of cash flows is illustrated in Figure 2.5. Note that cash flows from operating activities are listed first, followed by those from investing activities second, and those from financing activities third. This is the sequence of presentation used by all U.S. Corporations. Weston’s $8,000 net increase in cash from all three activities in the current year, added to its $16,000 beginning cash balance on January 1, equals the $24,000 cash amount reported in its Figure 2.1 balance sheet at the end of the year.

Figure 2.5 The statement of cash flows
Cash Flow from Operating Activities
The operations of an enterprise relate to its ongoing profit-related activities. For this reason, profitability is often referred to as a company’s results of operations. Thus, cash flows from operating activities are receipts and disbursements of cash related to generating profit. Cash received from customers is the primary operating cash inflow for most companies, whereas cash paid for inventory, salaries, taxes, and various administrative costs represent major operating cash outflows. Operating cash flows are a company’s lifeblood of survival—meaning that to remain a viable going concern its net cash flow provided by operating activities must remain healthy.
Weston’s statement of cash flows in Figure 2.5 reports cash received from customers of $980,000.23 To be consistent with the other financial statements, all amounts are stated in thousands of dollars, meaning that Weston actually collected $980 million. Notice that the $980,000 received from customers exceeds by $20,000 the amount of net sales reported in the company’s Figure 2.2 income statement. The reason for the discrepancy is that revenue earned does not always occur at the same time that cash is collected from customers. In Weston’s case, many of its sales are made to credit customers. Thus, $20,000 of what Weston collected from customers in the current year corresponds to credit sales reported in a previous year’s income statement.24
Weston’s operating cash disbursements total $835,000, the largest of which are inventory purchases and payments of SG&A costs. Note that total disbursements do not equal the total expenses shown in the company’s Figure 2.2 income statement. This is because expenses are not always incurred at the same time that cash is disbursed. Reporting differences between the income statement and the statement of cash flows are examined more thoroughly in later chapters. For now, what is important to notice is that Weston’s current year operating activities provided a net cash inflow of $145,000. This is a favorable indication that the company was able to pay its operating costs as they came due.
Cash Flows from Investing Activities
Unlike operating activities, investing activities do not represent the cash effects of ongoing and recurring revenue and expense transactions. Instead, they generally refer to buying and selling noncurrent assets such as land, buildings, and equipment.25
Weston’s statement of cash flows in Figure 2.5 shows the cash effects of two investing activities. The first activity (the sale of land) resulted in cash proceeds of $18,000. The second activity (the purchase of equipment) resulted in a cash disbursement of $190,000. Thus, Weston’s investing activities resulted in a negative cash flow of $172,000 for the year. In contrast to negative net cash flows from operating activities—which can signal financial problems—negative cash flows from investing activities are often indicative of a strong financial position. Indeed, vibrant and successful enterprises make frequent investments in plant and equipment as they expand and flourish.
Cash Flows from Financing Activities
Financing activities refer to debt and equity financing transactions. Debt financing activities mostly involve borrowing money and repaying the loans. Equity financing activities often consist of issuing stock to shareholders and paying dividends.26
Weston’s statement of cash flows in Figure 2.5 shows the cash effects of two financing activities. The first activity (issuing common stock to shareholders) resulted in cash proceeds of $50,000. The second activity (the payment of cash dividends) resulted in a cash disbursement of $15,000. Thus, Weston’s financing activities provided $35,000 during the year. Both of these transactions are considered equity financing activities, which means that the $250,000 long-term note payable shown in the balance sheet in Figure 2.1 arose from debt financing activities in a prior year. Had the $250,000 been borrowed in the current year, the resulting cash proceeds would be shown in the current year statement of cash flows.
Dividends paid to shareholders are considered the cost of equity financing. Accordingly, they are classified as financing activities in the statement of cash flows. Interest payments to creditors are a cost of debt financing; however, they are classified among the operating activities in the statement of cash flows. The reasoning behind this seemingly inconsistent treatment of interest payments is that operating cash flows arise from revenue- and expense activities-associated net income determination. Given that interest expense is a component of net income, interest payments are considered operating cash flows. Dividends are not expenses, so they are not associated with net income determination. Accordingly, dividend payments appear as financing cash flows in the statement of cash flows.
Summary
Publicly owned corporations are required to issue four general purpose financial statements. These statements are primarily for investors and creditors. The balance sheet reports a corporation’s financial position. It does so by listing a corporation’s assets and claims to those assets by investors and creditors at a specific point in time. The income statement measures a corporation’s results of operations (revenues minus expenses) for a period of time. It reports revenue when it is earned and expenses when they are incurred, regardless of when cash is received or paid. The statement of retained earnings reveals how much of a corporation’s profits are retained each year and how much are distributed as dividends to investors. The statement of cash flows reports all of a corporation’s sources and uses of cash for a period of time. It does so by showing the cash effects of three kinds of activities—operating activities, investing activities, and financing activities.
Chapter 3 examines how relationships among the general purpose financial statements influence the measurement of income. Chapter 4 builds upon these concepts by examining how investors and creditors use financial statements to analyze profitability, liquidity, and solvency.
____________
1To streamline this illustration, the Figure 2.1 balance sheet reveals Weston’s financial position on December 31 of the current year only. Financial statements actually issued by publicly owned corporations are comparative, meaning that they provide several columns of financial information corresponding to multiple years.
2By restricting the assets reported in a balance sheet to economic resources, the value of indispensable human resources is omitted. The subjectivity and difficulty associated with measuring the monetary value of human capital preclude its direct inclusion in the financial statements.
3An operating cycle is the average time that elapses from when a business invests cash in inventory, sells that inventory to customers, and eventually collects the cash owed from those customers. For most retailers, wholesalers, and manufacturers, the time required to complete this cycle is significantly less than one year. Thus, current assets are generally considered those resources whose benefits will be realized in one year or less. Operating cycles and their measurement are discussed in Chapter 4.
4The importance that investors and creditors place on the cash-generating potential of current assets is a Chapter 4 topic. Here, it suffices to say that cash flow is important to investors and creditors because it impacts a company’s stock prices, its dividend policies, and its ability to satisfy debt obligations.
5Other current assets subject to valuation write-downs include investment portfolios that have lost value due to declining market prices and inventory items that have lost value due to damage, spoilage, or technological obsolescence.
6Tangible noncurrent assets are those having an actual physical substance, such as manufacturing equipment, buildings, vehicles, and land. These assets are commonly called fixed assets. Balance sheets also may include noncurrent assets that are intangible, such as patents, copyrights, and goodwill. Noncurrent assets can also be financial instruments held as long-term investments. The coverage of intangible assets and long-term investments is beyond the scope of this book.
7U.S. GAAP makes an exception to the historical cost convention when the future benefit potential of a noncurrent asset becomes significantly impaired. For example, assume that the discovery of groundwater pollution impairs the use of a land causing its estimated market value to decline significantly below its acquisition cost. In this situation, the land would be reported in the balance sheet at its more subjective estimated fair market value instead of its more objective historical cost. International Financial Reporting Standards do not adhere to the historical cost principle.
8An estimated residual (salvage) value is often subtracted from the asset’s acquisition cost before dividing by its estimated useful life; however, the general concept described here is the same.
9Liabilities are sometimes settled by delivering goods or services to customers. This form of settlement is discussed in Chapter 3.
10In financial reporting, the threshold of materiality refers to amounts so large that they have the potential to influence interpretations and decisions made by financial statement users. In Figure 2.1, the $12,000 other accrued liabilities figure is considered material in total; however, none of the obligations included in this figure is considered material individually. As such, they are not reported separately.
11In addition to reducing the principal amount of the outstanding loan balance, debt service payments typically include interest charges, as well.
12Some corporations also offer investors a classification called preferred stock; however, most corporations offer only common shares. If a corporation offers only one type of stock, it is required that its classification be common stock.
13Publicly owned corporations do not sell shares of stock directly to investors. Instead, they engage the services of investment bankers to make their shares widely available to brokers and other interested parties.
14Par values per share are generally set at extremely low amounts—often fractions of a cent. As such, they are of little significance and many states no longer require them.
15Certain events other than income and dividend activities have the potential to influence retained earnings and/or a shareholders’ equity account called accumulated other comprehensive income. These events are beyond the scope of this book.
16When expenses exceed revenue, the difference is referred to as a net loss.
17Complex measurement and reporting issues are associated with revenue from long-term installment sales contracts and from multiyear construction projects.
18If a contract specifies multiple obligations, a portion of the total selling price is allocated to each obligation, and revenue is recognized as each obligation of the contract is satisfied. Contracts can be formal written agreements or less formal verbal agreements.
19Notice that the truck’s NPV shown in the balance sheet at the end of each year equals its initial acquisition cost less its accumulated depreciation for the number of years it has been in service. Thus, after 3 years of service, the truck’s NBV would be $50,000 (its $80,000 historical cost, less 3 years of accumulated depreciation at $10,000 per year). The process of depreciation will be revisited in Chapter 3.
20Income statements issued by publicly owned corporations report results of operations for multiple years and include earnings per share (EPS) figures directly below net income for each year reported. EPS is discussed in Chapter 4. Moreover, corporations are required to include a separate financial statement called the statement of comprehensive income to report other revenue and expense items not included in their regular income statements. The accumulation of these other comprehensive income items from year-to-year is reported in the shareholders’ equity section of the balance sheet in a similar fashion to the manner in which retained earnings report the accumulation of regular income over time. The topic of other comprehensive income items is beyond the scope of this book.
21When a corporation suffers a net loss, its statement of retained earnings reports the amount by which assets and retained earnings have decreased.
22Corporations sometimes issue additional shares of common stock to their shareholders in lieu of distributing assets in the form of cash dividends. Stock dividend activities are beyond the scope of this book.
23Weston reports cash flows from operating activities using the direct method. In later chapters, an alternative presentation called the indirect method will be illustrated.
24This resulted in a $20,000 net decrease in Weston’s accounts receivable for the current year.
25Investing activities can also involve certain financial assets, such as portfolios of stocks and bonds. They can also include intangible assets, such as patents copyrights, and trademarks.
26Other financing activities, such as treasury stock transactions, are commonplace; however, they are beyond the scope of this book.