
In the previous chapter we covered mission and vision statements. We have also discussed how to define the client’s need (project objective) in a precise way in order to define the parameters of a consulting project and avoid project “scope creep.” Understanding mission and vision and defining the objective are critical to initiate a successful consulting project but are only the beginning of a process that will result in a successful outcome.
It is useful to understand all of the steps to be taken to complete a consulting project and to do them in the proper sequence. For this it is useful to remember the acronym MVOSSTE.
M—Mission
V—Vision
O—Objective
S—Situation Analysis
S—Strategy
T—Tactics
E—Execution
Understanding the mission and vision and defining the objective are critical elements when defining a project’s objective and developing a proposal and letter of engagement as was discussed in Chapter 3. After a client has agreed to move forward with a consulting project, the situation analysis, development of a strategy, tactics and an execution plan are critical to completion of a consulting project.
Situation Analysis (The Research Stage)
The situation analysis provides the consultant a thorough understanding of the environment in which the client is operating. This includes the nature of the market, key customers, and stakeholders, suppliers, legal environment, staff capabilities, competition, and other environmental elements that will have an impact on the client’s organization.
The situation analysis is evidence-based research that allows organization executives and consultants to fully understand the environment within which an objective will be pursued.
The research must be evidence based. Information that cannot be verified by third parties should be avoided. This is critical. If a recommendation is based on assumptions or flawed information, the recommendation will be flawed. Flawed recommendations can ruin the most critical asset of consultants—their reputation.
All too often consultants use assumptions or unverified information as a basis for formulating a strategy. More often than not this approach leads to failed strategies and unachieved objectives.
A situation analysis should include answers to the following:
- Who are the customers?
- How big is the market?
- Where are the customers located?
- Who are the competitors?
- What is the market share for each competitor?
- What is the value proposition offered by each competitor?
- How is the value delivered by the competitors?
- What are the barriers to market entry (financial, geography, technology, etc.)?
- How will strategic initiatives be funded (out of operation, debt, equity)?
- Who will do the work?
- Is a workforce available?
- Does the technology/process exist to execute the actions to achieve the objective?
- Is capital investment in equipment required?
- Are there legal hurdles to achieving the objective?
- What are the purchasing characteristics and processes used by the customers?
- Are there influencers to the purchasing decision?
- Are the buyers rational buyers as opposed to emotional buyers?
- What processes are currently in place to deliver products to the customers?
- For production processes involved, what is the work flow?
- Are there potential efficiency gains by reworking the workflow?
The earlier list is not exhaustive but should provide a good understanding of an organization’s operating environment and obstacles that may stand in the way of achieving an objective.
Additionally, a situational analysis should explore environmental conditions over which an organization has little to no control but may be able to develop a strategy that can take advantage of the new paradigm. Legal and technological changes are two of the most prevalent environmental impacts that can affect strategic marketing efforts.
For example, the Affordable Care Act has and will have a significant impact on the health care and insurance industries. These industries had some influence on how the law was designed but, at the end of the day, the health care and insurance industries have little control over the effect the new legislation will have on their organizations.
For organizations that are affected by new legislation or changes in the regulatory environment, it will be important to adjust operating strategies to meet the new operating requirements.
Technological changes can have similar effects. Personal computers have changed the landscape for media companies, retailers, health care providers, educators and many more.
When developing strategies, understanding market innovations and identifying possible market disruptions can be critical. Knowing if your client’s organization is in an industry that can or will be impacted by legal, regulatory or disruptive innovations can be critical to developing a successful marketing strategy.
Harvard’s Clayton Christensen’s theories on disruptive innovations can provide some insights into the market disruptions that may be on the horizon. His theories show that disruptive innovations often are created when industry leader’s products have been improved to the point that a significant share of the market’s customers do not want or need all of the product’s attributes. This allows a new market entrant to provide a lower cost “good enough” product that doesn’t have all of the “bells and whistles” of the industry leader’s product.
This new entrant will attract the least profitable customer of the industry leader and be somewhat protected since it will be difficult for the industry leader to create strategies focused on its most profitable customer (wants all the “bells and whistles”) and its least profitable customers at the same time.
The new market entrant, as a result, is allowed to grow its customer base by attracting more customers who are satisfied with a “good enough” product. Over time, the new entrant improves its offerings and attracts more customers from the market leader.
To use this principle to spot emerging opportunities requires a bit of research and the ability to identify potential market disruptions. The recommended steps are as follows:
- Identify markets ripe for disruption. A market ripe for disruption is one where the profits are very high and the mid- to lower-profit range customer base growth is at a point where it is stagnating or possibly shrinking. This is an indication that the products provided might have reached the point where customers may not want or need all of the attributes offered or that the price is reaching an unacceptable or unsustainable level. An example might be the health care industry. Here the cost of medical care has gotten to the point that health care without insurance is difficult to afford. Further, the costs are driving up insurance costs to the point that insurance is difficult to afford. While the total market for health care remains large and the demand is high, the lower economic segment of the market is stagnating and some individuals are foregoing all but critical health care.
The Affordable Health Care Act may bring insurance costs down and make health care available to a larger segment of the population. This will likely spur technological solutions for health care and provide market opportunities for “good enough” products that are effective, such as an mobile phone application that allows a clinical assistant to provide a diagnosis and treatment for certain noncritical maladies.
- Identify new market entrants that are focused on the industry’s least profitable customers. New entrants would be providing products that are less expensive than those provided by the industry leaders. For health care it might be the clinics operated by nurses that are located in grocery stores and drug stores. Another entrant for health care might be the telemedicine technologies that can provide diagnosis and some treatment protocols via telecommunications. For retailers, a disruptive technology was RFD mail delivery that spawned the catalog business in the late 1800s.
- Make sure that the new entrants are disruptors. There are certain new technologies that might appear to be market disruptors that are in fact a sustaining technology that can be used by market leaders to better serve their best customers. The Internet, for example, is considered a disruptive technology for the newspaper business. The problem with this conclusion is that the Internet market entrants targeted the newspaper’s most profitable customers. This, in the short run, had a significant impact on newspapers but it also allowed newspapers the ability to focus on counter strategies. That is, the new entrant didn’t focus on the least profitable customers; that would have created a dilemma for the newspapers to have to abandon very profitable customers to protect a marginally profitable customer base. The result is that newspapers and media companies have integrated the Internet into their businesses and are beginning to develop new digital strategies.
- Create an analysis that compares opportunities across industries. There may be similarities across industries that provide very large opportunities. RFD mail delivery provided an opportunity for retailers to reach new communities by providing non-custom, “good enough” wares to be ordered through the mail. This delivery also allowed opportunities to printing, graphic and media industries. The Internet has been a boon for social networking, search engines, and retailing but quickly became a key component for the delivery of new technologies such as telemedicine and energy production digital technologies.
- After going through this process there will be a large number of choices and even the best analysis may result in a less than optimal choice. The analysis will, however, likely increase the probability of identifying a potential market disruptor.
Possibilities for the next big disruptive technologies include:
- Telemedicine—This will provide the ability to deliver quality health care globally with smaller facilities on site. The new technologies will include bio-monitoring and feedback, micro robotics, and 3D high-resolution teleconferencing during diagnosis and treatment.
- Energy—Hydraulic fracking will continue to provide energy at lower costs. This technology will allow expanded global manufacturing capabilities in the United States as well as developing nations.
- Education—Internet-based college courses and degrees will increase and allow more training that directly impacts career development. College degree costs will drop and access to top tier universities will be available globally.
For a consultant, identifying and understanding potential environmental challenges may allow the development of programs to capitalize on the barriers in a way that creates a stronger market position. At the very it least, it will allow the consultant to develop recommendations that consider environmental conditions over which the client has little control.
Another element of the situation analysis is to take a macro view of the market and identify the job that consumers need done.
Theodore Levitt’s seminal work on marketing myopia stated that railroads were not in trouble in the 1970s because the need for moving people and products had diminished.
Railroads were in trouble because they viewed themselves as being in the railroad business instead of being in the transportation business.
Using Clayton Christensen’s theories on disruptive innovation, new forms of transporting people and products were not a disruptive innovation focused on providing the railroad’s least profitable customers with a “good enough” product. Rather, these new forms of transportation were a sustaining technology that would have allowed railroad industry leaders the ability to better serve their most profitable customers.
In this case we are suggesting that railroads are in the transportation business and considering the ability to provide transportation services to augment railroad delivery might be an option to consider when developing a strategy. Clearly if the industry focus is too narrow, some options won’t be considered.
The same is true of identifying the potential market. If a marketing strategist defines the market too narrowly, potential customers will be overlooked. Consider Southwest Airlines, one of the few airlines to consistently show a profit. Clearly they are in the transportation industry but what is their market? Many might say the market is made up of individuals needing airline transportation.
Southwest suggested that the market included airline customers but the focus was on individuals needing transportation for medium range distances. This meant that their market included individuals that could travel by automobile. This dramatically increased the size of the market and redefined the potential parameters of a marketing strategy.
Gathering information on the market and the competition is readily available if you know where to look. Information on the market is available through census data, industry data and consumer research. Most of this is readily available on the Internet.
Gathering data on the competition is also readily available. Some of the information can be taken from financial reports if the competitor is a publicly traded company. These reports usually give key statistics, profiles of key managers and basic financial data.
Information on competitors can also be gathered from customers, vendors, and public records. Developing financial profiles of a competitor’s business can also provide valuable information.
This information can point to some strengths and weaknesses of the competitors, opportunities and threats in the market place and in the environment.
Strategy (Solution for Client Success)
The strategy is an approach that will be used to achieve the client’s objective. All strategies should consider the impact on the client’s organization, its customers, and collaborators (suppliers, vendors, alliances, service providers, banks, etc.)
Following is a discussion of how a strategy might be developed for a consulting client.
Building the Optimal Strategy
In order to develop a strategy, a consultant must consider how value will be created for the consultant’s client (known as the company), the client’s customer (known as the customer) and the client’s collaborators.
Pictured in the graphic shown, the highest strategic pricing value is created when the value for each of the participants (customers, collaborators and the company) coincide or overlap.
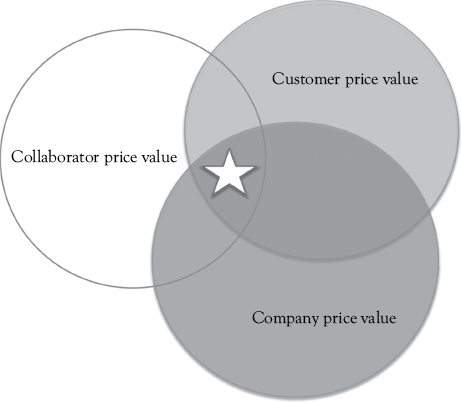
The larger the area of common value, the greater the chance for strategic success. As the overlapping areas decrease in size the more difficult the strategy will be to execute successfully. For example, in the case of a marketing strategy, the consultant would consider separate strategies for price, place (supply chain), product and promotion. For each of these elements there would be an area of overlap that would create value for the customer, company and collaborators.
The following grid allows the strategist to identify the optimal strategy for price, place (supply chain), product and promotion (the 4 Ps).
Marketing Mix Value Grid
Area above and to the right of the shaded diagonal cells creates value for the company. Area below and to the left of the diagonal shaded cells creates value for the customers and collaborators.

To find optimal marketing mix that creates value for customers, company and collaborators, line up horizontal and vertical squares that are in line with each of the shaded squares. Each optimal marketing shaded diagonal square has six squares that must be evaluated.
When the area of the participant’s common value is identified for each of the 4 Ps an overall strategy can be developed. The optimal marketing strategy will be when the optimal area of overlap for each of the 4 Ps (price, place, product, and promotion) are combined as is shown as follows.
A company that seems to have accomplished the development of an optimal marketing strategy is Coca Cola.

The Coke price seems to be within the range customers are willing to pay and provides distributors and the company the revenue required for a successful operation.
Coke is available to customers when and where they want to consume the product. The territories are large enough for the bottlers (collaborators) to provide the distribution to the customers and the distribution supports the market share objectives of the company.
The Coca Cola products are numerous and varied enough to meet the customer’s needs, provide bottlers with a means of expanding the revenue base and provide the company with the capability to maintain and grow market share.
Finally, the promotion programs underscore the company’s mission by aligning Coke with happiness and refreshment for the customer and supports the bottler’s and the company’s efforts to maintain and grow market share.
For financial or process strategies, the focus would most likely be on financial processes or workflow. Still any strategy would consider the organization, the customer and the collaborators. Consider an objective to use internal cash flow to fund a new organizational initiative. Simply diverting cash available from ongoing operations could have a negative impact on customers and collaborators. Similarly, an objective of reducing operation costs could have a negative impact on customers and collaborators unless care is taken to insure efficiency gains do not impact the organization’s ability to deliver products on time.
Strategy Worksheet Example—The following is an example of a strategy for price, place, product and promotion and the strategy worksheet developed for a regional newspaper consulting client based on the findings of the situational analysis.
Product—Focus on local and regional news coverage, develop products for conversion of print products to digital products including digital preprints (ad circulars), develop customized news and information delivery capabilities and software applications. Develop classified free digital classified ads with a print upgrade.
Price—Low cost for all digital products and cost-based pricing for print products. Preprint (ad circulars) delivery would be priced to compete with ad circular mailing products. Create “value pockets” that provide customized information for demographic groupings of readers which would serve as high-value customer groupings for advertisers.
Place—Print products delivered with long-term plan to convert to digital delivery. Preprint delivery would be by news carrier or post office with long-term plan to convert to digital delivery.
Promotion—Emphasize local news and shopping information, original content, and classified ads with impact. For advertisers, emphasize low cost per reach.
Since each strategic move has implications for the organization, each of the strategies considered should be measured against the impact on the organization as shown in the chart as follows.
Strategy Impact Chart
|
Product |
Price |
Place |
Promotion |
|
|
Workforce |
Content stringers, mixed with employees for content. Internal sales staff. |
High productivity for staff through technology |
Outsource and contract for printing and distribution. |
Internal brand manager. Outsource ad campaigns. |
|
Cash requirements |
Minimize fixed expenses for facilities, and so on. |
Cash flows maximized |
Distribution costs below revenues. |
Utilize efficient promotions but have constant market pressure |
|
OP. Procedures |
High use of technology and outsourcing |
High use of technology and outsourcing |
High use of technology and outsourcing |
High use of technology and outsourcing |
|
Cap. equip. requirements |
Outsource software development and lease equipment. |
Outsource software development and lease equipment. |
Outsource software development and lease equipment. |
Outsource software development and lease equipment. |
Copyright GWR Research 2013.
At this point the strategist has a pretty good feel for what is needed to begin considering tactics. The tactics will describe each action to be taken by the client. The result will be a comprehensive plan that can then be converted into a budget that will be an important part of the client’s execution plan.
As a marketing strategy is developed it is important to recognize that individual elements of the strategy do not stand alone. Price, place, product, and promotion are interconnected. Price can affect the image of the product and the organization and influence the nature of the promotion. Promotion can affect the price, the product and the mode of distribution.
As each of the 4 Ps has an impact on the others, they have an impact on cash flow requirements, management systems, workforce requirements, and capital equipment.
It is important that the process take place in the sequence described earlier and that the original vision and mission set the parameters for all actions. If strategy development does not follow a disciplined approach, there is a chance that the outcomes hoped for by the organization’s leaders will not be realized.
Tactics
The tactics describe the process that will be deployed to implement the strategy to achieve the client’s objective. Tactics consider the findings discovered in the situation analysis research. For each item considered in the situation analysis, an action should be considered that would allow a successful attainment of the objective through the chosen strategy. Using the newspaper example introduced in the strategy section the following tactics planning chart was developed.
This is a simple example but provides an idea of how to use this tool to keep the strategic process on target and when completed have a document that can guide the implementation process.
Execution
Execution describes how a client’s organization will utilize its workforce, financial resources, capital equipment, and methods and processes to execute the tactics supporting the strategy used to achieve the objective. Tactics will identify activities that will need to be completed using specified resources to achieve an objective within a specified time.
Marketing Tactics Planning Chart
|
Product |
Price |
Place |
Promotion |
|
|
Workforce plan |
Content stringers, mixed with employees for content. Internal sales staff. Outsource printing. |
High productivity for staff through technology |
Outsource and contract for distribution. |
Internal brand manager. Outsource ad campaigns. |
|
Workforce organization |
Develop program to encourage stringers to find compelling local and regional stories. Internal sales staff structured by customer segment |
Contractors are given a set price for articles. Sales force commissions are focused on achieving sales goals. Inability to meet sales goals results in reduced pay. |
Printing outsourced to quality printers based on bid process and guarantee of press time. Alternate printers would be available for overflows and emergencies. Distribution contractors bids for delivery area would be awarded based on rate and quality. |
Brand manager would find a mix of media to meet goals within prescribed budget. |
|
Workforce procedures |
Develop standards of performance for contractors and employees. |
Develop standards of performance for contractors and employees. |
Develop standards of performance for contractors and employees. |
Develop standards of performance for contractors and employees. |
|
Workforce controls |
Develop metrics to evaluate workforce productivity and success. For example, Sales per person, articles per week, and so on. |
Develop metrics to evaluate workforce productivity and success. For example, Sales per person, articles per week, and so on. |
Develop metrics to evaluate workforce productivity and success. For example, Cost per page, cost per address delivered. |
Develop metrics to evaluate workforce productivity and success. New customers per promotion. |
|
Cash plan |
Cash needed to cover operating costs, operating facilities and capital expenditures |
Use discounts for early payment and penalties for slow payments. Negotiate vendor payments that allow cash collections to cover payments |
Long-term lease for offices. Purchase of central office if better use of cash |
Production costs included in promo expense. Negotiate for media rates use trade out if possible. |
|
Cash organization |
All receipts and vendor payments made through central bank |
All receipts and vendor payments made through central bank |
All receipts and vendor payments made through central bank |
All receipts and vendor payments made through central bank |
|
Cash procedures |
Invoices approved by operating manager, submitted to accounts payable for payment. Lock box for customer payments |
Invoices approved by operating manager, submitted to ap for pmt. Lock box for customer payments |
Invoices approved by operating manager, submitted to ap for pmt. Lock box for customer payments |
Invoices approved by operating manager, submitted to ap for pmt. Lock box for customer payments |
|
Cash controls |
Performance metrics—profit/unit, net cash flows, and so on. |
Metrics—mark up /product, profit/unit, sales volume. |
Rev./sq.ft., cost/sq.ft., and so on. Cost/customer delivery vs. rev/customer delivery |
Sales volume change per $ of media expenditure, surveys to measure impact |
|
Systems plan |
Financial and MIS reporting |
Financial and MIS reporting |
Financial and MIS reporting |
Financial and MIS reporting |
|
Systems organization |
Departments prepare reports for mgt each month |
Departments prepare reports for mgt each month |
Departments prepare reports for mgt each month |
Departments prepare reports for mgt each month |
|
Systems procedures |
Departments prepare reports for mgt each month |
Departments prepare reports for mgt each month |
Departments prepare reports for mgt each month |
Departments prepare reports for mgt each month |
|
Systems controls |
Financial, MIS and performance metrics reviewed each month |
Financial, MIS and performance metrics reviewed each month |
Financial, MIS and performance metrics reviewed each month |
Financial, MIS and performance metrics reviewed each month |
|
Equipment plan |
Lease major equipment, purchase small equipment |
Lease major equipment, purchase small equipment |
Lease major equipment, purchase small equipment |
Lease major equipment, purchase small equipment |
|
Equipment organization |
By department |
By department |
By department |
By department |
|
Equipment procedures |
Defined by dept. mgt and approved by senior mgt. |
Defined by dept. mgt and approved by senior mgt. |
Defined by dept. mgt and approved by senior mgt. |
Defined by dept. mgt and approved by senior mgt. |
|
Equipment controls |
R&M costs vs. revenue production, Rev/FTE, Cost/Unit |
R&M costs vs. revenue production, Rev/FTE, Cost/Unit |
R&M costs vs. revenue production, Rev/FTE, Cost/Unit |
R&M costs vs. revenue production or brand impact. |
For example, if promotion is going to be used as a tactic in the earlier example as a means of increasing market share, a few tactics might be described as:
- Hold quarterly lunch meetings with high-profile target customers—Feb., May, Aug., Nov. at a cost of $500 each.
- Develop an e-mail and social media program targeting high profile target customers—weekly at a cost of $2,000 per month.
Once the activities for all tactics are identified and scheduled (using CPM, PERT, or Gantt) and resources required for the activities are quantified, an operational plan and budget are created as project management devices. The budget is used as a control to insure the strategy and tactics are implemented on time and within allocated expense funding.
Key Performance Indicators—Key performance Indicators should be included in any recommendation to provide guideposts for those implementing the consultant’s recommendations.
Determining the business area to be monitored and the type of indicator will vary by business type. For example, in retailing, customer satisfaction may be gauged by repeat visits by customers, frequency that merchandise is returned and customer complaints. For airlines, customer satisfaction indicators might include lost luggage and on-time departure and arrival statistics.
Key performance indicators should provide a gauge of success in achieving internal goals as well as comparing performance with industry averages or industry leaders. Having a comparison to the industry prevents managers from becoming myopic when measuring results.
Some companies produce key performance indicator reports monthly and distribute them with financial reports to managers and senior staff. By combining key performance indicators with financial outcomes, a manager is able to get a clearer picture of what is working well and what needs attention.
For example, a financial report might show a profit level that is meeting expectations or that revenues are at expected levels. Viewing key performance indicator reports may show that product sales volumes are higher than expected and that labor costs are below expectations. Here a manager looking at just the financial reports would assume everything was operating in an acceptable range and that significant improvements couldn’t be made.
By analyzing nonfinancial performance indicators such as products produced per labor hours used and revenue per product, a manager in the foregoing example might find that the products are being sold at lower than planned rates and employee productivity reduced labor costs enough to offset lower revenue per unit sold.
This might cause a manager to ask why the products were sold at lower than planned rates. Further study might find a problem with marketing efforts, sales staff or product quality. Follow-up actions might result in solutions that would allow unit rates to increase while maintaining sales volume resulting in increased revenues and profits.
It is a good idea to have operational managers report on key performance indicators in their area of responsibility on a regular basis. Monthly reporting is preferred but such reports should be required at least quarterly. This disciplined approach to reporting on key performance indicators will train managers to fully understand the implications and relationships of the indicators to overall organizational performance.
Key performance indicators to be reported on might include the following:
Workforce Performance Indicators
- Payroll costs per full time employee equivalent;
- Products produced per person hour;
- Customers served per person hour;
- Revenue per person hour;
- Benefit costs per full-time equivalent;
- On-the-job injuries per month;
- Employee payroll and benefit cost per product sold or customer served.
Production Division Indicators
- Percentage of available machine time used;
- Repair and maintenance hours as a percent of available machine time;
- Material waste per unit produced;
- Defective products per 1,000 produced.
Financial Indicators
- Days in accounts receivable;
- Interest cost or discounts lost due to late payment;
- Discounts received for early or timely payments;
- Days of material in inventory;
- Inventory turns per inventory payment cycle.
Customer Satisfaction Indicators
- Customer product returns per 1,000 products sold;
- Customer complaints per 1,000 customers;
- Customers served per person hour;
- Number of out-of-stock reports per product line.
Sales and Marketing Indicators
- Revenue per customer;
- Profit per customer;
- Market share;
- Sales per sales employee;
- Sales administration costs per customer;
- Advertising costs per customer;
- Advertising and marketing costs per product sold.
This list of indicators can be expanded or customized to meet specific business needs.
Using key performance indicator reporting on a regular basis will provide useful information for actions that will improve the overall performance of any organization.
Conclusion
While some consulting projects will focus on the situation analysis in order to provide strategic information to a client, it is appropriate for the consultant to consider possible strategies and possible outcomes. Using the MVOSSTE process will provide the consultant and the client with plans of action that consider the client’s goals, resources, and capabilities.