

Esther Sans Takeuchi was born on September 8, 1953 in Kansas City. She is the daughter of Latvian immigrants, who, after the Soviet Union occupied Latvia following World War II, fled to a refugee camp in Germany. Her parents stayed in Europe for six more years, moving to the United States in 1951. When she started school in Ohio, Esther spoke the Latvian she was familiar with from home and barely any English. Her father was an electrical engineer. Esther graduated from the University of Pennsylvania with bachelor's degrees in both chemistry and history. Subsequently, she earned her Ph.D. in organic chemistry from Ohio State University. Dr. Takeuchi learned electrochemistry during two postdoctoral positions, the first at the University of North Carolina with Royce Murray and then with Professor Janet Osteryoung at SUNY Buffalo. For most of her career Esther worked at Greatbatch, Inc., a medical device company founded by the inventor of the implantable pacemaker. Providing power to these implantable devices is a difficult challenge. Esther's first project at Greatbatch was working on the implantable cardiac defibrillator, which is used to treat irregular heartbeats. The battery for the defibrillator is required to provide short pulses of high power in addition to lasting up to 10 years. Today hundreds of thousands of these devices are implanted annually. Over the years, Esther has proved to be an unusually prolific innovator—she holds more than 150 patents. After 22 years with Greatbatch, she took a faculty position at the University of Buffalo. In 2012, she moved to Stony Brook University as a Professor in the Departments of Materials Science and Engineering and Chemistry. She also holds a joint appointment as Chief Scientist, Brookhaven National Laboratory.
In 2004, she was elected a member of the National Academy of Engineering. Esther is a Fellow of the Electrochemical Society and a past President of the Electrochemical Society (2011–2012). In 2009, Dr. Takeuchi was awarded the National Medal of Technology and Innovation. This award is the highest U.S. award for technical achievement and is bestowed by the President. The award reads, “…for her seminal development of the silver vanadium oxide battery that powers the majority of the world's lifesaving implantable cardiac defibrillators, and her innovations in other medical battery technologies that improve the health and quality of life of millions of people.” Esther was also inducted into the National Inventors Hall of Fame in 2011. In 2013, Professor Takeuchi received the E.V. Murphree Award in Industrial & Engineering Chemistry from the American Chemical Society.
Image Source: Courtesy of Esther Sans Takeuchi.

Chapter 8
Battery Applications: Cell and Battery Pack Design
8.1 Introduction to Battery Design
Given the critical role that the battery plays in many applications, the specifications or requirements that a battery must meet can be numerous and detailed. For example, an engineering specification for an automotive battery may be 30 pages or more in length. In contrast, we will only consider design of the main features of a battery in this introductory treatment. For simplification, we assume that the cell chemistry has already been selected. Our task is to take a cell of known chemistry and determine the size, number, and arrangement of cells required to assemble a battery that meets a desired set of basic specifications. Some of the more important requirements are tabulated in Table 8.1. Note that three items, discharge time, nominal voltage, and energy, are highlighted in bold. These represent the three most critical design specifications for a battery once the desired chemistry has been determined. Other important characteristics of the battery can, for the most part, be derived from these. For example, battery size (mass and volume) is largely determined by the energy and the battery chemistry. The average power, which is important for many applications, can be determined from the energy and the discharge time. Peak power, on the other hand, requires an additional specification.
Table 8.1 Important Battery Requirements
| Requirement | Units | Comments |
| Discharge time | hours | Nominal operation time for application, inversely proportional to rate capability |
| Nominal Voltage maximum, and minimum voltages |
V | Output voltage of the battery string, not an individual cell |
| Energy | W·h | Capacity of the battery. Linked to average power and discharge time |
| Weight or mass | kg | Closely related to energy stored in battery |
| Volume | m3 | Closely related to energy stored in battery |
| Peak power | W | Power for a short pulse of fixed time, 30 seconds, for instance |
| Cycle life | – | Number of charge/discharge cycles before capacity or power capability is reduced by 20%, for example |
| Temperature of operation, minimum, maximum | °C | Expected nominal, minimum, and maximum environmental temperatures |
| Calendar life | years | Beyond the scope of this text |
To illustrate, let's consider a lithium-ion battery for an electric vehicle application that requires a discharge time of 2 hours, 24 kW·h of energy, and a targeted battery voltage of 360 V. The nominal single-cell voltage depends on the cell chemistry and has a value of 3.75 V for the lithium-ion cell considered here. The number of cells in series is simply,
Thus, a minimum of 96 cells connected in series is needed. Later we will explore the advantage of using a high battery voltage. Cells connected in series are referred to as a string. Multiple strings of cells can be placed in parallel to increase the capacity of the battery or to reduce the single-cell capacity needed to meet the performance requirements. In this example, we will use two parallel strings, so that n = 2. The total number of cells is
which is the product of the number of cells in series (m) and the number of cell strings connected in parallel (n). Next, we can determine the capacity of each individual cell based on the energy storage requirement for the battery. The energy of an individual cell is just its capacity times its voltage (Ecell = QcellVcell). The total energy of the battery (Ebatt) is the sum of the energy from each individual cell (Ebatt = NcEcell). It follows that
Thus, a configuration of a total of 192 cells, each with a capacity of 33 A·h, is required. The cells in the battery are arranged in two parallel strings to achieve a nominal voltage of 360 V. Note that the capacity per cell would have been twice as large if only one series string had been used.
8.2 Battery Layout Using a Specific Cell Design
A battery consists of a collection of cells that are electrically connected with series and parallel combinations. The general nomenclature is (mS-nP), which means that m cells are connected in series and n of these series strings are connected in parallel. The total number of cells, Nc, is m × n. All of the cells together make up the battery (also referred to as a battery pack or simply pack). Sometimes, a subset of the cells is housed together in a module. The primary question we want to answer in this section is, for a given cell design, what is the best way to combine cells together to achieve the design objectives?
For a fixed number of cells, Nc, there are many layouts or different ways of electrically connecting the cells. A generic layout is shown in Figure 8.1. In the previous section, we saw how the voltage requirement determines the number of cells that must be placed in series. Here, we consider the resistance of the battery, which has a crucial impact on its peak power. In principle, any combination of n cells in parallel with m cells in series is acceptable so long as Nc = mn. Assuming that all cells are identical, each with an open-circuit potential of ![]() and an internal resistance of Rint, the total resistance of the battery can be calculated:
and an internal resistance of Rint, the total resistance of the battery can be calculated:
Series connections (m) increase the resistance of the battery, and parallel connections (n) reduce the resistance of the battery. Similarly, series connections cause the battery voltage to increase, and parallel connections increase the capacity and current. Therefore, ![]() , and
, and ![]() .
.

Figure 8.1 Possible series–parallel layout for a total of mn cells.
Assuming that the battery is ohmically limited,
Power from the battery is
Thus, we see the power from the battery is just the power from an individual cell times the number of cells, and is independent of how the cells are connected together. However, we must have a sufficient number of cells in series to meet the voltage requirements of the application as we have seen previously. Also, there is typically a maximum current specified for the system, since wires, connections, and electrical devices must be sized to handle the system current without, for example, excessive heating. A key advantage of higher voltages is that they result in lower currents and therefore smaller wires and smaller motors for a given power.
The above analysis only included the internal resistance of the cells in the battery pack. How does the situation change if, in addition to the internal resistance, the resistance of the connections between cells is incorporated? There is some resistance in the wires between cells and a contact resistance associated with each electrical connection. For this situation, we need to add the resistance external to the cells to the combined internal resistance calculated from Equation 8.4:
where ![]() is the combined wire and connection resistance between each cell and on each end of the string. Clearly, the lower the external resistance, the higher the maximum power and the greater the energy obtained from the battery. As indicated in Equation 8.7, the external resistance can be calculated from the resistance of the connecting wires and the individual contact resistances. These connections, and therefore the external resistance, vary according to the battery layout. The effect of the battery layout is explored in Illustration 8.2.
is the combined wire and connection resistance between each cell and on each end of the string. Clearly, the lower the external resistance, the higher the maximum power and the greater the energy obtained from the battery. As indicated in Equation 8.7, the external resistance can be calculated from the resistance of the connecting wires and the individual contact resistances. These connections, and therefore the external resistance, vary according to the battery layout. The effect of the battery layout is explored in Illustration 8.2.
There is one other term that comes up frequently in describing batteries: the module. In Section 8.1, we considered a 24 kWh device where 192 cells were combined to form the battery, with two strings in parallel. However, in practice, a battery design such as this would not likely be implemented as simply a 96S-2P arrangement. Rather, cells would be grouped into modules. For example, in this instance, four cells could be combined to form a module, where each module is 2S-2P and housed together in a single case with one pair of terminals. Forty-eight of these modules are then strung together in series to form the battery (Figure 8.2).

Figure 8.2 Creation of a battery from modules. Each module consists of four cells combined, two in series and two in parallel.
In this section, we have assumed that the cell design was fixed as a constraint, and we examined how cells of that type might be connected to meet the desired specifications. In the next sections, rather than use a fixed design, the design of the individual cell is considered. In Illustration 8.2, if we had a choice, we may have decided to select a smaller capacity cell and increase the voltage to, for example, 200 or 300 V, in order to further reduce the current.
8.3 Scaling of Cells to Adjust Capacity
We've seen that the cells are connected in series to achieve the desired voltage of the battery. The capacity is increased by adding cell strings in parallel. However, each cell requires its own casing, safety reliefs, terminals, and connections, to which we will collectively refer to as ancillary. Clearly, we would like to reduce the volume, mass, and complexity associated with these ancillaries. One way to accomplish this is to group cells into modules as was discussed briefly in the previous section. An alternative way is to reduce the number of cells by increasing the size of the individual cells. We will examine this alternative now.
The reason for increasing cell size is to increase its capacity, recognizing that the capacity of a battery is a function of the amount of reactive material present. Consequently, we begin by developing a quantitative relationship between size (volume) and capacity. To do this, we use a primary lithium thionyl chloride battery as an example. The overall reaction for this battery is
Two of the reaction products are solids that deposit at the positive electrode; the other product is sulfur dioxide gas. Also, note that the ![]() electrolyte participates in the reaction. Therefore, the cell volume must include space for the gas that is formed, and should ideally account for the decrease in electrolyte volume as the reaction proceeds. For our purposes here, we adopt the battery construction shown in Figure 8.3. The negative electrode is a foil of lithium metal, and the positive electrode is porous carbon. The volume of the cell is the sum of the volume of individual components: negative electrode, positive electrode, separator, positive current collector, negative current collector, and the excess volume. The total cell volume is therefore
electrolyte participates in the reaction. Therefore, the cell volume must include space for the gas that is formed, and should ideally account for the decrease in electrolyte volume as the reaction proceeds. For our purposes here, we adopt the battery construction shown in Figure 8.3. The negative electrode is a foil of lithium metal, and the positive electrode is porous carbon. The volume of the cell is the sum of the volume of individual components: negative electrode, positive electrode, separator, positive current collector, negative current collector, and the excess volume. The total cell volume is therefore
For a given capacity Q [A·h], the negative electrode (lithium) volume is given by Faraday's law
The quantity 3600 converts A·h to coulombs. fa is a design factor that is included because excess lithium is needed. Since current is also collected by the lithium foil, we don't want to consume all of the lithium, even at full discharge.

Figure 8.3 Construction of LiSOCl2 cell.
The positive electrode is a porous carbon material. It must have an initial pore volume that is in excess of the volume of solid reaction products resulting from the discharge. The volume of solids produced is the sum of the sulfur and lithium chloride, and both are proportional to the capacity.

ε is the initial void volume fraction of the positive electrode. fc is a second design factor that represents additional porous volume in the positive electrode. Similar to the excess lithium required, some pore volume must remain, even at full discharge. The next three volumes are, respectively, those associated with the separator, negative current collector, and positive current collector.
where ![]() represents thickness. Each of these volumes is proportional to the separator area, which wraps around both sides of the positive electrode for the design shown in Figure 8.3; therefore, the separator area is divided by two to get the area for the positive current collector. Volume is also needed to accommodate the gas that is formed. We won't go into details for calculating the excess volume needed, but it stands to reason that it also should be proportional to the capacity, which we will express as
represents thickness. Each of these volumes is proportional to the separator area, which wraps around both sides of the positive electrode for the design shown in Figure 8.3; therefore, the separator area is divided by two to get the area for the positive current collector. Volume is also needed to accommodate the gas that is formed. We won't go into details for calculating the excess volume needed, but it stands to reason that it also should be proportional to the capacity, which we will express as ![]() . Substituting this relationship and Equations 8.9, 8.11 and 8.12 into Equation 8.8 gives
. Substituting this relationship and Equations 8.9, 8.11 and 8.12 into Equation 8.8 gives

With the separator area held constant, for two times the capacity, the nominal current density is twice as large. This immediately leads to a couple of concerns. First, with a larger current density, the ohmic, activation, and concentration polarizations of the cell increase, resulting in a lower cell potential for a given current. At this higher current density, the cutoff voltage for the cell will be reached sooner, leading to a lower effective capacity. Second, as we saw in Chapter 5, as the current density increases, the distribution of current through the thickness of a porous electrode becomes increasingly nonuniform (Figure 5.6). Assuming that the reaction products precipitate near where they are formed, there is the possibility that the pores in the front of the electrode will be filled before the discharge is complete. At best, the added capacity would not be used effectively. Therefore, increasing the thickness of the electrodes while maintaining a constant cell area is not recommended for large increases in capacity. This approach would only be chosen if the design fully accounted for the above effects or if the scaling factor were small, say 10–15%.

Figure 8.4 Two methods to increase capacity of a cell by a factor of 2.

Figure 8.5 Three approaches to the scaling of 10 A·h thionyl chloride primary cell.
Another alternative, shown as Option 2 in Figure 8.4, is to keep the thickness of the electrodes and other cell components the same, and to increase the capacity by increasing the area of the cell. If the separator area is scaled with the capacity, Q, it follows that the volume scales by the same factor. What's more, from Equation 8.14 the average current density is constant and electrochemical performance does not change appreciably. The resulting volume as a function of capacity is shown as O2 in Figure 8.5. The cell volume scales linearly with capacity, but is larger than the volume calculated for the previous case (Option 1). This is because the volume occupied by the separator and current collectors remained constant for Option 1, but scales with the capacity for the second option.
Can we continue to scale the capacity of the battery indefinitely by increasing its area? No, because other factors will eventually become important. One of these factors is the resistance associated with the two current collectors and their connection tabs as shown in Figure 8.6. This resistance, if important, can be reduced by increasing the thickness of the current collectors. Problem 8.7 explores the effect of scaling the thickness of the current collector by the cell area. This third option, shown as O3 in Figure 8.5, results in an even larger volume. However, it does lead to more confidence regarding cell performance.

Figure 8.6 Resistance of the current collectors for lithium-ion cell.
Another alternative to increase capacity is to stack several electrodes or plates together in a single assembly. This configuration is shown in Figure 8.7 and represents a common approach used in both lead–acid and lithium-ion cells. The same electrode active material is placed on both sides of a current collector. This assembly is not a bipolar configuration—the individual electrodes or plates are electrically connected in parallel within a single cell. Additional plates with the same cross-sectional area are added to increase capacity. With the configuration shown in Figure 8.7, it is possible to keep the separator area and electrode thicknesses constant while varying the planform size independently by the addition or removal of plates to yield the desired capacity. The key differences between the configuration shown in Figure 8.7 and simply increasing the size of the electrode are manifest in the current collection, which avoids problems associated with large electrodes, and in planform size. Note that a single current collector serves two electrodes and will need to be sized accordingly. The use of plates to form a battery cell most closely represents case O2.

Figure 8.7 Stacked assembly of plates or cells, connected in parallel.
Finally, we have not considered the volume of the battery casing, tabs, and vents. Volume or mass package factors can range from 1.5 to 1.8. However, the volume of these ancillaries will not change the sizing principles discussed in this section.
8.4 Electrode and Cell Design to Achieve Rate Capability
In the previous section, we examined ways to increase cell capacity in order to decrease the number of cells required in a battery pack. In this section, we examine the impact of cell design on the rate capability or power of a cell. For a given cell capacity, the current and current density are inversely proportional to the time of discharge, which is a key parameter for our discussion in this section:
Thus, long discharge times correspond to low-rate capability, and short discharge times denote high-rate capability. We'll explore the impact of discharge time on electrode design through a lead–acid cell example. Before doing that, it may be useful to describe qualitatively the process that will be followed in the example. We begin with a cell that is designed for high capacity rather than high rate. We then scale the capacity of that cell down to the capacity that we need for a high-rate application (starting your car). That scaling is done according to the principles of the previous section where the idea is to keep the electrochemical characteristics constant while changing capacity. Therefore, the scaled cell is still designed for capacity rather than rate. Finally, we examine how to modify the cell, keeping the capacity constant, in order to improve the rate performance.
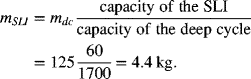
The lead–acid chemistry is almost universally used to start the automotive engine. Colloquially, it is called a SLI (starting–lighting–ignition) battery. High power is needed, but only for a short period of time; the total capacity is less important. Under normal operation, the state-of-charge of an SLI battery does not change substantially. SLI batteries typically have a capacity of about 60 A·h. Other designs of lead–acid batteries are used for back-up power where they deliver power over much longer periods (on the order of hours or tens of hours). In contrast to SLI applications, batteries for backup power applications undergo a large change in SOC during routine operation, operate at a lower specific power, and have a substantially higher capacity. Often these types of cells are referred to as high-capacity or deep-cycle cells. How are the designs of the SLI and deep-cycle cells different? To answer this question, our approach will be to start with a deep-cycle lead–acid cell and then to discuss changes needed to create a SLI cell. The procedure was described above and results are found in Table 8.2, where the bolded numbers represent SLI specifications.
Table 8.2 Design Parameters for SLI and Deep-Cycle Cells
| Feature | Existing deep-cycle cell | Deep-cycle cell scaled for SLI capacity | Desired SLI cell |
| Nominal voltage [V] | 2 | 2 | 2 |
| Capacity [A·h] | 1700 | 60 | 60 |
| Discharge time | 10 hours | 30 seconds | 30 seconds |
| Cold cranking amps | NA | 71 | 560 |
| Mass [kg] | 125 | 4 | 16 |
| Internal resistance [mΩ] | 0.4 | 11.3 | 1.4 |
| Cycle life | 500 (50% SOC) | 2000 (3% SOC) | |
| Quantities in bold are fixed for the SLI cell. | |||
First, we scale the existing deep-cycle cell from its capacity (1700 A·h) to the desired capacity (60 A·h) of the SLI battery using the cell area. In other words, we decrease the cell area in proportion to the capacity. The internal resistance scales approximately as,

The resistance increases with decreasing cell area since a higher voltage drop is required to drive the same current in the smaller cell. We further assume that the mass of the cell will scale directly with the capacity or area.
SLI batteries are rated in cold-cranking amps (CCA). SAE J537 (Society of Automotive Engineers publication) specifies that this value is the maximum current that can be sustained for 30 seconds at −18 °C without having the voltage drop below 7.2 V (this assumes a nominal 12 V battery that consists of six cells in series); the corresponding voltage for a single cell is 1.2 V. We would like to estimate the CCA for the scaled cell and compare it to the SLI specification. To do this, we use the following equation:
which neglects the effect of temperature. Using the calculated value for the internal resistance of our scaled cell, we estimate the current corresponding to the CCA as 71 A. This current is about eight times lower than the required value of 560 A. Clearly, simple scaling of the deep-cycle cell to the desired SLI capacity will not meet the performance requirements for the SLI battery. Consequently, the electrode design must be changed in order to lower the resistance and increase the power. In doing so, we do not need to nor want to increase the capacity of the battery.
A strategy for increasing the power at constant capacity is to make the individual electrodes or plates thinner as illustrated in Figure 8.8. The amount of active material is the same, but we have used many more (thinner) plates in the SLI design. This strategy does two important things that both increase the rate capability of the cell. First, the electrode thickness is reduced, making it easier to access the available active material. Second, the cell area is increased, leading to a lower current density for a given battery current. Ignoring the benefits of the thinner electrodes for a moment, we can estimate the cell area that is needed to adequately lower the internal resistance.
An internal resistance of 1.4 mΩ is calculated; therefore, the cell area must be increased by a factor of about 8 (11.3/1.4). Thus, to achieve the desired power, the separator area for the SLI battery would need to be about eight times that of the deep-cycle battery, which would result in electrodes that are approximately eight times thinner. In practice, the electrodes are designed to be thinner and also more porous to further reduce the resistance. Thus, the rate performance benefit is significantly greater than that due to just the increased area.

Figure 8.8 Comparison showing the internals of a deep discharge and an SLI lead–acid battery. Both are 12 V and have the same amount of active material. The electrodes for the SLI battery are thinner, with multiple plates connected in parallel to reduce the internal resistance of the cell.
What about the specific capacity? If we discharged the SLI battery at a rate comparable to that of the deep cycle (C/10), would it have a similar specific capacity? The rudimentary analysis just presented suggests that the specific capacities would be the same. However, for each plate, a current collector is needed, and additional separator area is required. When we account for this additional mass, the specific capacity of the SLI cell is lower. More important than the specific capacity is the cycle life. SLI batteries perform very well at the limited DOD for which they are designed. However, while the details are beyond the scope of this chapter, commercial SLI batteries show rapid degradation and a short lifetime when cycled over a large SOC window.
8.5 Cell Construction
To this point in the chapter, we have examined several aspects of cell and battery design. This section takes a brief look at ways in which cells and modules are constructed. The mechanical designs can be complex, and often manufacturers differentiate their products on these attributes.
Almost invariably, it is desirable to have cells and modules in a sealed container. In the case of lithium batteries, for instance, contact of the active materials with water and oxygen must be avoided; thus, a hermetic seal is required. The internal components of some cells can be exposed to the atmosphere, but it is still generally preferable to have a sealed design in order to prevent escape of electrolyte and any gases generated during normal operation. The container or casing is either metal or plastic, depending on the application. Gases can be generated due to normal operation or due to an internal cell failure. Uncontrolled venting of gases as a result of cell faults varies from mild to violent, and depends on the chemistry and size of the cell. Thus, with a sealed casing, a means of safety pressure relief (Figure 8.9a) is needed to avoid injury and equipment damage. The complexity of the pressure relief system depends on the needs of the particular application. Each case must also include a positive and a negative terminal. Any current that enters or leaves the cell or module must pass through the terminals. Terminals come in a wide variety of sizes and shapes, and have features that manifest little uniformity among manufacturers.
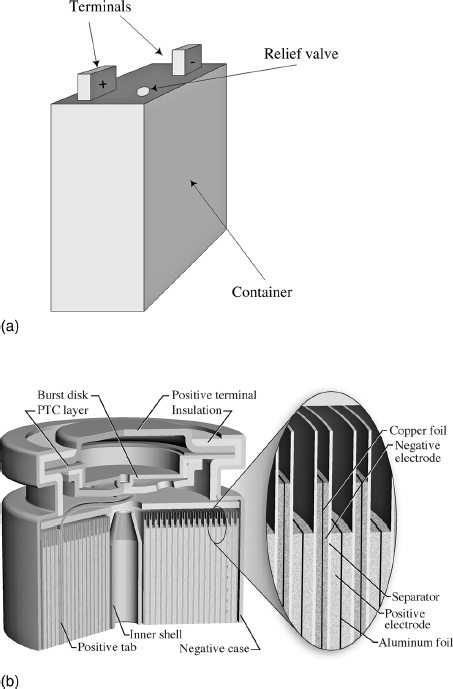
Figure 8.9 Cell configurations (a) A prismatic cell showing terminals and relief valve. (b) Spirally wound cylindrical cell.
Cells may take many forms. Here we will discuss only the more prevalent types: prismatic, plate designs, cylindrical, and coin. Prismatic cells take the shape of a rectangular prism, or simply a three-dimensional rectangular object with six faces that are rectangles. Because they can pack together efficiently, prismatic cells are preferred where space is limited. One method of forming a prismatic cell is to stack electrodes (plates) together as shown in Figures 8.7. The size and shape of the electrodes can be controlled independently. Multiple cells can also be combined and connected in series to create a battery as shown in Figure 8.8. The details of a prismatic design will depend on the cell chemistry. For instance, both lead–acid and lithium-ion cells can be made in a prismatic form, but the design details are quite different.
The common alkaline cell is cylindrical and probably already familiar to you. Construction starts with a steel can, which also serves at the current collector for the positive electrode. Active material is then molded to the inside wall, a separated introduced, and the negative material and electrolyte added. A metal pin is inserted to collect the current for the negative electrode before sealing the can. An alternative method of creating cylindrical cells is to wind two electrodes around a core. The winding consists of current collectors coated with active material on both sides and two separator layers, as shown in Figure 8.9b. The winding is then inserted into a casing. The capacity of the cell is increased by adding more windings. Although the typical form of a spirally wound cell is a cylinder, prismatic cells can also be made this way.
Coin or button cells (Figure 7.2) are used extensively in research and in many consumer applications. Most often they are used where only a single, small cell is needed. Similar to prismatic cells, they find use where space is limited. In a coin cell, two circular electrodes are separated by a porous material. The cell components are sealed in a coin (button)-shaped metal can, where a gasket is used to prevent the top and bottom of the can from being in electrical contact. In this design, the top and bottom of the can serve as the terminals.
Another important role for cases and packaging is to provide a force to keep battery components in electrical contact and to reduce the redistribution and loss of material during cycling. Although this force is generally not as critical for batteries as it is for the bipolar design used in fuel cells, a means of providing compressive load is often desired and can be essential for some applications and designs. Mechanical issues are considered in more detail in Section 8.10.
8.6 Charging of Batteries
We now shift our discussion from battery design and construction to battery performance. In this section, we begin our look at performance with a description of battery charging. Charging is the process by which electrical energy is put back into the battery. A variety of different procedures or protocols are used for charging. These protocols depend on the battery chemistry, the application, and, to some extent, the battery manufacturer. We can broadly differentiate the methods used for charging based on cell chemistry, and specifically, whether or not the cell can tolerate overcharging. Lead–acid and NiCd cells are both tolerant of overcharge and, in some instances, even benefit from some overcharge. In contrast, lithium-ion cells cannot be overcharged without causing permanent damage. When a cell is overcharged, this means that more coulombs are passed with charging than are required to fully charge the cell. The ratio is known as the charge coefficient:
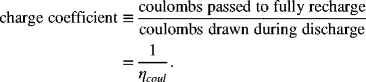
Note that this charge coefficient is related to the coulombic efficiency introduced in Chapter 7. Batteries with a coulombic efficiency less than 100% will have a charge coefficient greater than 1. The extra coulombs indicate that a side reaction is occurring, such as hydrogen and oxygen evolution in aqueous systems or SEI formation and electrolyte decomposition for lithium-ion cells.
The two basic methods of adding charge are charging at constant current (CC) and charging at constant voltage. In the first of these, the cell is charged at a constant rate (e.g., C/2–C/8 depending on the battery). During the charge, the potential of the cell rises, and charging is allowed to continue until a specified voltage is reached. The second basic method is to hold the potential of the cell constant and allow the current to vary. Constant voltage (CV) is seldom used as the sole means of charging a cell because very large currents are possible at the beginning of the charge if the voltage is held constant at its final value.
Often, these two basic methods are combined: constant current charge followed by a constant voltage charge (CCCV) as shown in Figure 8.10. In this combined method, charging is done at constant current until a specified maximum voltage is reached. Once that voltage is reached, charging continues at a fixed potential and the charging current decreases with time. This decrease in current with time is known as a current taper. The current is allowed to decrease until it reaches a specified value at which the device is considered to be fully charged. Using this protocol, the majority of charge is added in the constant current mode, but the time spent charging in each mode is roughly equal. For a lithium-ion cell, which cannot tolerate overcharge, charging is stopped once the specified current is reached (C/20 for example), and the charge coefficient is very close to one.

Figure 8.10 Constant current–constant voltage charge (CCCV).
Two other charging protocols deserve mention. The first is pulse-charging (Figure 8.11). Here the charging current is not constant, but rather is interrupted by brief periods of rest. In some cases, the cell may even be discharged briefly. The pulse-charging protocol has been widely applied to different cell chemistries. Although more complex and not without controversy, there are some reported advantages, namely, more rapid charging and a reduced extent of sulfation for lead–acid cells.
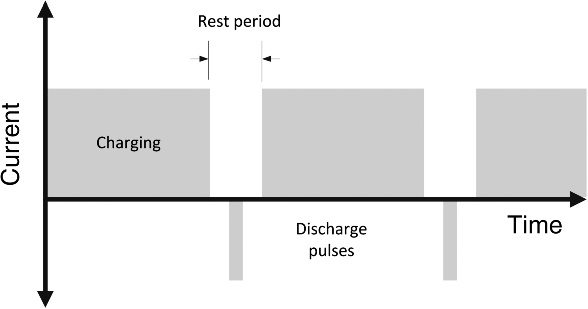
Figure 8.11 Pulse charging.
The final charging protocol we will consider relates to the use of charging to counteract the effects of self-discharge. Although its magnitude varies greatly, all cells exhibit self-discharge. For some secondary battery applications, for example, standby power applications, the user expects that the battery will always be available and near a full state-of-charge. The most obvious strategy for addressing self-discharge is to occasionally recharge the batteries after a substantial standby period has passed. This strategy is used for lithium-ion cells and other cells that do not tolerate overcharge. An alternative that works for cells that can be overcharged is to put the cell on a float charge following the constant voltage portion of a normal charge cycle. The float charge, commonly used with lead–acid batteries, continues to pass a small current through the cell indefinitely in order to maintain a full state-of-charge. Note that the float charge portion of the cycle is not used in the charge-coefficient calculation.
This section has examined a few of the issues related to battery charging as a subset of battery performance. We next examine battery resistance as a way of evaluating the health of the battery, which is a comparison of its current performance with that achieved initially.
8.7 Use of Resistance to Characterize Battery Peformance
The laboratory tests to determine the capacity and rate capability of a cell that were described in Chapter 7 can also be applied to a battery and are not repeated here. Rather, the focus in this section is on the use of resistance to provide information on the power capability and health of the battery. Health in this context is a measure of the condition of the battery relative to its initial “full performance” state.
There are a number of resistances defined and used by specialists, and some care is needed in identifying the specific quantity of interest. We begin with the ohmic resistance, which was used extensively in Chapters 6 and 7, and throughout the book. Ohmic resistance is determined from the high-frequency intercept of an electrochemical impedance spectrum or, equivalently, from current interruption. Its measurement and meaning are unambiguous. Although this ohmic resistance is used extensively in research, it is not the cell or battery resistance commonly used in practice. The resistance used commercially is a more loosely defined term that depends on the specific application. While there are many variations, the general idea is the same. The concept and its relationship to the ohmic resistance are illustrated in Figure 8.12. After a period of rest, two short current pulses are applied, one for charging and one for discharging. During discharge, the potential of the cell drops instantaneously and then decreases with time. The immediate drop represents the ohmic resistance of the cell as described in Chapter 6. The further decrease that occurs in the time interval from ![]() (just after the instantaneous drop) to t1 is due to activation and concentration polarizations in the cell. The discharge resistance for the cell or battery includes all of these polarizations (ohmic, activation, and concentration) and is defined as the change in potential divided by the change in current:
(just after the instantaneous drop) to t1 is due to activation and concentration polarizations in the cell. The discharge resistance for the cell or battery includes all of these polarizations (ohmic, activation, and concentration) and is defined as the change in potential divided by the change in current:
where the superscript d refers to discharge. Whereas the ohmic resistance depends on temperature and slightly on the SOC, the battery resistance defined by Equation 8.21 can have a strong dependence on SOC. It is also evident from Figure 8.12 that the resistance may vary with changes in the width or magnitude of the discharge pulse. Analogous to Equation 8.21, a resistance for charging can be defined, ![]() . These two values are different because the activation and concentration polarizations will change depending on whether a cell is being charged or discharged. To account for differences in battery size, the resistance is often normalized by the separator area of the cell. This quantity is the area-specific resistance (ASR) with units of Ω·m2. Again, as measured, this quantity includes ohmic, activation, and concentration polarizations.
. These two values are different because the activation and concentration polarizations will change depending on whether a cell is being charged or discharged. To account for differences in battery size, the resistance is often normalized by the separator area of the cell. This quantity is the area-specific resistance (ASR) with units of Ω·m2. Again, as measured, this quantity includes ohmic, activation, and concentration polarizations.

Figure 8.12 Pulse power test.
For preliminary analysis of batteries, we assume that the measured cell resistance is constant so that voltage losses vary linearly with the current. In fact, this practice is used extensively in this chapter. With use of the newly defined cell resistance, we can estimate the cell voltage as
Clearly, the magnitude of the resistance will directly affect the power capability of the battery. To quantify that impact, remember that the power is equal to IVcell, the current multiplied by the potential of the battery. Therefore, we can use Equation 8.22 and the definition of power to approximate the current at maximum power.
and
Equation 8.23 shows the relationship between the power and the cell resistance. It must be remembered that this relationship is approximate due to the simplifications we have made. In order for the maximum power and current to be meaningful, the pulse width (time) used in measuring the resistance must be similar to the time over which the power is required by the battery. So, a 10 or 30 seconds pulse may be appropriate for a charge-sustaining power assist hybrid-electric vehicle, but the time of the pulse would be too long to correspond to the current spike associated with starting an electrical motor. The same pulse would be too short for an application where the battery is supplying power for 5 or 10 minutes or more while a generator is started.
In this section, we defined a cell or battery resistance that includes ohmic, activation, and concentration losses. We estimated the effect of the cell resistance on the cell voltage and, therefore, the capacity of the cell, since the lower voltage limit will be reached more quickly by a battery with a higher resistance. We have also examined the impact of the resistance on the power or rate capability of the cell. Given its impact, resistance is a convenient way of characterizing battery performance, and the change in resistance with time as the battery is cycled provides a measure of the state of health (SOH) of the battery, defined generically as
SOH relates to the ability of the cell to meet its specified performance ratings. From the manufacturer, we assume that the battery meets its design goals, and therefore the “as received” SOH is 100%. There are numerous physical processes that cause the performance of the cell to degrade over time. Many of these processes also cause an increase in the cell resistance. Therefore, the cell resistance is one of the best ways to assess the SOH of the cell. While it is not the only method, it represents a common and effective way to make the desired assessment. Finally, we note that cell resistance changes with temperature, an effect that must be accounted for in order to make an accurate assessment.
8.8 Battery Management
In order to get the most out of the battery and to ensure safe operation, current flow in and out of the cells that make up that battery must be carefully monitored and controlled. A battery management system (BMS) serves this function. Generally, we have no means of looking inside a cell or module after it is built. Instead, the BMS uses measurements of current, potential, and temperature to control charging and discharging, and to estimate the SOC and SOH. Additionally, the BMS must communicate with other systems that interact with the battery pack. It must also provide the electrical hardware and software to accomplish cell balancing. Our purpose in this chapter is not to examine the architecture of the BMS and describe how it works; these topics are beyond the scope of this text. Here, we are concerned with the electrochemical processes that drive the need for a battery management system.
The importance of and the sophistication required in the BMS depend on the cell chemistry, the size of the battery, and the application. With regard to cell chemistry, it is critical to understand the consequences of overcharging and overdischarging a cell. As you know, lithium-ion cells cannot be overcharged without incurring damage, whereas overcharging can help to prolong the life of lead–acid cells. An important function of the BMS is to manage overcharging and overdischarging of individual cells.
One of the most important issues in the management of a multicell battery is keeping the individual cells in balance. Cell balance is another way of stating that, to the extent possible, the SOC of all of the cells should be the same. Despite our best efforts, the cells in a string will not behave identically. There can be variations from the manufacturing process that introduce small differences in the cell resistance or in its capacity. Even if these nonuniformities are eliminated, cells assembled into a battery can experience different temperatures, depending on their location in the pack. Cells can age differently too. Although the same current passes through each cell in series, this does not ensure that the state-of-charge of a given cell remains synchronized with that of the other cells in the string. Cells will not have exactly the same coulombic efficiency, which will affect the usable capacity of the battery. For example, every time the pack is charged, cells with lower coulombic efficiencies will not charge to the same extent as other cells in the pack. In spite of their poorer charge performance, these weak cells are likely to be discharged to the same extent as the other cells. This means that their SOC relative to the other cells drops each cycle. Eventually, the SOC of the weak cells will drop to zero. Prior to that, the cell is likely to be damaged, perhaps irreversibly. Damage of other cells in the string is also possible. Illustration 8.3 demonstrates the impact of lower charge efficiency on the SOC.
A similar imbalance situation arises if cells have slightly different rates of self-discharge (see Problem 8.13). The approach to dealing with these imbalances depends on the cell chemistry and, in particular, the tolerance of the cells for overcharge. For chemistries that can tolerate overcharge, the individual cells can be brought to nearly the same SOC by overcharging the battery or pack. Although not energy efficient, this approach is the simplest one to implement and does not require continuous monitoring of individual cell potentials.
For cells, such as lithium-ion cells, that cannot tolerate any overcharge, strict monitoring of the potential of individual cells is required. Fortunately, rates of self-discharge are low in lithium-ion cells and current efficiencies are near unity, reducing the rate at which imbalances take place; nonetheless, over time imbalances will arise. For a string of cells, the useable capacity of the battery is controlled by the capability of the weakest cell. To avoid the condition shown in Illustration 8.3, the cells must be balanced. Since overcharging is not an option, special circuitry within the BMS is required to individually balance the charge in every cell. As we saw previously, during charge the potential is held at the cutoff value until the current decreases to a set (low) value (∼C/20). In a string of cells, the current is constant, but the voltage will vary slightly from cell to cell. In passive balancing, energy is dissipated in a shunt resistor for cells with excess SOC. In other words, to avoid having the potential of any cell exceed the prescribed voltage limit, some current bypasses the cell through a shunt resistor. An alternative to passive balancing is active balancing. Here, energy from a cell with a high SOC is moved to a cell with a lower SOC. Active balancing requires more complicated electrical circuitry, but has greater energy efficiency.
Knowledge of the SOC is an important aspect of cell balancing. There are two approaches for determining the SOC. The first means is to simply count the coulombs passed relative to a known condition. In doing so, current is taken as positive during charge and negative during discharge.

where SOC(t0) represents the known condition. Let's consider some challenges with this approach. First, this method is only accurate if the current efficiency is close to one, although it can be corrected with use of an efficiency, if known. The SOC calculated by Equation 8.25 will also not be accurate if there are appreciable rates of self-discharge. Finally, since the capacity of the battery changes with time due to aging, the capacity used in Equation 8.25 should be the capacity at time t0. Temperature also influences capacity and must be considered in determining the SOC.
A second alternative to SOC determination is to measure the open-circuit potential of the cell or battery. With some chemistries, the potential change with SOC is minimal (Figure 7.4); with others it is substantial. When there is an appreciable change in the open-circuit potential with SOC, measuring the voltage of the cell is a quick way of estimating its SOC. Often, algorithms are used to combine these two approaches to estimate the SOC.
Finally, we close with a couple of comments about temperature. At either excessively high or low temperatures, the current in or out of the battery may need to be restricted by the BMS in order to avoid damage. Concerns include the possibility for thermal runaway at high temperatures, and the possibility of cell damage at temperatures that are too low for acceptable operation of the battery. Often individual lithium-ion cells have a positive temperature coefficient (PTC) current-limiting device that acts as a fuse to prevent thermal runaway. Thermal management is an important aspect of battery operation and will be considered in more depth in the next section.
8.9 Thermal Management Systems
The spirally wound cylindrical cell is particularly convenient to manufacture. Why then are these cells typically small? To answer this question, heat removal must be considered. A number of simplifying assumptions will be made, but the basic physics will provide clear guidance for the engineer. As was discussed in the previous chapter, during operation heat is generated in the cell. Here we will assume a resistive cell with a uniform rate of heat generation, ![]() (see Illustration 7.5). To solve for the temperature in the battery, we start with a differential energy balance:
(see Illustration 7.5). To solve for the temperature in the battery, we start with a differential energy balance:
This equation is applied to a cylindrical battery. keff is an effective thermal conductivity in the radial direction. There are no variations in the theta direction and we assume that the cell is long in the z-direction so that the problem becomes one dimensional, and in cylindrical coordinates,
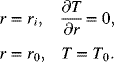
For the spirally wound cell, a sheet of current collectors, electrodes, and separators are wound around a shaft of radius ri, and the final radius of the winding is r0 (Figure 8.9b). Two boundary conditions are needed for Equation 8.27. We assume that no heat is conducted to the shaft and that the temperature is specified at r0:
Equation 8.27 is separable and upon integration, the solution is
Figure 8.13 shows the variation in temperature with radial position. As seen in Illustration 7.5, the rate of heat generation is proportional to the current, and therefore proportional to the C-rate.

Figure 8.13 Temperature profile in cell with C-rate as a parameter. Cell capacity is 1.6 A·h.
Next, we consider what happens when more windings are added to the cell. The capacity of the cell is directly proportional to the length, L, of the winding around the shaft. The diameter or radius of the winding can be determined from basic geometric considerations:
δ is the thickness of the sheet that is being wound.
The results are shown in Figure 8.13. As the capacity of the cell is increased (by adding windings), the temperature near the center, ri, increases. This relationship is shown in Figure 8.14. The combination of increased capacity and higher rates is limited by the maximum allowable temperature of the cell. Even though it is efficient to manufacture larger cells by winding more material, heat removal constrains this approach to adding capacity. This illustration also assumed that the temperature on the outside of the cell is fixed. A more realistic boundary condition would relate the rate of heat removal by conduction to the heat removal rate from the surface by convection. This refinement would result in even higher temperatures inside the battery.

Figure 8.14 Effect of rate and capacity on maximum temperature.
Storing large amounts of energy has inherent safety concerns. Although the challenge is best known with lithium-ion cells, many different types of cells can undergo thermal runaway. As illustrated previously, the operating temperature of a cell is determined by the heat generation inside the cell and the heat removal from the cell. This analysis assumed that the rate of heat generation was equal to the rate of heat removal; that is, a kind of steady state. As the rate of heat generation increases, the cell temperature rises until the rate of heat removal balances the rate of generation. Thermal runaway, in contrast, refers to a transient condition where the internal cell temperature rises uncontrollably. For aqueous batteries, thermal runaway is usually associated with a constant voltage or float charge. At constant voltage, the current decreases during the taper charge. If the temperature were to rise in one area, the resistance of the cell decreases (lower ohmic and activation overpotentials) and thus the local current density increases. There is, however, negative feedback in this system. As more charge is passed, the local equilibrium potential increases; and therefore, the overpotential decreases, causing the current density to go lower. What happens, during float charge or when most of the current is going into gas evolution? The current flowing does not change the local SOC of the electrode, and therefore the negative feedback is removed. Now more current results in more heat generation and a temperature rise. Higher temperature lowers the polarization, leading to more current and more heat generation. If not controlled, thermal runaway can occur.
8.10 Mechanical Considerations
Mechanical effects are important in battery design and operation, and are often underappreciated. They impact battery performance and longevity at a range of length scales from the stress that develops in submicrometer-sized particles of an active material to the macroscale structural requirements of a large battery pack such as the 2-ton battery pack used in a submarine. Frequently, the effects are specific to a particular chemistry and cell design. A few of these effects will be mentioned in this brief introduction, but the analysis is by no means complete or in-depth.
First, we consider variations in the volume of a cell. Volume changes can result from reactants and products with different densities. For instance, it is common for the negative electrode of a lithium-ion cell to experience a volume change of about 10% with lithium intercalation. At the same time, the positive electrode may change only 2% or less. Thus, there is a net change in the volume of a lithium-ion cell with state-of-charge. Volume changes in battery cells also occur as components expand and contract with changes in temperature. Internal stresses can be caused by thermal expansion as a result of different volume changes for the different materials that make up the cell. Whether caused by the reaction or by temperature, allowance for volume change is an important part of battery design.
Second, it is necessary for cell design to provide mechanical stability. Generally, we cannot let the cells be completely unrestrained (to account for volume changes, for instance). Cells in mobile applications are also subject to vibration and shock. Again, the specific needs vary significantly with the chemistry of the cell and with the particular application. For example, a small amount of compression is desired in order to prevent delamination (connected to volume change) in cells where the electrodes are coated onto a current collector. What if the compression is too high? Excessive compression can lead to creep of the polymer separator, causing a reduction in its porosity and resulting in increased resistance or increased mass-transfer overpotentials. This possibility is explored further in Illustration 8.4. Other cells will have different needs. Our purpose in this short section was to briefly introduce you to the mechanical issues that are an essential aspect of cell design and operation.
Closure
In this chapter, the process of selection and design of batteries was introduced. The key factors are discharge time, energy, and voltage. The discharge time profoundly influences the electrode and cell design. The energy, or capacity, determines the size of the battery. The desired voltage is achieved by connecting multiple cells together in a string. Capacity is changed by adding more active material, and several means of accomplishing this addition were considered, particularly with regard to rate capability. Proper monitoring and control of the current to the individual cells in the battery is critical during operation, but particularly during charging. Finally, the importance of thermal and mechanical aspects of battery design was introduced.
Further Reading
- Crompton., T.P.J. (2000) Battery Reference Book, Reed Educational and Professional Publishing Ltd.
- Keihne, H.A. ed., (2003) Battery Technology Handbook, CRC Press.
- Reddy, T. and Linden, D. (2010) Linden's Handbook of Batteries, McGraw Hill.
Problems
8.1. You are asked to configure a battery with the following requirements: 1512 W·h, 200–400 VDC, and a discharge time of 3 hours. A lithium-ion battery is available with the following specifications at a rate of C/3: nominal voltage of 3.5 V and is manufactured in two sizes: 3.3 and 4.5 A·h. The cutoff potential of the cells is 2.75 V, and the maximum charging potential is 4.1 V. What configuration would you recommend?
8.2. For the same battery specified in Problem 8.1, what would be the ideal capacity in A·h of the individual cells to achieve as close as possible to 300 VDC for the nominal voltage of the battery? Compare this answer to the configuration found in Problem 8.11. Which would be preferred and why?
8.3. Derive Equation 8.23 for the maximum power for an ohmically limited cell. What is the expression for maximum power if there is a cutoff potential greater than one half of the open-circuit potential?
8.4. You have a battery with a configuration of 50S-3P. The specifications for individual cells are open-circuit potential 3.1 V, an internal resistance of 2 mΩ, and a capacity at 1C of 7 A·h. Assuming the cells are ohmically limited, what is the maximum power that can be achieved? If individual cells have a cutoff voltage of 2.75 V, what is the maximum power? What must the value of the external resistance be to ensure that less than 5% of the available power is lost because of the connections?
8.5. The Tesla Model S electric car uses 6831 cells for the battery. The cells are the so-called 18650 (cylindrical, 18 × 65 mm) lithium-ion cells, each with a capacity of 3.1 A·h and a nominal voltage of 3.6 V. What is the capacity in kW·h for the battery? How might you configure these cells to make a pack? Discuss the challenges with packaging the large number of cylindrical cells. A battery voltage of 300–400 V is generally desired.
8.6. The nominal design of a 20 A·h cell is shown below. The tabs for current collection are on the same side and the dimensions of the cell ![]() are 140 × 100 × 15 mm3. Alternative designs are being considered.
are 140 × 100 × 15 mm3. Alternative designs are being considered.

| Option | Capacity [A·h] | L [mm] | W [mm] | Tabs |
| Nominal | 20 | 140 | 100 | Narrow, same side |
| 1 | 6.67 | 140 | 100 | Narrow, same side |
| 2 | 20 | 200 | 140 | Narrow, same side |
| 3 | 20 | 250 | 120 | Opposite sides, wide |
- Assuming that the electrodes and current collectors are unchanged and that the thickness of the current collector is small relative to the cell thickness, what are the cell thicknesses of the alternate designs?
- Discuss the advantages and disadvantages of these alternatives. For option 1, three cells are required to keep the capacity the same. Consider the following in your answer:
- heat removal
- uniformity of current density across the planform
- rate capability, resistance of current collectors and tabs
8.7. L is the characteristic dimension of the electrode, δ is the thickness of the current collector, and σ is its electrical conductivity. The width of the electrode, perpendicular to the section illustrated below, can also be assumed to have a length equal to L so that the area of the electrode exposed to the electrolyte is L2. Show that if the current density over the electrode is constant (iy), the resistance to current flow in the current collector is ![]() . This “average” resistance is defined as the total current that enters the current collector divided by the voltage drop across the current collector. Assume that electrical connection to the current collector is made at x = L, and treat current flow in the current collector as one-dimensional. Under these conditions,
. This “average” resistance is defined as the total current that enters the current collector divided by the voltage drop across the current collector. Assume that electrical connection to the current collector is made at x = L, and treat current flow in the current collector as one-dimensional. Under these conditions, ![]() . How should δ be scaled if it is desired to keep the resistance ratio of the current collector and electrochemical resistance constant? In other words, how should the thickness of the current collector be changed in order to maintain a constant resistance ratio if the size of the electrode, L, were increased or decreased?
. How should δ be scaled if it is desired to keep the resistance ratio of the current collector and electrochemical resistance constant? In other words, how should the thickness of the current collector be changed in order to maintain a constant resistance ratio if the size of the electrode, L, were increased or decreased?

8.8. For current collectors in lithium-ion cells, copper foil is used for the negative electrode and aluminum foil for the positive. Often the aluminum foil is about 1.5 times as thick as the copper. Why is this done?
8.9. Problems 7.3 and 7.4 examined the LiI battery that is used for implantable pacemakers. There is also a desire to have a defibrillator capability, where a short high pulse of power is occasionally required. Recall that the separator is formed in place from the overall reaction. Assume that all of the resistance is in the separator. At 37 °C, the LiI electrolyte has an ionic conductivity of 4 × 10⁻⁵ S·m−1. The open-circuit potential of the LiI cell is 2.8 V. What is the maximum thickness of LiI allowed so that the power requirements for the defibrillator (3 W) can be met? LiI has a density of 3494 kg·m−3. The cell area is 13 cm2. Is it feasible to redesign this LiI cell to include the defibrillator feature and still meet the energy and life requirements? Explain why or why not.
8.10. Using data from Figure 8.12, determine charging and discharging resistance of the cell. The answer should be in Ω·m2. Compare these values with the ohmic resistance of the same cell. Discuss why the values are different.
8.11. For a 125 A·h lead–acid cell, after a discharge from 100 to 20% SOC, 119 A·h was required to restore the cell to a full state-of-charge. Calculate the charge coefficient. How might this charge coefficient change with the rate of discharge? Temperature?
8.12. During charging of a lithium-ion battery, lithium ions are transported to the negative electrode, where they are reduced and then intercalate into the graphite active material. One limitation on the rate of charging is the concentration of lithium at the interface. If the rate is too high, then lithium metal can plate, which is a dangerous situation. This level of lithium is sometimes referred to as the saturation level.
- Qualitatively sketch the concentration profile of lithium in the electrolyte and in the graphite. How do these profiles change with the rate of charging?
- Discuss differences that correspond to the following charging protocols: (1) constant current density of 20 A·m−2 until the saturation level of lithium is reached, and (2) repeated pulses of charging at 25 A·m−2 for 3 seconds followed by a lower rate of 5 A·m−2 for 1 second.
8.13. Lithium-ion batteries have self-discharge rates of 1–2% per month. If two adjacent cells in a long string connected in series have rates of self-discharge of 1 and 2% per month, respectively, and the battery is fully charged each month, how long before the SOCs of these two cells vary by 5%? The rate of self-discharge, however, can be as high as 5% in the first 24 hours. If the initial rates of self-discharge for the two cells are 3 and 5%, respectively, how does the answer change? What role would the battery management system play in this scenario?
8.14. A cylindrical cell is fabricated by winding the electrodes around a shaft with a diameter of 2 mm. The length of the winding is 1.8 m and its thickness is 0.5 mm. If the rate of heat generation is 50 kW·m−3 and the effective conductivity in the radial direction is 0.15 W·m−1·K−1, what is the maximum temperature of the cell at steady state?
8.15. Rather than specifying the temperature at the outside of the cell as was done in Section 8.9, in practice heat is removed by forced convection. What is the appropriate boundary condition? Use h for a heat-transfer coefficient and T∞ for the temperature of the fluid. Solve the differential equation to come up with an equation equivalent to (8.28). In general, would liquid or air cooling be more effective? Why?
8.16. The analysis in Section 8.9 is for a cylindrical cell. Develop a similar analysis for a prismatic cell. Assume that all the heat is removed from the top and bottom of the cell (i.e., assume there is no heat loss from the sides). Furthermore, heat is removed from the bottom of the cell using convection through a cold plate (hc, Tc) and from the top to ambient, also by convection (ha, Ta).
8.17. Electrodes for lithium-ion cells are made by coating active material onto both sides of metal foils. The coated electrodes are then wound with a polymer separator or stacked to form a cell sandwich. Given the dimensions and physical properties in the following table, calculate the effective conductivity in the in-plane (||) and through-plane (![]() ) directions for a prismatic cell sandwich. What are the implications for the design of a cell and heat removal? Use the following formulas:
) directions for a prismatic cell sandwich. What are the implications for the design of a cell and heat removal? Use the following formulas:
| Component | Thickness, ti [μm] | Conductivity, ki [W·m−1·K−1] |
| Al current collector | 45 | 238 |
| Positive electrode material | 66 | 1.5 |
| Cu current collector | 32 | 398 |
| Negative electrode material | 96 | 1.0 |
| Separator | 50 | 0.33 |
8.18. Negative feedback was mentioned in Section 8.9 as an important feature in preventing thermal runaway of cells. For the following instances, explain the role of feedback in either reducing or exacerbating temperature variations.
- Because of ohmic resistance of the current collectors, the current density over the electrode is not uniform. The current density is higher near the tabs.
- During normal discharge of a single cell, heat removal is not uniform and a local temperature rise occurs at one spot in the planform of a cell.
- For valve-regulated lead–acid battery thermal runaway is a possibility during float charge at a fixed voltage. In these cells, rather than being vented, oxygen generated at the positive electrode is directed to the negative electrode where it reacts exothermically. Up to 90% of the current during float charge goes to this oxygen recombination.
8.19. Consumers desire to charge their electric vehicles as quickly as a conventional car can be refueled. If time for refueling with gasoline is about 2 minutes, at what C-rate would the battery need to be recharged in the same period? For a 50 kWh battery, what power corresponds to this rate? Frequently, researchers report extremely high rates of charge and discharge for tiny experimental cells, typically with very thin electrodes. What challenges exist in translating these results to a full-sized electrical vehicle battery?
8.20. A coin cell is prepared by sealing layers of material in a can. A spring washer is included to apply a controlled force on the assembly. Using the data for the layers below, if the final thickness of the sandwich is 2.4 mm, what is the normal stress? The spring has an initial thickness of 2 mm and a spring constant of 120 kN·m−1. The diameter of the layers is 1.4 mm.
| Cell component | Initial thickness [mm] | Elastic modulus [GPa] |
| Anode spacer | 0.50 | 210 |
| Anode | 0.070 | 15 |
| Separator | 0.025 | 1 |
| Cathode | 0.070 | 70 |
| Cathode spacer | 0.50 | 210 |
8.21. Derive Equation 8.29. (Hint: How might you express the volume of the wound and unwound cell?)