The Three Lines of Defense (3LoD)
Most companies have multiple types of audit activities that take place throughout the organization. Examples could include quality control, supplier audits, distributor audits, process improvement functions, environmental testing, security audits, systems intrusion testing, and many others. All of these are generally performed by independent groups primarily to:
• comply with contractual terms and conditions;
• create more reliable products;
• comply with regulatory requirements;
• create more efficient and effective processes; and
• address other risk elements.
Typically, these groups are not cross-functional in nature, nor are there any synergies gained from their efforts. The primary common characteristic is that they are addressing risks of an organization. Does it make sense to have all these separate functions working relentlessly in silos to improve the company’s performance without realizing or recognizing any synergies? This question brings us to our next topic—Three Lines of Defense (3LoD) model. The 3LoD model has been around for many years and was initially created by the military and later adapted in sporting events. After years of its existence in different “applications,” the 3LoD was formalized for business purpose as the 3LoD model developed in 2008–2010 by the Federation of European Risk Management Associations (FERMA) and the European Confederation of Institutes of Internal Auditing (ECIIA) as a guidance for the 8th EU Directive stating in Section 41, 2b: “[...] the audit committee shall, inter alia: monitor the effectiveness of the company’s internal control, internal audit where applicable, and risk management systems […].”
While this definition is relatively vague, it has been a basis from which organizations and companies have structured their governance model. See the 3LoD model shown in Figure 13.1.
It seems only logical that the 3LoD activities should also be deeply engaged into the risk management function at all levels.
After the initial introduction of 3LoD, it is now time to share why we brought up the 3LoD topic in the first place. Let’s consider a situation where a company CFO and CEO needed to respond to the organizations within their company that were experiencing audit fatigue. This fatigue was ostensibly being caused by the Internal Audit Department conducting an excessive number of audits in a very uncoordinated manner. These organizations claimed that there were overlapping audits, duplicative audits, surprise audits, audits lacking follow up, and so on. From a company’s Chief Audit Executive point of view, it became obvious that the main reason for this was a wide misconception as to “who” the auditors were conducting all of these audits, because the company audit plan had only four audits spread out over the year.
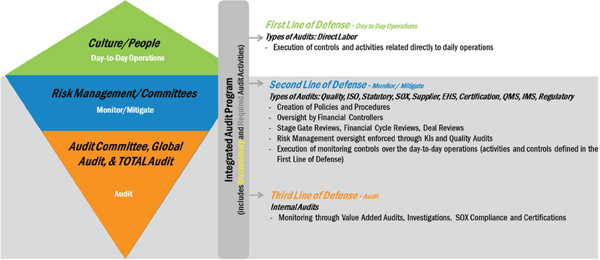
The next mission then was to dig deeper to understand the sources of these allegations against the company’s Chief Audit Executive function. After just a few conversations, it became abundantly clear that the sources of these audits were both internal and external to the company, and the vast majority were not from the Global Internal Audit function. After the reasons for the allegations were clarified, the company created the 3LoD model, as seen in Figure 13.2. This illustration was used to introduce the concept to the company’s CFO and CEO, prior to requesting cooperation from other company’s organizations to embark on the formal 3LoD program roll out.
A summary of the 3LoD elements is discussed as follows.
First Line of Defense includes the frontline activities that are conducted by the day-to-day operations, such as the direct labor (for example) in a manufacturing company. This level is really about the people and culture built into the primary functions of a company.
Second Line of Defense includes the group that monitors activities and mitigates risks related to real-time functions. Examples could include committees assigned to particular job functions resulting in the end product, or risk monitoring activities performed on periodic and ongoing intervals. Other forms of this line of defense are shown as follows:
Figure 13.1 The three lines of defense model
Figure 13.2 Three lines of defense applied to an actual company
• Creation of Policies and Procedures;
• Oversight by Financial Controllers;
• Stage Gate Reviews;
• Financial Cycle Reviews;
• Deal Reviews;
• Risk Management oversight enforced through Key Performance Indicators and quality defined in the First Line of Defense.
Third Line of Defense includes the highest level of monitoring and reporting of risks and performance. This level of coverage is best illustrated by the efforts of a company’s Internal Audit team, with oversight from the Audit Committee of the Board. Some views also include as a Line of Defense the external auditors of public companies. However, they along with external regulators may be better described as the fourth line of defense. But for the purposes of this book, we will only discuss those lines of defense that are “internal” to a company.
The next step is to refresh the problem statement to the broader executive team and present the purpose and benefits of the project. Some preparatory work must be done to assess the breadth of the audit activities for the recent 12-month period. As a primer, the following diagram (Figure 13.3) can be tailored to relate specifically to a company business model including the volume of hours by audit activity.
Prior to discussing the details of the company’s specific project, here is an overview of the 3LoD structure and the general description of the departments for this specific project.
The First Line of Defense
There were two areas within the first line of defense, which monitored the ongoing quality in real time and generally consisted of about 3,000 man-hours. The two groups were mostly production-line driven and shown as quality and direct labor. Neither of these groups performed an actual manufacturing process but were involved in testing to ensure there were no major deviations on the production line at key points of the process.
Figure 13.3 Details of the three lines of defense activities
The second line of defense consisted primarily of four focus areas. Supplier audits, which were performed by the Supply Chain Department, were around 6,000 man-hours per year. The ISO process compliance organization devoted about 1,400 hours of audit activity. The Environmental Health and Safety or EH&S devoted about 8,000 audit hours and as well, they also had some ISO process compliance a little over 200 hours. The Finance Department had its internal staff that devoted about 150 hours to conducting continuous improvement. And lastly, the second line of defense was about 11,500 hours for Sarbanes–Oxley (SOX) compliance.
The Third Line of Defense
This section included audits conducted by the company’s Internal Audit Department as well as a parent Company Internal Audit Department (in this example project, a company belongs to a group of companies with a parent company representative in a company’s Board of Director). The audits that were conducted during this period accumulated to about 6,000 hours.
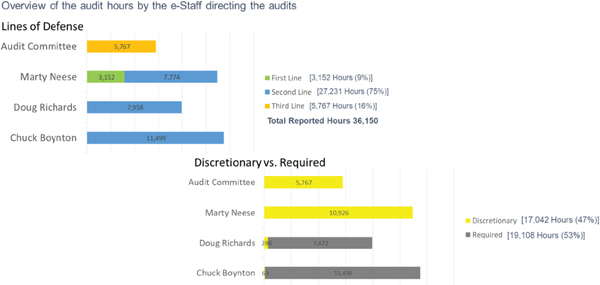
Overall, of the total 36,150 audit hours reported, the first line of defense included 3,000 plus hours; second line of defense contributed a little over 27,000 hours; and third line of defense around 6,000 hours. This gives a relative feel for the audit hours dedicated to these 3LoD and the respective hours in this particular company. This relative portion spread among the 3LoDs may or may not be representative to other companies and should not be used as a benchmark. Some functions, such as Operations, were included both first line and second line of defense audit hours but were reported separately for this purpose.
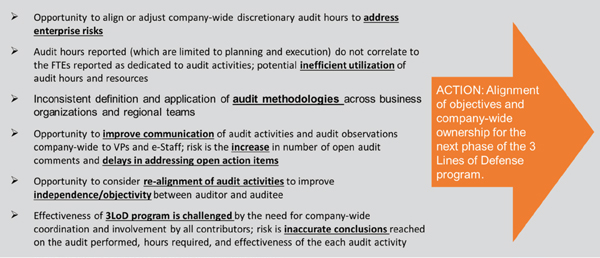
The key takeaways from the overall project are shown in Figure 13.4. This provides a glimpse of the end results and will help to understand the relations while reading the remaining sections of this chapter.
Figure 13.4 Lines of defense—key takeaways
The project began with the Overview and Objectives as shown in Figure 13.5.
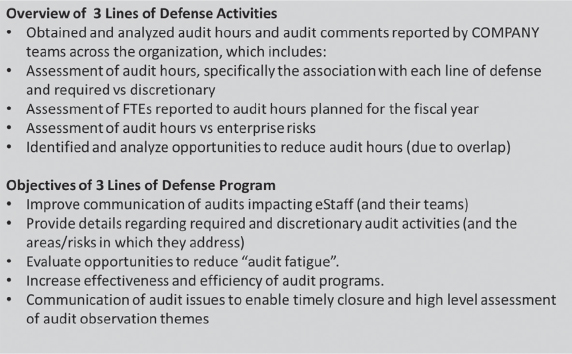
Figure 13.5 Overview and objectives of three lines of defense
Another element that was captured for these 3LoD audit hours were related to whether the audit hours were required (compliance oriented) or discretionary (based on internal performance need). Figure 13.6 shows the total hours by function and a breakdown of required versus discretionary.
Nearly all of the Operations Department hours and the third line of defense Internal Audit Department hours were viewed as discretionary. Although one could view the Internal Audit hours might be required (compliance oriented), the audit team viewed it as discretionary for this project because it was not fulfilling any particular legal regulatory compliance commitment.
Actual to FTE Count
The next step was to analyze the auditor efforts and efficiency for the year in each of these areas. The team had the audit hours reported (as you remember) of 36,150 (Figure 13.6). The next step was to compare that to the actual full-time equivalent (FTE) of employees who worked in those particular departments that were assigned to this audit activity (see Figure 13.7).
Figure 13.6 Audit hours
Figure 13.7 Audit-specific FTE reported
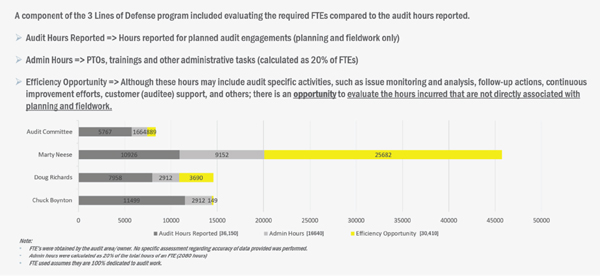
The reported actual audit hours worked being the planning and field work only, which came back to the 36,150 hours. The audit team made an assumption that each of these employees would also incur roughly 20 percent administrative time for training, holidays, vacation, and so on. Multiplying the full number of employees assigned to these audit functions (40 per above) by 2,080 hours per year equaled the total number of hours (83,200) that had to be accounted for, related to all the employees who were assigned in each of these audit areas.
As the team layered in the actual hours devoted specifically to the tasks, it generated a comparison of the total 83,200 devoted headcount hours to the 36,150 actual hours devoted specifically to auditing. See the following Figure 13.8.
The results indicated that there was a substantial amount of efficiency opportunity particularly in the Operations Department. Less than 50 percent of the Operations Department employee’s hours were fully dedicated to their direct audit function activities. Obviously, they were doing many other things, perhaps following up on audit comments, possibly helping to design processes for the mitigation of the issues and reporting. However, those activities were not captured and most likely would not consume nearly that much time.
One would typically expect an audit department to have a model distribution of at least 70 percent allocated to audit planning and field work hours. The other remaining elements would include the 20 percent administration and 10 percent miscellaneous activities. If that allocation is compared to the functions noted, then Operations has more than 50 percent of the employees doing miscellaneous activities. Human Resources (EH&S) was roughly 25 percent absorbed by these more miscellaneous activities.
Just to emphasize the assumptions used, the audit team interviewed department heads in all departments in all functions, and the full head count numbers that came from the organization charts and confirmed those to be fully dedicated employees to the audit activities. They used the actual hours and reported them for field work and planning of audits. Then the audit team just plugged in the 20 percent administration.
The bigger picture assessment of the 45,000 hours did not account for any efficiency opportunities in audit planning and field work, which can represent significant man-hours.
Figure 13.8 Auditor efficiency analysis
As mentioned earlier, the audit team already implemented the ERM program and had a Top 25 enterprisewide risks that the company would be remediating.
Those 45,000 hours noted earlier should ideally be allocated to larger risks of the company. Figure 13.9 shows the annual audit hours that were attached to auditing the Top 25 risks.
As you can see, only six of the Top 25 risks had any audit hours applied to them. Most of the audit hours applied really came from the Internal Audit Department on the Top 3. The audit team excluded the required audit activities primarily found in the EH&S and finance for SOX as they must be done anyway, regardless of whether they have a risk that falls in the Top 25 or not. Hence, this analysis was only composed of discretionary audit hours.
The only notable number of discretionary hours from the 3LoD audit activities related to risk number 16, the product design quality. So what happened to the other 19 risks, which received zero emphasis from the various audit subdepartments throughout the 3LoD within the company?
This indicated that there was a massive mismatch between available discretionary audit hours in the 3LoD against the largest risks of the organization.
With a total of 45,000 hours in the 3LoD, one would expect a higher number of those hours to be devoted particularly to the Top 10 risks, or preferable to the Top 5 risks. However, that was not the case in this particular company, which created a very inefficient use of precious audit resources to address the important risks of the company.
Methodologies
Another element of reviewing the audit activity for all 3LoD was to assess the methodologies and see if there were inconsistencies between the various audit functions or between team members who have the same function or by location. This would help to understand how structured the audit activities were.
Figure 13.9 Audit hours by ERM risk
The audit team noted that the most hours attributed to audit activities were Quality Management Systems (QMS) Function Quality Management Group, Operations Group, Quality Team and Procurement Supplier Audits. Figure 13.10 shows the results of the review, which are explained in more depth later.
The audit team looked at the planning fieldwork reporting and validation metrics and found that the programs were generally unstructured and inconsistent. There were some fragmented approaches by region. There was not an overview of the overall audit plan to determine if it was addressing the right areas of concern of management.
The methodologies of audit announcements, clearing recommendations or action plans, conducting the fieldwork, use of checklist versus a more in-depth process reviews, and reporting of issues was much different as well. Most reporting did not go outside of their internal department, and very few were escalated to the executive team of the organization.
None of the 3LoD functions, except Internal Audit, had a validation of their work by use of metrics.
It became obvious that there were a lot of methodology issues that would create more efficiency if they were similar in nature. There was not even a tracking of all audit comments by all of the groups.
The next step was to work with all these audit functions to come up with the number of audit comments that were open (not addressed by auditees) as well as those that were closed throughout the year. Each of the functions had their own methodology of rating audit comments as high, medium, or low as to importance in risk, with differing definitions of the ratings. There was not a consistent application of those ratings to ensure that auditees or business management were putting remediation time in the right place to correct the higher impact management action plans, which was another imbalance in the inefficiency of the organization team members.
The audit team pulled this information together (shown in Figure 13.11) of all the 3LoD audit activities or audit functions, which collectively had 1,508 audit comments for the year. Only 51 comments were ranked as a high-risk exposure to the organization, with 607 at a medium-risk rank, and 850 ranked as low risk.
Looking at the higher risk column of the 51 that were reported, 31 (or 61 percent) came from the Global Audit Department. Generally, the smallest department identified the largest number of risks. Within the medium category, the biggest contributor was the supplier audits and the quality audits performed by direct labor on the manufacture line, and the ISO process compliance. Most of the 850 low ratings came from supplier audits, ISO process, and the direct labor quality auditors. Only 99 came from the Global Audit Department.
Figure 13.10 Audit methodology assessment
Figure 13.11 Overview of the open and closed comments
Looking at the lines more closely, you can tell that the Global Audit Department had a stronger focus on higher risk areas. Thirty-one (or 30 percent) of the audit comments by Internal Audit Department were in a high-risk category, with a higher percentage in medium and a much lower percentage in low. This is more like the expected distribution if the organization was employing risk-based methodology through all lines of defense audit activities.
It was obvious that the ISO process compliance, supplier quality, and the direct labor quality were only finding issues that were of very low risk to the company by their definition. Keep in mind those that are the same three groups that represent over 50 percent of the discretionary audit hours. The obvious theme that was starting to generate.
Prior to obtaining all the open/close comments in the three risk categories, the audit team only had to make the methodology consistent on defining high-, medium-, and low risk to the company. They worked with each of these 3LoD audit functions and developed a common methodology to assign the risk of each of the comments that they currently had, open and closed. This made sure that the audit team looked at the comparison of all the closed and open comments with a consistent application of impact and likelihood.
The next step was touching a very sensitive area. The intention was to consider realigning the reporting of the second line of defense into the Global Audit Department. Based on peer group companies, the trend has been to integrate the second and third lines of defense, where possible, either as an execution agent or an oversight function. See the following Figure 13.12 showing the trend.
After assessing all of the information and data in all of the interviews, the audit team developed a next steps proposal to the Executive Team. In Figure 13.13 you see the overview of the proposal, which includes primarily the problem statement and the ultimate proposal of where the team needed to reach at some point in time.
Figure 13.12 Internal audit direction—company comparison
Figure 13.13 3LoD next steps
The problem statement confirmed where the concerns were at the very beginning. There were a lot of audit activities taking place globally in the cross-functional organizations. There was audit fatigue, a highly inefficient utilization of audit resources, and a lack of any kind of level of objectivity or independence—people were auditing their own function. A large preponderance of the man-hours of auditing were actually applied to low-risk audit topics of the company. The audit comments that were identified were reportedly tracked and remained open for a very long period of time. There continued to be confusion of which organization was conducting which audits.
In the next section, you’ll see the story pulled together as how the audit team brought this to the next level.
Some of the recommendations that are shown in the next few pages will require moving the second line of defense auditors into the third line of defense audit group and could raise some conversation about whether or not the line between second and third was being blurred specifically from an accountability standpoint and independence. Additionally, there were a lot of nonaudit-oriented people who were conducting second line of defense, which would stay intact. Only those who were conducting actual physical audits with recommendations in assessing risk would be folded under the larger umbrella of Global Internal Audit, the third line of defense. It is very important to clarify that to make sure everyone understands that, the audit team considered the value of independence and objectivity in this process, which would ultimately give much better efficiency and end results.
As you see in Figure 13.14—Lines of Defense Strategy—Opportunities, the audit team had to identify and express the opportunities it saw to the Executive Team, CEO and his staff, as to why this made sense to consider. Normally, management teams are very protective of their own employees and the teams they have built within their group to improve their own quality in a more siloed effect. It was a difficult conversation to have with all the executives to convince them of the value-add brought to the organization.
The audit team focused on four different elements that would improve the overall program:
Figure 13.14 Lines of defense strategy—opportunities
1. Objectivity and Independence: By consolidating the second line of defense auditors into one group, the auditors would no longer be auditing the processes owned by their boss or own team members. That would create a stronger effectiveness and reporting of issues and bring more transparency of the concerns that were mentioned.
2. Efficiency: As time progressed, there would be the ability to shift resources from the subcross-functional groups to other teams to address higher level risks. Prior to that, of course, there would be a fair amount of training that would take place including both business and auditing training. From an efficiency perspective, this would create far more transparency over the utilization of the audit hours, particularly the discretionary hours, which is the group of hours that is not well defined and also the largest percentage of the full-time employees doing these audits. It would give the audit team the ability to better align all the discretionary audit hours to the ERM Top 25 risks, which are the risks that really need the attention. Also, there would be the opportunity to gain synergies related to the cost of maintaining these departments. There currently were several management-level positions that would ultimately be able to be eliminated along with travel costs. Also duplicate costs currently required to maintain each group would be eliminated. And lastly under efficiency, it would just simply eliminate the administrative burden of coordinating 20+ contributors to the current 3LoD program.
3. Methodology: All of these various audit groups would need to be fully aligned on how they conduct audits, how they assess risks, how they determine exceptions, and the value of those exceptions before recommendations are made in each of the various categories of risk exposure. It would improve the ability to incorporate the new ISO 9001 standard, which requires that the ISO work be risk-based, which is a change in that methodology.
4. Reporting: Management action plans with audit comments would be much easier to resolve and follow-up activities easier to monitor. Reporting would also improve the planning process. There would be an update of quarterly plans sent out to all appropriate personnel to be able to minimize audit fatigue. And the audit team could schedule all audits centrally for all 3LoD in the organization.
Also under Reporting, the team would remove the confusion from everyone as to the source of individual audits being conducted. There would be one person to contact who manages the entire audit plan.
And lastly, under Reporting, all the tracking and reporting activities would be placed under a common system to gain efficiency and accuracy.
Those were the four major elements of support to accept and implement this program.
The next Figure 13.15 shows a timeline of what it would take to pull this program together under one reporting structure. It certainly would not happen immediately and would most likely take two to three quarters to be fully implemented. Most of the benefits would be incurred after at least three quarters and maybe even four quarters. It is a very involved process, and a lot of planning would need to take place before starting the implementation.
Of course, it is always good when you are selling a project or a program to have a quick win to show as an example. Therefore, the audit team overlapped the internal audit work, particularly in the SOX program, and the budget hours for the Quality Management Team related to the budget hours for SOX in the Finance Team (see Figure 13.16).
As the team looked at the overlap over a three-year period, it was clear in just this one isolated comparison that there could be close to 1,200 man-hours reduction identified over three years. That would eliminate 64 QMS audits that would be consolidated into other audits, 42 of their audits could be coordinated with Internal Audit Department, thereby reducing stakeholders’ interaction. And there were 39 audits that QMS was doing that really supported the Sarbanes–Oxley or the SOX function. Those could be completely eliminated since there is a robust SOX program in place. This excludes the time devoted to the audits by the auditees and management, which would drive the savings much higher. By just comparing that one isolated area, it was clear that a lot of audits could be eliminated or consolidated, and many hours reduced between these two audit groups.
After presenting the objectives and the opportunities and the timeline and the quick win, the audit team proposed three different options for the Executive Team to consider.
Figure 13.15 Next year objectives
Figure 13.16 QMS audit reduction evaluation
The first option which was Internal Audit’s preferred option (ReOrg) is shown in Figure 13.17.
This preferred option would be to conduct a reorganization. Even that could be defined with two possible options: one would be to simply create a second line of defense audit group organization, and the second would be to have the second line of defense audit groups report into the existing third line of defense Global Internal Audit function. This option gave the management an alternate direction if they did not want to go with the Global Internal Audit as the owner, but at least consolidate all second line of defense activities into one group.
This level of reorganization would gain nearly all the benefits discussed from establishing independence between the audit groups and the business functions; the ability to deploy staff cross-functionally; providing a stronger coordination of a companywide audit schedule for improved alignment; a more simplified process for communication and reporting; and lastly, allow audits to focus on companywide ERM risks.
There were not many negatives associated with this recommendation other than perhaps some challenges of separating or carving out these employees from the business. There could potentially be some misalignment of strategies and risks if they did not report to the Global Internal Audit Department. But all in all, either of the options including reorganization would be an improvement.
The second proposal (No Change) (digital copy—in green) in Figure 13.18 was to basically keep the organization as it is with no change.
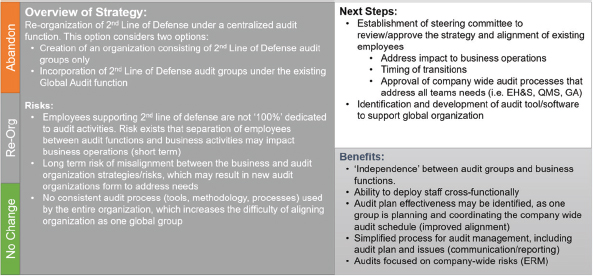
Figure 13.17 Three lines of defense—beyond
Figure 13.18 Three lines of defense—beyond
To implement a common program throughout all of the individual second lines of defense groups mean there would be a common language and more consistent communications. It might help to an extent the audit fatigue if there were overlapping consideration of audits, and certainly could increase the effectiveness and efficiency of the programs in general. This recommendation or proposal was presented as a compromise. There would still be a continued lack of long-term strategy or vision for the 3LoD program. It would continue to have duplication of cross-functional hours and administrative efforts, and the output and reconciliation of management audit comments would tend to lag. While there would be benefits to this option, it certainly would not maximize the process.
The third option (Abandon) (orange where available) shown in Figure 13.19, which was the least desirable, was to simply abandon the notion of the 3LoD related to the auditors conducting the work within their organization.
There were some benefits at least bringing forward awareness if there could be some consistency of audit scheduling put in place, reduce audit fatigue, and maybe continuity in reporting issues through remediation. But the overall planning of audits to help address the primary company risks from the ERM program would be minimal. This option was by far the least beneficial of all the three proposals, but nonetheless an option. This option was the least intrusive to organizations and an option, should management not have an appetite to bring forward such a sweeping change to the program.
What happened? As we all know, timing is everything. There was no immediate decision by executives as to which direction a company would go. There were some underlying changes coming up within the organization and business models that would impact any kind of structural change that would be taken over the next six months.
However, the audit team immediately implemented several of the recommendations to remove audit fatigue and do some centralization of reporting of the audit plan accumulating at each quarter and avoiding overlaps and duplication. They also incorporated a semiconsistent methodology of high-, medium-, low-risk ratings and facilitated the reporting to executives of this open management action plans to help get the remediation closed timelier.
Figure 13.19 Three lines of defense—beyond
As time moved forward, there were some major changes of the company and some changes to the second line of defense reporting structure. It was a very positive project. Management chose to follow in the “compromise proposal” option due to the other surrounding circumstances. But nonetheless, this was a great exercise and each of the organizations specifically addressed inefficiencies. Particularly, the Operations Department addressed the 25,000 discretionary efficiency-oriented type audit hours that could not be pegged to any real risk and gained some internal cost efficiencies within their organization as well.
It did create a lot of positive changes, but it did not get to the full desired level of benefit expected when all audit activities would be highly centralized under the third line of defense or at least centralized under a second line of defense department head.
This project inspired other teams thought out the organization to reconsider their approach to addressing company risks. One executive leader asked the audit team to conduct a management assessment of the standalone department that conducted and managed the Process Improvement Program, which was viewed as a second line of defense function in addressing risks. When issues surfaced in the day-to-day operations in any organization or function, the related group owning the issue engaged the Process Improvement Program group to facilitate this exercise in a very structured manner. The Process Improvement Program utilized the Eight Disciplines approach that was very similar to those more well-known process improvement programs, such as the Kaizen, Six Sigma, or Total Quality Management (TQM).
The Eight Discipline methodology referred to as 8D is a methodology used to assist and identify corrective actions for issues that surface. See Figure 13.20.
The picture of the 8D program shows the beauty in that it never changes regardless of the process being assessed. This program is very similar to other similar process improvement programs. Key elements are discussed as follows:
• The first discipline is to create a cross-functional team that fits right into the ability to make sure problems are corrected where most issues tend to fail—specifically, interdepartmental changes versus intradepartmental activities.
Figure 13.20 Disciplines (8D) process
• The second discipline is to describe the problem statement, which can be a challenge as participants prefer to jump immediately to the corrective action steps.
• The third discipline is to contain the current situation.
• The fourth discipline is to identify and verify the root causes, which is where you ask the “why” question five times.
• The fifth discipline is to identify and verify corrective action.
• The sixth discipline is to implement permanent corrective action.
• The seventh discipline is to prevent recurrence and add globalization.
• The eighth is to congratulate the team and close with the customer.
Some specific examples of issues where this technique is applied frequently relate to product and material or equipment, business process breakdowns, field failures, reliability problems, customer-escalated complaints, safety events, financial reporting accuracy, and environmental and nonconformity problems. These action items are pulled together to address very specific and considerably important issues. It was always the CEO’s first go-to direction if an issue surfaced, “Conduct an 8D.”
This 8D group was embedded in the quality control function in the Operations Group and was devoted specifically to these projects. To assess the effectiveness of the 8D program, it was tracked for a couple of quarters and then brought the activities into the 3LoD project modifications explained earlier, because it is somewhat consistent with tracking management action plans.
Figure 13.21 shows the takeaways after the initial review of the process around the 8D program. These are action items that were created together to address very specific and significant issues.
The audit team found that not all organizations in the company consistently logged their 8D projects in the primary repository. This created difficulties in tracking the status and the completion of the companywide 8Ds. There were logical reasons for some projects not to be logged in to the central system, such as those that related to legal items where there is attorney–client privilege, key finance strategy items including tax forecasting, and certain IT projects. However, there was also clearly a lack of user awareness of the requirement to log all identified 8Ds into the common system.
Figure 13.21 8D takeaways
The policy related to 8D was primarily geared for operations in the beginning phases of the program, but as it was expanded to other organizations, it was never updated to include corporate or other owners. It did prescribe a timeline for completing downstream issues in 90 days and upstream issues in 30 days, which continued to stay in place for all projects.
The system did not escalate delays at the various stages of the 8D, nor was any executive management reporting done more frequently than once a year and only with limited detail. There were some periodic meetings of downstream quality committees, but very limited, and there were opportunities to possibly bring this into a second line of defense from a process improvement element.
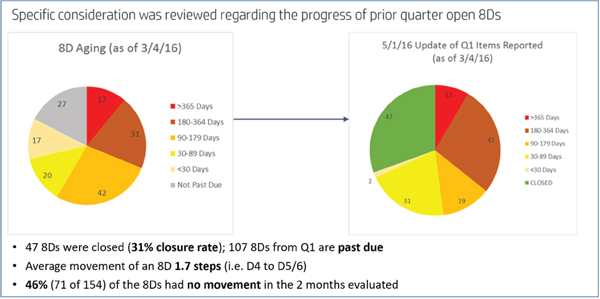
The audit team worked behind the scenes with the Quality Department on pulling together a more structured approach of consolidating all the 8D projects and reporting of such on a periodic regular cadence. As they modified this reporting and implemented some of the process changes, the team looked at the status of the 8Ds that were currently open in the repository. Eighty-six percent of the 8Ds were past due overall, and 51 percent of the 8Ds were greater than 90 days past due. This indicated that a substantial amount of work took place but got stalled in the process (see Figure 13.22).
Figure 13.22 shows a couple of pie charts. The pie chart on the left-hand side is the static image of the projects at the beginning of the review. The pie chart on the right-hand side shows the status of the same projects two months after the results were highlighted to executive management for the first time. In the beginning there were 82 percent of the projects delayed. A total of 80 were over 90 days past due, with 17 over one year past due. A lot of these projects were substantially overdue while only 27 were on schedule. After monitoring and implementing the new procedures, and reporting to executives, the change in just two months was very positive. While still high, 69 percent was still overdue, while the number of open tracks fell from 127 to 107. While this was a positive sign, it would take a few months to get all the projects caught up.
Figure 13.23 shows the status of the eight steps in the program for the open projects discussed earlier.
Figure 13.22 8D aging overview
Figure 13.23 8D aging—additional analysis
Once the cleanup is done and the new procedures are consistently followed, this becomes a very useful part of the second line of defense in managing the risks. The point to this section is that it should be an area that is built into the second line of defense in the quality function. It does relate to identified global cross-functional issues, many of which will relate to higher risk elements within an organization.
However, it is so often that without proper supervision and moderation that these programs will fail to produce 100 percent because people stopped a bit early before completion. They accomplished a couple of quick wins, then just move forward. They never knew whether same improvement was experienced once applied globally.
It is all about asking many why questions, testing solutions, making sure it is robust, incorporating new ideas and learnings from the process, and finally, making sure it is implemented globally.
