Chapter 22
Exercising Patience: The Key to Any Investment Success
IN THIS CHAPTER
![]() Understanding the charts
Understanding the charts
![]() Peeking into the world of day trading
Peeking into the world of day trading
![]() Examining “investment pornography”
Examining “investment pornography”
![]() Treating time as your friend, not your enemy
Treating time as your friend, not your enemy
![]() The tortoise and the hare
The tortoise and the hare
Now, dear reader, I get to the part of this book you’ve been waiting for: how to get rich quick using ETFs! The trick is understanding charting patterns.
Let me explain what I mean.
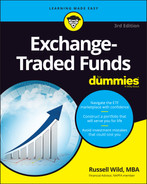
The chart in Figure 22-1 captures a hypothetical daily pricing pattern for a hypothetical ETF that I will give the hypothetical ticker symbol UGH. What you see at point A is a major reversal pattern known to technical analysts as the “Head-and-Shoulders.” Notice that as the price dips below the “Neckline” and then rises with simultaneous “Increased Volume” that the “Reversal” of the “Trend” begins to manifest. Buy! Buy!! Within a short time, however, as you can clearly see at point B, a “Minor Top” forms, indicating an “Upward Trend” reinforced by the classic “Inverted Triangle.” Sell! Sell!! Two minutes later, at point C, where volume increases yet again and the price again rises a point, you see a “Breakaway Gap.” Buy! Buy! Buy!

FIGURE 22-1: The daily pricing pattern for UGH.
In the next chart (see Figure 22-2), I examine the daily pricing patterns of a hypothetical ETF that I will hypothetically call DUM. You can make millions overnight if you truly understand this charting pattern!
FIGURE 22-2: The daily pricing pattern for DUM.
Unless you are totally humor challenged, by now you see that I’m not being entirely serious. Many, if not most, day traders (who just love ETFs, especially the really kooky ones) believe in something called technical analysis: the use of charts and graphs to predict movements in securities. Much of the language I used to explain Figure 22-1, as well as the basic idea behind the charts, comes from a bestselling book on technical analysis.
 I once had the honor of interviewing one of the biggest names in technical analysis. This guy writes books, gives seminars, and tells everyone that he makes oodles and oodles of money by following charting patterns and buying and selling securities accordingly. At the time I interviewed him, I had been a journalist for 20 years, writing for many of the top U.S. magazines, covering many topics. If you develop one thing being a journalist for two decades, it is a very well-honed BS radar. I can tell you after spending an hour on the phone with this “expert” that he is perhaps making oodles and oodles of money with his books and seminars, but he is not making oodles and oodles of money with his charts.
And neither will you.
 The key to success in investing isn’t to do a lot of trading based on secret formulas that are every bit as fruitless as alchemy. The key is to keep your investment costs low (ETFs will do that for you), diversify your portfolio (ETFs can do that, too), lose as little as possible to taxes (ETFs can help there, too), and exercise patience (that part’s up to you).
In this chapter, I present the evidence to back up my contention that buying and holding, more or less, with regular rebalancing, is the thing to do. Yes, that’s true even in today’s uber-turbulent markets. You will see that the true champions of the investing world are those with the most patience. Here’s a great quote that you may want to post next to your computer to look at the next time you contemplate swapping one ETF for another. It’s from someone I admire — someone who, I’ve heard, knows a little bit about investing.
The stock market is a device for transferring money from the impatient to the patient.
—WARREN BUFFETT
In this chapter, you also discover the difference between hypothetical investing (the kind of investing where you allegedly get rich overnight) and investing in the real world in which Warren Buffett invests. The difference is huge.
The Tale of the Average Investor (A Tragicomedy in One Act)
I talk a bit in this book about correlation, the tendency for two things (such as two ETFs or other investments) to move in the same direction. A correlation of 1.0 indicates a perfect correlation: think of a kitten swiping at itself in the mirror. Another perfect correlation is the correlation between stock prices and the public’s willingness to purchase those stocks.
For some strange reason, the market for stocks (and stock funds, such as ETFs) does not work the same way as, say, the market for cars, shoes, or pineapples. With most products, if the seller drops the price, the public is likely to increase consumption. With stocks and stock funds, when the price rises, the public increases consumption.
For example, after tech stocks had their fabulous run in the 1990s, only then — in the latter part of the decade — did money start pouring into tech stocks. After the bubble had burst and tech stocks were selling cheaper than tarnished dirt, people were selling right and left, and no one was buying. As I write these words, I’m seeing the price and valuations of a handful of companies —– Microsoft, Alphabet (Google), Facebook, Amazon, and Tesla — reach levels not seen since 1999. (Valuations refer to stock prices as they compare to companies’ earnings.) As soon as the bubble bursts on these, well, it’ll be red-tag-sale day once again.
Returns that fall way short of the indexes
Every year, the investment research group Dalbar compares the returns of indexes to the returns that mutual fund investors see in the real world. In their 2020 study, the Dalbar research crew found that the average stock mutual fund investor for the 30 years prior to December 31, 2019 earned 5.04 percent a year. This compares to the more than 9.96 percent that someone would have earned just plunking their money in an S&P 500 index fund for those two decades and leaving it put. Bond fund investors did worse in relation to the bond indexes: 0.38 percent versus 5.91 percent.
There’s recently been some controversy from Morningstar and some other research groups over Dalbar’s methodology, but those researchers still come to the conclusion that the average fund investor falls far behind the indexes.
How to explain such lackluster investor returns? In part, the culprit is the average investor’s inclination to invest in pricey and poor-performing mutual funds. An even larger problem is that the average investor jumps ship too often, constantly buying when the market is hot, selling when it chills, and hopping back on board when the market heats up again. They are forever buying high and selling low — not a winning strategy, by any means.
ETFs can solve the first part of the problem. They are, as long as you pick the right ones, not pricey. In fact, they cost very little. Most ETFs are also guaranteed not to underperform the major indexes because they mirror those indexes. As for the jumping-ship problem, however, I fear that ETFs can actually exacerbate the problem.
ETFs can make failure even easier!
ETFs were brought into being by marketing people from the Toronto Stock Exchange who saw a way to beef up trading volume. Unlike mutual funds, which can be bought and sold only at day’s end, ETFs trade throughout the day. In a flash, you can plunk a million in the stock market. A few seconds later, you can sell it all.
Yippee!
In other words, Dalbar’s future studies looking at 30-year returns — now that ETFs have really caught on with the average investor — may be even more dismal. Keep in mind that just because ETFs can be traded throughout the day doesn’t mean you have to or that you should trade them!
The vast majority of ETF trades are made by institutional investors: managers of mutual funds or hedge funds, multibillion-dollar endowments, pension funds, and investment banks. These are highly trained, incredibly well-paid professionals who do nothing all day but study the markets.
When you go to buy, say, the Financial Select Sector SPDR ETF (XLF), which represents stocks in the financial sector, you are betting that the price is going to go up. If you are day trading, you are betting that the price will go up that very same day. If you are selling, you are betting that the price will fall that day. Someone, most likely a highly educated financial professional with an army of researchers and computers more powerful than the FBI’s — someone who does nothing but study financial stocks 80 hours a week (for which reason their spouse is about to walk out the door) — is on the other end of your transaction. As you sell, he — I’ll call him Chad — is buying. Or, as you buy, he is selling. Obviously, Chad’s vision of the next few hours and days is different from yours. Chad may not know that his spouse is about to leave him for a professional hockey player, but if either of you has any idea which way financial stocks are headed, well…do you really think that you know something Chad doesn’t? Do you really think that you’re going to get the better end of this deal?
Obviously, lots of ETF traders think they are pretty smart because ETFs are among the most frequently traded of all securities — see the sidebar, “The 10 ETFs that day traders love the most.” Also see the sidebar, “The author’s confession (and a few rules if you are going to day trade),” later in the chapter for an inside view of a repentant day trader’s mind.
The lure of quick riches
If you jump onto the Internet, as I just did, and type in the words “day trading secrets,” you will see all kinds of websites and newsletters offering you all kinds of advice (much of it having to do with reading charts) that’s sure to make you rich. Add the initials “ETF” to your search, and you’ll quickly see that an entire cottage industry has formed to sell advice to wannabe ETF day traders.
According to these websites and newsletters, following their advice has yielded phenomenal returns in the past (and they’ll give you specific big numbers proving it). And following their advice in the future (after you’ve paid your hefty subscription fee) will likewise yield phenomenal returns.
Here is just one of many examples:
- StockMarketTiming.com, LLC (
www.stockmarkettiming.com) - Cost: $295/year for the Gold Plan or $995 for the lifetime Diamond Plan
- Direct from the website: StockMarketTiming.com, LLC is a financial service for investors and traders who want to increase their portfolios in the most non-stressful and effective way possible in both bullish and bearish markets! We have developed a market timing system that uses technical analysis for trading the popular Exchange Traded Funds (ETFs) — DIA, SPY, and QQQ, which has produced outstanding gains!
- Russell says: Outstanding gains for whom?
- We are the home of the most honest, concise, credible (unbiased and zero-hype), low-risk, and one of the most effective financial websites on the Internet today!
- Russell says: I’m glad that the hype is unbiased. I hate biased hype.
If you’re wondering, by the way, who regulates investment websites and newsletters and the performance figures they publish, wonder no more. No one does. The U.S. Supreme Court decided in 1985 that, just as long as a newsletter is providing general and not personal advice, the publisher is protected by the free-speech provisions of the First Amendment.
John Rekenthaler, a VP at Morningstar, once told me (and I love how he put it): “Investment newsletter publishers have the same rights as tabloid publishers. There’s nothing illegal about a headline that reads ‘Martian Baby Born with Three Heads!’ and there’s nothing illegal about a headline that reads ‘We Beat the Market Year In and Year Out!’” Both should be read with equal skepticism.
The Value Line Paradox
Throughout the years, one of the most popular purveyors of market-timing and stock-picking advice — though not the worst offender, by far — has been Value Line. It’s not as popular as it was years ago, but it is still a household name. Not only are the Value Line people now offering advice on picking ETFs as well as stocks, but they also launched their own ETF in 2005 — the Value Line Timeliness Selection ETF — that actually mirrored the advice given by the famed Value Line newsletter. The fund was administered by PowerShares, which pulled the plug on it after four years of lackluster returns.
Paper versus practice
Although the Value Line website isn’t nearly as loud and obnoxious as it once was (I think the company was humbled by its fund’s demise), it’s still promising you that it can beat the indexes.
And yet…and yet, it pretty much fails to do so.
Although its initial ETF folded, Value Line still operates a number of mutual funds, and by and large, they struggle to keep up with the indexes — just as nearly all actively managed funds do. The Value Line Mid Cap Focused Fund (VLIFX), for example, has a 10-year return of 14.83 percent compared to the S&P 500’s 15.35 percent. Yet VLIFX has a lot more volatility.
 Robert E. Lee’s march into Pennsylvania and the Titanic’s maiden voyage looked fabulous on paper, but, when translated into reality, they revealed some rather tremendous flaws.
The lesson to be learned
Who can say for sure why Value Line’s ETF failed and why its mutual funds just get by? When the ETF underperformed the markets, and way, way underperformed Value Line’s advertising claims about its ability to beat markets, those advertising claims came under attack. Some independent research came up with far, far lower return figures than were advertised. Or perhaps the managers of the fund were unable to follow the advice given in their own newsletter. Perhaps trading costs ate up all profits — and then some. Whatever the explanation, investors in the ETF lost money. Investors in the mutual funds are a long way from buying yachts.
But my point in sharing the Value Line paradox isn’t so much to steer you away from any single mutual fund or ETF. My point is to steer you away from thinking that you — or anyone else — can trade in and out of ETFs, stocks, bonds, or anything else successfully. It’s not nearly as easy as many people (such as the Value Line editors) make it seem.
“Investment Pornography” Everywhere
Investment websites and newsletters are part of a phenomenon that financial journalist Jane Bryant Quinn once called “investment pornography.” Many newsletters, magazines, newspaper columns, books, and television shows exist to titillate and tease you with the promise of riches. Achieving those riches with ETFs is only the latest gimmick.
One glossy consumer finance magazine that arrived in my mailbox caught my attention. A very attractive woman is walking along the beach. She holds a purse in her hand. (Why is she carrying a purse on the beach?) I am told by the caption under her left foot that the attractive woman earned a 40 percent return in one year.
I turn to page 65 of the magazine, and there she is: She earned her 40 percent by investing (“on the advice of a friend”) in the Hodges mid-cap mutual fund. Mid caps happened to have kicked serious butt in the 12 months prior to this issue’s release. What the article doesn’t tell you is that the Hodges fund had a fairly hefty expense ratio and — no big surprise here — a 15-year return that trailed the S&P MidCap 400 index by 3.54 percent annually. That’s part of the reason why the fund folded.
No wonder that poor woman carries her purse on the beach. She has determined that someone is out to steal her money.
Welcome to the wild, wacky world of investment advice
In 1999, a very popular book entitled Dow 36,000: The New Strategy for Profiting from the Coming Rise in the Stock Market gave readers 300 pages of in-depth explanation for why the Dow Jones Industrial Average, at that time riding around 10,000, was destined to more than triple in value. “The case is compelling that 36,000 is a fair value for the Dow today. And stocks should rise to such heights very quickly,” wrote James K. Glassman and co-author Kevin A. Hassett. Of course, as soon as the book came out, advising people to pour money into stocks, the Dow proceeded to tumble to less than 8,000 in a three-year bear market. Here it is, 2021, and the Dow Jones has still not reached 36,000.
Where do you suppose James K. Glassman is today? Why, he’s writing an investment advice column, of course. And he’s making more predictions. And when the Dow finally hits 36,000, Glassman will say, “See? I told you so!”
Before Glassman, there were the Beardstown Ladies. In 1983, 16 women in Beardstown, Illinois, started an investment club. In 1994, claiming a 23.4 percent annualized ten-year return, they wrote a book called The Beardstown Ladies’ Common-Sense Investment Guide. It became a huge bestseller. Oops. It turns out, upon further inspection, that the Beardstown Ladies overstated their returns. Their actual returns were 9.1 percent a year, considerably less than the stock market.
What happened to the good Ladies of Beardstown? Why, they went on to write five more investment books, of course.
Don’t even get me started on Jim “Mad Money” Cramer. If you haven’t taken his screaming advice and lost money on your own, simply search his name on the Internet, along with the words “actual performance” or “flip of the coin,” and you will be very disinclined ever to buy based on one of Mr. Mad Money’s tips. My fellow For Dummies author Eric Tyson (see http://EricTyson.com) has made something of a sport of tracking Cramer’s actual performance, and it isn’t pretty.
With the advent of the Internet and YouTube, Cramers and Glassmans have become a dime a dozen. Yesterday’s stock pickers have become today’s ETF pickers, and they are in your face 24/7.
I share these investment horror stories so that you won’t wind up as a victim in any future ones. One way to make sure you don’t is to be on the lookout for ridiculous claims. Market-timing services are all over the Internet. And why not? ETFs are hot. They are in the news. They sound so impressive. And there is a sucker born every minute.
Please, please, don’t fork over your money assuming that you’re going to get the secrets to instant wealth by trading ETFs. It won’t happen.
YouTube: Where teenagers in baseball caps explain the “secrets” of ETF trading
Just go to YouTube and type in the search terms, “ETFs trading tricks,” and behold…baseball caps! There are young men, ETF day traders, sitting in front of four or five monitors, wearing baseball caps, all over YouTube!
They have rags-to-riches stories to tell, secrets to share, and little whimsical asides about driving in their BMWs. If they’re making $1,500 per day trading online, why are they spending countless hours making online videos?
Why, indeed.
Some are trying to get you to subscribe to their ETF-picking services. Others are building followings to sell subscriptions and services down the road. Most, I believe, are just showing off their alleged prowess at picking ETFs, and I believe many of them are doing it in earnest.
Here’s the thing: Stocks have had an amazingly good run lately. In the past five years, the U.S. stock market has returned an average of almost 15 percent a year. Under such conditions, it has been hard not to make money in stocks — even for day traders. So many of them, I’m sure, have made money. But they’ve been spending hours and hours at their computers and taking enormous risks. And when the market goes south in a serious way, they’ll be cleaned out.
It happens every bear market. Just about every stock picker in the nation saw their clock cleaned in 2000, and again in 2008. I’m sure that many went down in the brief COVID-19 collapse of March 2020. Like software programs that clean up the cache on your computer, bear markets clean out most day traders.
But then they return. In baseball caps.
Patience Pays, Literally
The flip side of flipping ETFs is buying and holding them, which is almost certain, in the long run, to bring results far superior to market timing. It’s the corollary to choosing ETFs over stocks. Study after study shows that the markets are, by and large, efficient. What does that mean? So many smart players are constantly buying and selling securities, always on the lookout for any good deals, that your chances of beating the indexes, whether by market timing or stock picking, are very slim.
One of many studies on the subject, “The Difficulty of Selecting Superior Mutual Fund Performance,” by Thomas P. McGuigan, appeared in the Journal of Financial Planning. McGuigan found that only 10 to 11 percent of actively managed mutual funds outperform index funds over a 20-year period. (Active managers are professionals who try to pick stocks and time the market.)
You can probably safely assume that the professionals do better than the amateurs, and even the professionals fail to beat the market 90 percent of the time.
Talk about unpredictability
Timing doesn’t work because markets are largely random. The unpredictability of the stock market (and the bond market, for that matter) never ceases to amaze me. Just when things seem certain to take off, they sink. Just when they seem certain to sink, they fly.
I had one client, a 52-year-old allergist in Allentown, Pennsylvania, who several years ago read up on avian flu and became so concerned about what a pandemic might do to the stock market that he urged me to take his $500,000 portfolio and put everything in cash. We set up a meeting in his office, and I was able to temper his desire to cash out. (However, we did move his portfolio to a somewhat more conservative position.)
Prior to our meeting, I sent the client the following email, which I would like to share with you:
- Dear Tom,
- Since your initial e-mail on this topic, I’ve done a fair amount of reading, and you have reason to be concerned, for sure. I am, too. [Author’s note: I was being truthful here, although my concern was more a health concern than a financial one.]
- Holding some cash and gold wouldn’t be a bad idea. (If we had a real economic crisis, you would want small gold coins…1/10 ounce.)
- But don’t assume that pandemics, or any other crisis, necessarily result in stock market crashes.
- Keep in mind that 1918, the year of the worst pandemic in world history, was a good year for stocks:
http://www.econ.yale.edu/~shiller/data/chapt26.html. - 1942 (Japan attacked Pearl Harbor; Hitler marched across Europe) wasn’t too bad, either. 1962 (Cuban Missile Crisis) was a very good year.
- In contrast, let’s look at the worst years for the stock market. In 1929, nothing catastrophic was going on. Ditto for 1987. Ditto for 2000.
- I can’t explain the incredible unpredictability of the markets. I can only share these historical truths.
- Yours,
- Russell
Since I wrote that note, we’ve been through yet another of history’s worst years for the stock market. That was 2008. While there was something of a banking crisis going on, I’m not sure that the demise of Lehman Brothers compares to Hitler’s blitzkrieg of Europe. But more on 2008 in just a moment. More on 2020 and the COVID-19 pandemic as well. I’m happy to say that the COVID-19 pandemic, scary as it is, brought not a peep from Tom!
A short history of the market’s resiliency
As I write this chapter, in August 2021, the world has been locked in a struggle against COVID-19 that first hit the U.S. in February 2020. The first month or two were brutal to the stock market. Portfolios fell dramatically as sector by sector succumbed, first to panic and then to a sharp reduction in consumption and production. Airlines, hotels, retail, and financials were hit the hardest, but every industry suffered. From mid-February to mid-March 2020, over the course of a mere 33 days, the broad U.S. stock market fell 34 percent. And then…the market came raging back.
The market reached break-even just a few months later, in mid-August, and then continued to rise. By the end of December 2020, the S&P 500 had risen more than 18 percent from the start of the year. And then it continued to rise more. From January 2021 to the end of July 2021, the market rose yet another 18 percent. As I’m writing this paragraph, the market is very close to its all-time high. And did I mention that the world is still locked in a struggle against COVID-19?
This is not atypical. Stocks react, and often overreact to bad news. And then, after a time, stocks come back.
Remember September 11, 2001? Following the destruction of the World Trade Center towers, the Dow immediately dropped more than 7 percent. Six months later, the Dow was up by 10.5 percent. On September 24, 1955, President Eisenhower’s heart attack led to a one-day drop of 6.5 percent. Six months later, the Dow was up 12.5 percent. I could give example after example.
In 2008, the market had its worst dip since the Great Depression; the S&P 500 tumbled nearly 37 percent for the year. But it came back, gaining 26 percent in 2009 and about 15 percent in 2010. Had you rebalanced in 2008, shaving off bonds and buying up stocks at rock-bottom prices, your portfolio (provided it was well diversified) would likely have fully recovered within two years.
That’s not to say that the market will always come back. One of these days…well, even Rome eventually fell. But history shows that the stock market is a mighty resilient beast. I suggest that you build a portfolio of ETFs — including stock and bond ETFs — and hang tight. Sooner or later (barring some truly major economic upheaval), you will very likely be rewarded.