Appendix Quick References
Facts do not cease to exist because they are ignored.
– Anonymous
In This Appendix
The Framework for Information Quality
The POSMAD Interaction Matrix in Detail
Overview of The Ten Steps Process
Definitions of Data Categories
This appendix presents some of the key ideas from the methodology in an at-a-glance format. They are perfect for hanging on your cube or office wall or putting in a notebook when you need a fast reminder of ideas presented in more detail elsewhere in this book. See website at www.books.elsevier.com/companions/9780123743695 for downloads of printable versions of these items.
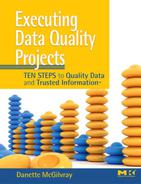
The Framework for Information Quality
- Business Goals/Strategy/Issues/Opportunities. The “Why.” Anything done with information should help the business meet its goals.
- Information Life Cycle. Use POSMAD to help remember the information life cycle:
- Plan—Identify objectives, plan information architecture, and develop standards and definitions; many activities associated with modeling, designing, and developing applications, databases, processes, organizations, and the like.
- Obtain—Data or information is acquired in some way; for example, by creating records, purchasing data, or loading external files.
- Store and Share—Data are stored and made available for use.
- Maintain—Update, change, manipulate data; cleanse and transform data, match and merge records; and so forth.
- Apply—Retrieve data; use information. Includes all information usage such as completing a transaction, writing a report, making a management decision, and completing automated processes.
- Dispose—Archive information or delete data or records.
- Key Components. Four key components affect information quality.
- Data (What)—Known facts or other items of interest to the business.
- Processes (How)—Functions, activities, actions, tasks, or procedures that touch the data or information (business processes, data management processes, processes external to the company, etc.).
- People and Organizations (Who)—Organizations, teams, roles, responsibilities, or individuals.
- Technology (How)—Forms, applications, databases, files, programs, code, or media that store, share, or manipulate the data are involved with the processes, or are used by the people and organizations.
- Interaction Matrix. Interaction between the Information Life Cycle phases (POSMAD) and the four Key Components.
- Location (Where) and Time (When and How Long) Note: The top half of the framework, along with the first long bar, answers the interrogatives of who, what, how, why, where, when, and how long.
- Broad-Impact Components. Additional factors that affect information quality. Lower your risk by ensuring that components have been discussed and appropriately addressed. If they are not addressed, you are still at risk (RRISCC) as far as information quality is concerned.
- Requirements and Constraints
- Responsibility
- Improvement and Prevention
- Structure and Meaning
- Communication
- Change
- Culture and Environment. Take into account to better accomplish your goals.
Source: Copyright © 2005–2008 Danette McGilvray, Granite Falls Consulting, Inc.

Figure A.1 • The Framework for Information Quality (FIQ).
Source: Copyright © 2005–2008 Danette McGilvray, Granite Falls Consulting, Inc.
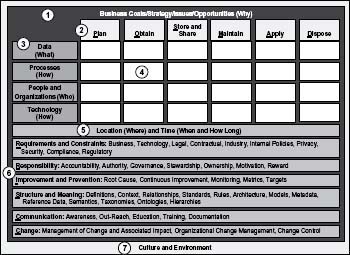
The POSMAD Interaction Matrix in Detail
The POSMAD Interaction Matrix is part of the Framework for Information Quality. Figure A.2 contains sample questions in each cell of the matrix to indicate the interaction between the phases of the POSMAD Information Life Cycle and the four Key Components—data, processes, people/organizations, and technology—that impact information quality.
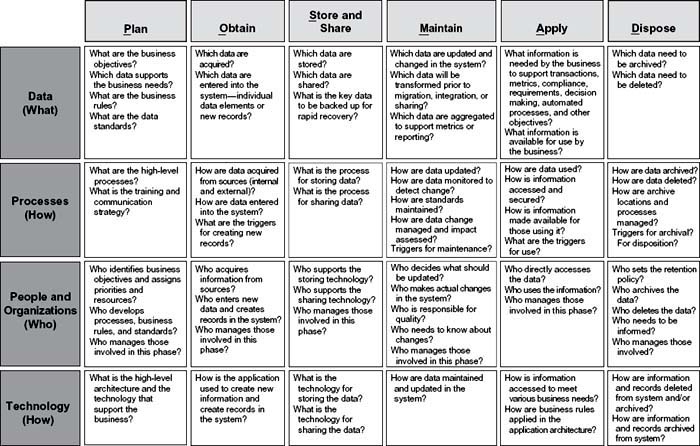
Figure A.2 • POSMAD interaction matrix detail—sample questions.
Source: Copyright © 2005–2008 Danette McGilvray, Granite Falls Consulting, Inc.
POSMAD Phases and Activities
The acronym POSMAD is used to help remember the six phases—Plan, Obtain, Store and Share, Maintain, Apply, Dispose—in the Information Life Cycle. Table A.1 describes the activities and provides examples of them within each of the life cycle’s phases as they apply to information.
Table A.1 • POSMAD Information Life Cycle Phases and Activities

Data Quality Dimensions
A Data Quality Dimension is an aspect or feature of information and a way to classify information and data quality needs. Dimensions are used to define, measure, and manage the quality of the data and information. Table A.2 contains a quick reference list of the 12 data quality dimensions used in The Ten Step process.
Table A.2 • Data Quality Dimensions
| NO. | DIMENSION | DEFINITION |
| 1 | Data Specifications | A measure of the existence, completeness, quality, and documentation of data standards, data models, business rules, metadata, and reference data |
| 2 | Data Integrity Fundamentals | A measure of the existence, validity, structure, content, and other basic characteristics of the data |
| 3 | Duplication | A measure of unwanted duplication existing within or across systems for a particular field, record, or data set |
| 4 | Accuracy | A measure of the correctness of the content of the data (which requires an authoritative source of reference to be identified and accessible) |
| 5 | Consistency and Synchronization | A measure of the equivalence of information stored or used in various data stores, applications, and systems, and the processes for making data equivalent |
| 6 | Timeliness and Availability | A measure of the degree to which data are current and available for use as specified and in the time frame in which they are expected |
| 7 | Ease of Use and Maintainability | A measure of the degree to which data can be accessed and used and the degree to which data can be updated, maintained, and managed |
| 8 | Data Coverage | A measure of the availability and comprehensiveness of data compared to the total data universe or population of interest |
| 9 | Presentation Quality | A measure of how information is presented to and collected from those who utilize it. Format and appearance support appropriate use of information. |
| 10 | Perception, Relevance, and Trust | A measure of the perception of and confidence in the quality of the data; the importance, value, and relevance of the data to business needs |
| 11 | Data Decay | A measure of the rate of negative change to the data |
| 12 | Transactability | A measure of the degree to which data will produce the desired business transaction or outcome |
Business Impact Techniques
Business Impact Techniques use qualitative and quantitative measures for determining the effects of data quality on the business. Table A.3 contains a quick reference list of the eight Business Impact Techniques used in the methodology—Ten Steps to Quality Data and Trusted Information™.
Figure A.3 shows a continuum of the relative time and effort to determine business impact for each technique from generally less complex and taking less time (technique 1) to more complex and taking more time (technique 8).
Table A.3 • Business Impact Techniques
| NO. | BUSINESS IMPACT TECHNIQUE | DEFINITION |
| 1 | Anecdotes | Collect examples or stories about the impact of poor data quality. |
| 2 | Usage | Inventory the current and/or future uses of the data. |
| 3 | Five “Whys” for Business Impact | Ask “Why” five times to get to the real business impact. |
| 4 | Benefit versus Cost Matrix | Analyze and rate the relationship between benefits and costs of issues, recommendations, or improvements. |
| 5 | Ranking and Prioritization | Rank the impact of missing and incorrect data on specific business processes. |
| 6 | Process Impact | Illustrate the effects of poor-quality data on business processes. |
| 7 | Cost of Low-Quality Data | Quantify the costs and revenue impact of poor-quality data. |
| 8 | Cost-Benefit Analysis | Compare potential benefits of investing in data quality with anticipated costs, through an in-depth evaluation. Includes return on investment (ROI)*—profit from an investment as a percentage of the amount invested. |
*The phrases ROI or return on investment are often used in a general sense to indicate any means of showing some type of return on an investment. ROI in technique 8 refers to the formula for calculating return on investment.
Overview of The Ten Steps Process
The Ten Steps process is the approach for assessing, improving, and creating information and data quality. The steps that need to be used are shown in Figure A.4 and described in the box on the next page.
Figure A.4 • The Ten Steps process.
Source: Copyright © 2005–2008 Danette McGilvray, Granite Falls Consulting, Inc.
The Ten Steps Process—Assessing, Improving, and Creating Information and Data Quality
- Define Business Need and Approach—Define and agree on the issue, the opportunity, or the goal to guide all work done throughout the project. Refer to this step throughout the other steps in order to keep the goal at the forefront of all activities.
- Analyze Information Environment—Gather, compile, and analyze information about the current situation and the information environment. Document and verify the information life cycle, which provides a basis for future steps, ensures that relevant data are being assessed, and helps discover root causes. Design the data capture and assessment plan.
- Assess Data Quality—Evaluate data quality for the data quality dimensions applicable to the issue. The assessment results provide a basis for future steps, such as identifying root causes and needed improvements and data corrections.
- Assess Business impact—Using a variety of techniques, determine the impact of poor-quality data on the business. This step provides input to establish the business case for improvement, to gain support for information quality, and to determine appropriate investments in your information resource.
- Identify Root Causes—Identify and prioritize the true causes of the data quality problems and develop specific recommendations for addressing them.
- Develop Improvement Plans—Finalize specific recommendations for action. Develop and execute improvement plans based on recommendations.
- Prevent Future Data Errors—Implement solutions that address the root causes of the data quality problems.
- Correct Current Data Errors—Implement steps to make appropriate data corrections.
- Implement Controls—Monitor and verify the improvements that were implemented. Maintain improved results by standardizing, documenting, and continuously monitoring successful improvements.
- Communicate Actions and Results—Document and communicate the results of quality tests, improvements made, and results of those improvements. Communication is so important that it is part of every step.
Definitions of Data Categories
Data categories are groupings of data with common characteristics or features. Table A.4 includes definitions and examples for major data categories. These definitions were jointly created by Danette McGilvray, author of Executing Data Quality: Ten Steps to Quality Data and Trusted Information™ and Gwen Thomas, president of the Data Governance Institute.
Table A.4 • Definitions of Data Categories
Source: Copyright © 2007–2008 Danette McGilvray and Gwen Thomas. Used by permission.