
8
Accounting and Valuation of Inventory
CHAPTER OBJECTIVES
This chapter will help the readers to:
- Understand the meaning of the term ‘inventory’ and identify various components of inventory.
- Quantify the impact of inventory on the statement of profit and loss and on the balance sheet.
- Differentiate between periodic inventory system and perpetual inventory system.
- Compute the cost of goods sold and ending inventory using different methods of inventory, viz., FIFO, LIFO, weighted average and specific identification.
- Appreciate the application of conservatism principles while valuing inventory using ₹lower of cost or net realizable value’.
- Appreciate the requirements of Ind AS 2 on accounting and valuation of inventory.
8.1 MEANING OF INVENTORY
In the ordinary course of business an enterprise buys various types of raw materials, consumables and components to be used in production or simply for the purpose of resale. To ensure continuous availability of such items, sufficient quantities are maintained in the store. These materials and components are then put to the production line for processing. Once the production process is over they are stored in the finished form before they are finally sold out. Thus ‘inventory’ is made up of material in various forms as discussed above. Based upon the state of completion, inventories may be classified as under:
- Raw material: Goods which are meant to be consumed in the course of production or for rendering of services. They ultimately form part of the finished goods. For example, rubber used for production of tyres, steel used for producing machines or limestone used in manufacturing cement. Components and parts that would be finally used in the finished product are also treated as raw material.
- Consumable stores: They are also used in the production process but do not form part of the finished products. For example, lubricating oil or spare parts to be used for maintenance of machines.
- Work-in-progress: Goods on the production line. They have been injected in the production process but are yet to be finished. In addition to the cost of material and consumables, other manufacturing expenses are also incurred at this stage and hence constitute the cost of workin-progress inventory.
- Finished goods: Goods kept for sale in the ordinary course of business. The manufacturing process is complete; goods are ready for sale but are yet to be sold.
- Stock-in-trade: Inventory of goods bought by the firm for the purpose of resale without further processing is classified as stock-in-trade.
Ind AS 2, defines the expression ‘inventories’ as assets:
- Held for sale in the ordinary course of business.
- In the process of production for such sale.
- In the form of materials or supplies to be consumed in the production process or in the rendering of services.
The composition of inventories will vary from business to business. A trading organization engaged in buying and selling will not have raw material or WIP inventory, whereas a manufacturing organization’s inventory will have all the above components. An enterprise with long production cycle will have higher work in progress inventory, whereas an enterprise with seasonal availability of raw material may have higher amount blocked at that stage. A service organization may not have any inventory at all.
8.2 INVENTORIES AND THE FINANCIAL STATEMENTS
Let us recall the matching principle discussed in Chapter 2 earlier. As per the matching principle, revenue earned by an enterprise is matched against the cost incurred to generate that revenue to ascertain profit. How does matching principle affect accounting for inventory? It may be possible that an enterprise purchases or produces goods in one accounting period which ultimately get sold in the next accounting period, or goods from the previous accounting period get sold in the current accounting period. In these situations inventory cost has been incurred in one accounting period but the revenue is generated in another. The proper matching of revenue and cost is essential to correctly ascertain profit and to depict assets in the balance sheet.
Let us consider an example of Superior Electronics Limited—a dealer in television sets. As on 1st April 2017, it had 100 sets costing ₹ 2,800,000 in the showroom which were purchased in the previous year. During the year 2017–18, it purchased 1,500 sets for ₹ 45,000,000 and it was able to sell 1,300 sets for ₹ 45,500,000. As on 31st March 2018, it has 300 sets still unsold costing ₹ 8,700,000. How will these details be shown in the profit and loss statement for the year 2017–18 and balance sheet as at 31st March 2018?
As the company has sold 1,300 sets during the year, and revenue of ₹ 45,500,000 has been recognized, cost of only 1,300 sets should be matched against this revenue to ascertain profit. The company has a total of 1,600 (100 from previous year and 1,500 purchased during the year) sets available for sale costing ₹ 47,800,000 (₹ 2,800,000 + ₹ 45,000,000). Out of these, 300 sets costing ₹ 8,700,000 are still unsold. Accordingly cost of 1,300 sets sold during the year is ₹ 39,100,000 (₹ 47,800,000 − ₹ 8,700,000). The sets unsold will appear as current asset in the balance sheet at ₹ 8,700,000.
The information will be shown in the profit and loss account and balance sheet as follows:
| Profit and Loss Statement | (Amount in ₹) | |
| Sales | 45,500,000 | |
| Less: Cost of goods sold | ||
| Opening stock | 2,800,000 | |
| Add: Purchases | 45,000,000 | |
| Less: Closing stock | 8,700,000 | 39,100,000 |
| Gross profit | 6,400,000 | |
| Balance Sheet | ||
| Current assets | ||
| Closing stock of inventory | 8,700,000 |
From the above example, we can generalize a simple relationship for cost of goods sold as given in Equation 8.1.
It is obvious that the apportionment of the cost of goods available for sale over closing stock and cost of goods sold can have significant impact on both the financial statements. In the above example, if the sets unsold at the close are valued at say ₹ 9,000,000 instead of ₹ 8,700,000, the cost of goods sold will come down to ₹ 38,900,000 resulting in a higher reported profit of ₹ 86,700,000. Similarly, if the closing stock is undervalued, it will result in higher reported cost of goods sold and therefore lower reported profit. One of the key challenges in inventory accounting is determining the value of closing stock which in turn impacts the cost of goods sold and reported profits. The relationship between inventory and financial statements in case of a trading organization is depicted in Figure 8.1.
In case of a manufacturing organization inventory will pass through various stages. The inventory flow for such an organization is depicted in Figure 8.2.
As discussed earlier, the cost of goods sold will appear in the profit and loss statement whereas closing stock of raw material, work-in-progress and finished goods will form part of the balance sheet. It may also be noted that cost of raw material inventory is at the purchase price whereas cost of WIP and finished goods include appropriate conversion cost as well.

Figure 8.1 Trading Organization—Inventory and Financial Statements

Figure 8.2 Manufacturing Organization—Inventory Flow
8.3 METHODS OF INVENTORY ACCOUNTING
Inventory records may be kept on a periodic basis or perpetual basis. In periodic inventory system, detailed records are kept for the goods purchased. At the end of the accounting period, physical count of the goods unsold is taken and value of goods at hand is ascertained. The value of the closing stock so computed is deducted from the value of inventory available for sale, (i.e., opening stock + purchases during the period) to arrive at the cost of goods sold. No separate record is kept every time goods are sold or consumed.
On the other hand in perpetual inventory system, detailed records of not only goods purchased but also of goods sold or issued to production are kept. At any point of time, the enterprise will be aware of the goods purchased and goods sold to ascertain the goods in hand. At the end of the period, physical count of inventory is compared with the balance as per books. Difference, if any, is analysed and accounted for separately.
Periodic inventory system though simple to operate has its limitations. Firstly, every time the enterprise wants to prepare its financial statements (say monthly or quarterly) physical count of inventory has to be taken, which for a large enterprise is an enormous task. Whereas in perpetual inventory system, financial statements can be prepared on the basis of inventory records without taking a physical count. Secondly, no control over loss of goods due to normal reasons, (e.g., shrinkage, leakage, etc.) or abnormal reasons, (e.g., theft, accidents, etc.) can be exercised in periodic inventory system as the difference between goods available and closing stock is assumed to have been consumed.
8.4 VALUATION OF INVENTORY
One of the main challenges in inventory accounting relates to the valuation of ending inventory or closing stock. Ending inventory so ascertained is deducted from the inventory available for sale to find the cost of goods consumed or goods sold. Following conservatism principle, Ind AS 2, requires inventories to be measured at the lower of cost and net realizable value. Accordingly, following steps are taken for inventory valuation:
- Ascertain the quantity of ending inventory: This is often done by a physical count of the inventory at the end of the accounting period which is reconciled with the perpetual inventory records.
- Ascertain the stage of completion and cost to be included in inventory cost: Depending upon the stage of completion, inventory cost comprises costs of purchase, costs of conversion and other costs incurred in bringing the inventories to their present location and condition is ascertained.
- Allocate the cost of inventory available between ending inventory and cost of goods sold: Out of the total inventory available for sale (opening inventory + purchased/produced during the year) sometimes it may be possible to specifically identify the item remaining unsold and forming part of ending inventory. Alternatively, such an apportionment is made using methods like LIFO, FIFO, and average cost, etc., which are discussed in the subsequent section.
- Compare the cost of ending inventory with its net realizable value: The ending inventory will be valued at the lower of the cost as ascertained in Step 3 above and the net realizable value of ending inventory.
8.4.1 Cost of Purchase
The costs of purchase of inventories includes the purchase price, import duties and other taxes, transport, handling and other costs directly attributable to the acquisition. Taxes and duties which are subsequently recoverable from the tax authorities are excluded from the cost. Any trade discount, quantity discount and rebate given by the supplier of the goods are deducted from the cost of purchase.
8.4.2 Cost of Conversion
The cost of conversion of inventories includes both direct cost and overheads. Costs directly related to production, e.g., direct labour and direct production expenses are included. Fixed and variable production overheads that are incurred in converting materials into finished goods are also systematically allocated to arrive at the cost of inventories.
8.4.3 Other Costs
Other costs, incurred in bringing the inventories to their present location and condition, are also included in the cost of inventories. However, costs like abnormal amounts of wasted materials, labour, storage costs, administrative overheads and selling costs are excluded from the cost of inventories as they do not contribute to bringing inventories to their present location and condition.
8.4.4 Borrowing Cost
If an inventory item necessarily takes a substantial period of time to get ready for its sale, borrowing costs that are directly attributable are also included in the cost of inventories. If, however, inventories are purchased on a deferred credit basis, the difference between the purchase price for normal credit terms and the amount paid is recognized as interest expense over the period of deferred credit.
8.5 COSTING METHODS
As discussed in the previous section, inventory available needs to be divided between closing stock and cost of goods sold. There are various methods for such an apportionment. The enterprise may choose any of the permitted method for the valuation of closing inventory. Inventory method once chosen must be followed consistently period after period. Some of the methods used for this purpose are:
- Specific Identification
- First In First Out (FIFO)
- Last in First Out (LIFO)
- Average Cost
Ind AS 2: The cost of inventories of items that are not ordinarily interchangeable and goods or services produced and segregated for specific projects should be assigned by specific identification of their individual costs.
- Specific identification method: In this method an attempt is made to ascertain the actual cost of the items in the inventory. Application of this method will require tracking actual movement of various inventory items to identify items that have been sold and that are still in inventory. Some of the situation where this method can be used are:
- Inventory items segregated for a specific project
- Goods in transit
- High value items like jewelry which are not interchangeable and hence can be specifically identified
However, where the enterprise deals with a large number of items which are interchangeable, this method may not be feasible. In such cases, other methods involving approximation can be used.
- First-in-first-out (FIFO) method: In this method, we assume that inventory items purchased first are sold or consumed first. With this assumption, the ending inventory will be made up of the most recent purchases whereas the oldest purchases will be appropriated towards cost of goods sold.
- Last-in-first-out (LIFO) method: In LIFO, as the name suggests, the most recent purchases are assumed to have been consumed first. Accordingly, the cost of goods sold will be made up of cost of most recent acquisition whereas the ending inventory will be valued at the price applicable to the oldest purchase.
It may be noted that FIFO and LIFO are merely assumptions for the purpose of ending inventory valuation; the actual flow of material may or may not follow the same flow as suggested by the methods’ names.
- Weighted average cost method: In this method, the ending inventory as well as goods sold is valued at the weighted average cost of goods available. Unlike FIFO and LIFO, where valuation of ending inventory and units sold is at different price, in this method same average price is applied.
The above methods can be used both with periodic inventory system as well as perpetual inventory system. In the former, the assumptions of LIFO, FIFO or average will be applied only at the end of the period. However in perpetual inventory system, the assumption (LIFO, FIFO, etc.) will be applied every time goods are sold or consumed. Likewise in average cost method, new average cost will be computed whenever fresh acquisitions are made and the new average cost is applied to all the units sold till further acquisition.
Comparison of the Methods
In case of an inflationary economy, FIFO will result is higher ending inventory and therefore lower cost of goods sold and higher profits compared to LIFO. The numbers as per average cost method will be somewhere in between FIFO and LIFO. Ind AS 2 does not permit use of LIFO and accordingly ‘the cost of inventories should be assigned by using the first-in-first-out (FIFO), or weighted average cost formula’.1 An entity shall use the same cost formula for all inventories which have similar nature and use to the entity. However, it is permitted to use different cost formulas for inventories which are of different nature or use to the entity.
Ind AS 2: The cost of inventories should be assigned by using the first-in, first out (FIFO), or weighted average cost formula.
■ Illustration 8.1
Based upon the following information ascertain the value of ending inventory using FIFO, LIFO and average cost method:
| Number of Units | Unit Cost (₹) | Total Cost (₹) | |
| Opening stock | 700 | 1,200 | 840,000 |
| Purchases during the year | 3,300 | 1,300 | 4,290,000 |
| Available for sale | 4,000 | 5,130,000 | |
| Sold during the year | 2,900 | ||
| Closing stock | 1,100 |
FIFO Method: Assuming that the ending inventory is made up of most recent purchases.
| Number of Units | Unit Cost ( ₹) | Total Cost ( ₹) | |
| Cost of goods sold | |||
| From opening stock | 700 | 1,200 | 840,000 |
| From purchases | 2,200 | 1,300 | 2,860,000 |
| Total | 2,900 | 3,700,000 | |
| Ending inventory | |||
| From purchases | 1,100 | 1,300 | 1,430,000 |
LIFO Method: Assuming that the most recent purchases have been sold first.
| Number of Units | Unit Cost ( ₹) | Total Cost ( ₹) | |
| Cost of goods sold | |||
| From purchases | 2,900 | 1,300 | 3,770,000 |
| Total | 2,900 | 3,770.000 | |
| Ending inventory | |||
| From opening stock | 700 | 1,200 | 840,000 |
| From purchases | 400 | 1,300 | 520,000 |
| Total | 1,100 | 1,360,000 |
Average Cost Method: Average cost per unit is found by diving the total cost of inventory available for sale (opening stock + purchases) by the total number of units. The closing stock and cost of goods sold is ascertained by applying the average cost per unit.
| Number of Units | Unit Cost ( ₹) | Total Cost ( ₹) | |
| Cost of goods sold | 2,900 | 1,282.50 | 3,719,250 |
| Ending inventory | 1,100 | 1,282.50 | 1,410,750 |
Comparison
| FIFO ( ₹) | LIFO ( ₹) | Average cost ( ₹) | |
| Cost of goods sold | 3,700,000 | 3,770,000 | 3,719,250 |
| Ending inventory | 1,430,000 | 1,360,000 | 1,410,750 |
8.5.1 Net Realizable Value
The methods described above help in measuring the cost of ending inventory. Normally inventory is stated in the balance sheet at its cost. However, there may be situations where the realizable value of the ending inventory may be lower than the cost so calculated. For example, an inventory item is damaged or has become obsolete or the market price of finished goods has declined substantially. If there is any evidence to suggest that the realizable value of an inventory item has fallen, e.g., due to damage, obsolescence or a sharp decline in the market price of raw material or finished goods, the carrying amount of the inventory in the balance sheet may have to be written down. The conservatism principle states that inventory should be shown in the balance sheet at the lower of the cost or realizable value of ending inventory.
Ind AS 2: Inventories should be valued at the lower of the cost and net realizable value
According to Ind AS 2, the net realizable value is ascertained on item by item basis rather than as a group. Such an exercise is required to be done at each balance sheet date. To ascertain the net realizable value, we start by looking at the amount that the inventory is expected to be sold in the ordinary course of business. From the estimated selling price, costs estimated to be incurred towards selling expenses and towards completion of the inventory are deducted to arrive at the net realizable value (NRV). Accordingly, the NRV can be expressed as follows:
The NRV so computed is compared with the cost of inventory and the lower of the two is taken as the carrying amount in the balance sheet.
Materials and other supplies to be used in production are not written down below cost if the finished good in which they will be incorporated are expected to be sold at or above cost. However, when there has been a decline in the price of materials and it is estimated that the cost of the finished products will exceed net realizable value, the materials are written down to net realizable value. In such circumstances, the replacement cost of the materials is taken as their net realizable value.
■ Illustration 8.2
Based upon the following information for the inventory items, ascertain the value at which ending inventory should be shown:
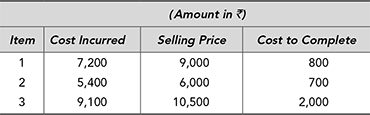
Item 1: Net realizable value = ₹ 9,000 − ₹ 800 = ₹ 8,200. As NRV is greater than the cost incurred, it will be shown at the cost price.
Item 2: Net realizable value = ₹ 6,000 − ₹ 700 = ₹ 5,300. As NRV is less than the cost incurred, it will be shown at the NRV.
Item 3: Net realizable value = ₹ 10,500 − ₹ 2,000 = ₹ 8,500. As NRV is less than the cost incurred, it will be shown at the NRV.
The inventory accounting policy of some companies is given in Box 8.1
Box 8.1 Inventory Accounting Policy of Indian Companies
Ultratech Cements Limited
Inventories are valued as follows:
- Raw materials, fuel, stores and spare parts and packing materials: Valued at lower of cost and net realisable value (NRV). However, these items are considered to be realisable at cost, if the finished products, in which they will be used, are expected to be sold at or above cost. Cost is determined on weighted average basis.
- Work-in-progress (WIP), finished goods, stock-in-trade and trial run inventories: Valued at lower of cost and NRV. Cost of Finished goods and WIP includes cost of raw materials, cost of conversion and other costs incurred in bringing the inventories to their present location and condition. Cost of inventories is computed on weighted average basis.
- Waste/Scrap: Waste/Scrap inventory is valued at NRV. Net realisable value is the estimated selling price in the ordinary course of business, less the estimated costs of completion and the estimated costs necessary to make the sale.
Bajaj Auto Limited
Cost of inventories have been computed to include all costs of purchases (including materials), cost of conversion and other costs incurred, as the case may be, in bringing the inventories to their present location and condition.
- Finished stocks of vehicles and auto spare parts and stocks of work-in-progress are valued at cost of manufacturing or net realisable value whichever is lower. Cost is calculated on a weighted average basis. Cost of finished stocks of vehicles lying in the factory premises, branches, depots are valued inclusive of excise duty.
- Stores, packing material and tools are valued at cost arrived at on weighted average basis or net realisable value, whichever is lower.
- Raw materials and components are valued at cost arrived at on weighted average basis or net realisable value, whichever is lower, as circumstances demand. However, obsolete and slow moving items are valued at cost or estimated realisable value whichever is lower.
- Inventory of machinery spares and maintenance materials not being material are expensed in the year of purchase. However, machinery spares forming key components specific to a machinery and held as insurance spares are capitalised along with the cost of the asset.
- Goods in transit are stated at actual cost incurred up to the date of Balance Sheet.
8.6 DISCLOSURES
The following disclosures are required to be made in financial statements:
- The accounting policies adopted in measuring inventories, including the cost formula used.
- The total carrying amount of inventories and the carrying amount in classifications appropriate to the entity.
- The carrying amount of inventories carried at fair value less costs to sell.
- The amount of inventories recognised as an expense during the period.
- The amount of any write-down of inventories recognised as an expense in the period.
- The amount of any reversal of any write-down that is recognised as a reduction in the amount of inventories recognized as expense in the period.
- The circumstances or events that led to the reversal of a write-down of inventories.
- The carrying amount of inventories pledged as security for liabilities.
Summary
- Inventory constitutes a big component in the balance sheet as well as in profit and loss account. As such valuation of ending inventory is a key issue in accounting.
- Inventory includes material to be used in production (raw material), on the production line (work in progress) and goods held for sale in the ordinary course of business (finished goods).
- Beginning inventory plus inventory acquired during the period makes the total inventory available for sale. Cost of goods sold is ascertained by deducting ending inventory from this. Accordingly, COGS = Beginning inventory + Purchases during the year − Ending inventory.
- In periodic inventory system details records of goods consumed or sold are not kept. The ending inventory is ascertained by taking a physical count and value of the same is deducted from the inventory available to arrive at the cost of goods sold.
- In perpetual inventory system, detailed records are kept in respect of inventory consumed or sold as well. The ending inventory as per the records is matched against the physical count.
- The carrying amount of ending inventory is taken at the lower of cost or net realizable value.
- As per Ind AS 2, the cost of ending inventory can be ascertained either by using specific identification method or FIFO or weighted average method.
- The net realizable value of an inventory item is equal to the estimated selling price in the ordinary course of business less cost to complete the product and cost of making sale.
- The NRV is compared with the cost and the lower of the two is taken as the value of ending inventory.
Assignment Questions
- What are the different types of inventories?
- ‘Valuation of closing stock affects both the Balance Sheet and the Profit and Loss Statement’. Do you agree with the above statement?
- Differentiate between periodic and perpetual method of keeping inventory records?
- How is conservatism principle applied while valuing closing stock?
- Explain different steps in inventory valuation?
- Compare the impact on LIFO, FIFO and average cost method on the financial statements in case of an inflationary economy.
Problems
- Finding the missing numbers: Please complete the income statement for the year 2016–17 based upon the information given:

- Error in inventory valuation: The profit and loss account of Innovative Products Limited for the years 2016 and 2017 is given below:

The management was surprised to note that though the sales have increased by 9%, the profit before tax has actually declined almost by 35%. While reviewing the numbers it was revealed that the closing stock for the year 2016 was overstated by ₹ 1,000,000. You are required to restate the Profit and loss statement for both the years.
- Periodic inventory system: Sharda Limited uses periodic inventory system for accounting. The following data pertains to quarter ended 30th June 2017:

The sales of the company during the quarter amounted to ₹ 2,700,000. The physical verification at the quarter end revealed 1,200 units in hands.
Using LIFO, FIFO and average cost method calculate:
- Cost of goods available for sale
- Value of closing inventory
- Cost of goods sold
- Gross profits
- Perpetual inventory system: Assuming that Sharda Limited uses a perpetual inventory system and keeps detailed record of purchase and sales. The datewise break up of purchase and sales during the quarter is given below:

Using LIFO, FIFO and average cost method, calculate:
- Value of closing inventory
- Cost of goods sold
- Gross profits
- Lower of cost or net realizable value: Precision Limited deals in highly sophisticated engineering items. It imports these items in semi finished form. These items are processed further to meet the precise requirement of the customers. There has been a substantial decline in the selling price of some of the finished items as well the import price of these items.
As on 31st March, the details of inventory is given below:

- For each inventory item, ascertain the value at which it should be included in the ending inventory, assuming each inventory item is treated separately?
- What will be the impact of applying ‘lower of cost or net realizable value’ principle on the profit of the company in the current year?
- What will be the impact in the next year?
- If all the above items are taken together for inventory valuation, what will be the inventory valuation and impact on profit?
Solutions to Problems
-

- Corrected profit and loss statement

-
- Cost of goods available for sale = Opening stock + Purchases
= ₹ 840,000 + ₹ 2,520,000 = ₹ 3,360,000
- Closing inventory
FIFO − 1,200 units at ₹ 1,260 = ₹ 1,512,000
LIFO − 700 units at ₹ 1,200 + 500 units at ₹ 1,260 = ₹ 1,470,000
Average cost method − 1,200 units at ₹ 1,244.44 = ₹ 1,493,333
- Cost of goods sold = Goods available for sale − Closing stock
FIFO = ₹ 3,360,000 − ₹ 1,512,000 = ₹ 1,848,000
LIFO = ₹ 3,360,000 − ₹ 1,470,000 = ₹ 1,890,000 Average cost = ₹ 3,360,000 − ₹ 1,493,333 = ₹ 1,866,667
- Gross profit = Sales − Cost of goods sold
FIFO = ₹ 2,700,000 − ₹ 1,848,000 = ₹ 852,000
LIFO = ₹ 3,360,000 − ₹ 1,890,000 = ₹ 810,000
Average Cost = ₹ 3,360,000 − ₹ 1,866,667 = ₹ 833,333
- Cost of goods available for sale = Opening stock + Purchases
- FIFO method
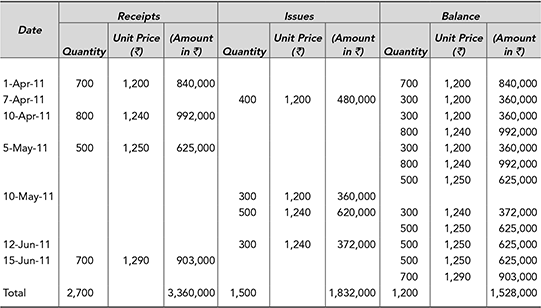
Goods available for sale: ₹ 3,360,000
Cost of goods sold: ₹ 1,832,000
Closing inventory: ₹ 1,528,000
Gross profit: ₹ 868,000
LIFO method
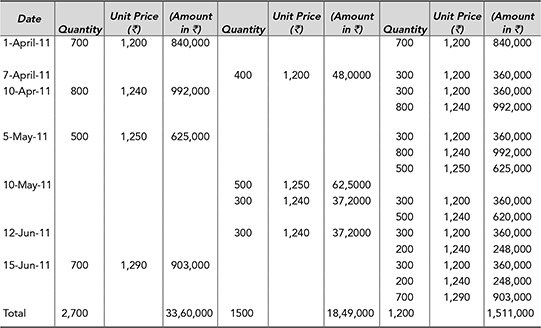
Goods available for sale: ₹ 3,360,000
Cost of goods sold: ₹ 1,849,000
Closing inventory: ₹ 1,511,000
Gross profit: ₹ 851,000
Average cost method

Goods available for sale: ₹ 3,360,000
Cost of goods sold: ₹ 1,839,187.50
Closing inventory: ₹ 1,520,812.50
Gross profit: ₹ 860,812.50
-

- Ending inventory
101 – ₹ 720,000
102 – ₹ 480,000
103 – ₹ 335,000
104 – ₹ 570,000
105 – ₹ 360,000
- The application of ‘lower of cost or net realizable value’ will result in the closing inventory values at ₹ 2,465,000 as against ₹ 2,600,300 cost incurred. As a result, the cost of goods sold will be higher by ₹ 135,300 and profit lower by the same amount.
- In the next year due to lower opening stock, the cost of goods sold will be lower by ₹ 135,300 and therefore the profit will be higher by the amount.
- If all the above items are taken together rather than item by item, the NRV comes to ₹ 2,750,000 which is higher than the cost incurred at ₹ 2,600,300. The inventory accordingly will be valued at the lower of the two, i.e. ₹ 2,600,300.
- Ending inventory
Try It Yourself
- Finding the missing numbers: Please complete the income statement for the year 2016–17 based upon the information given:

- Impact of inventory costing method: Super Star Trading Limited is evaluating the effect of various inventory costing methods (FIFO, LIFO, Average Cost) on the financial statements of the company. The company expects moderate to high inflation in the coming years in respect of its inventory items. Which of the method will:
- result in highest closing inventory.
- result in highest cost of goods sold.
- result in highest profit.
- result in most stable profit over a period of time.
- Error in inventory valuation: The profit and loss statement of Ace Trading Limited for the years 2016 and 2017 is given below:

While reviewing the numbers, it was revealed that the closing stock for the year 2016 was understated by ₹ 2,300,000. You are required to restate the profit and loss statement for both the years incorporating the revised value of closing stock.
- Periodic inventory system: STU Electronics Limited is a trader in electronic items and maintains its inventory using periodic inventory system. The following data pertains to quarter ended 31st December 2017 for one of its high selling products:

The sales of the company during the quarter amounted to ₹ 14,400,000. The physical verification at the quarter end revealed 170 units in hands.
Using LIFO, FIFO and average cost method, calculate:
- Cost of goods available for sale
- Value of closing inventory
- Cost of goods sold
- Gross profits
- Lower of cost or net realizable value: Due to the introduction of the new model, STU Limited estimates that the remaining 170 units could be sold only at ₹ 12,200 per unit. The company also estimates that it will have to pay ₹ 500 per unit as salesman commission. Based upon this additional information, work out the value of closing inventory, cost of goods sold and the gross profit for the quarter ended on 31st December 2017.
- Lower of cost or net realizable value: Using the following information, determine the closing inventory to be shown in the financial statements:

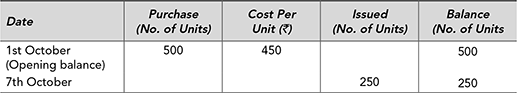
- FIFO with Perpetual Inventory System: High Power Instruments Limited uses FIFO method for issue of components from its stores department. The details of purchases and issues in respect of a component HT-1 during the quarter ended 31st December 2017 are given below. Based upon the information available calculate the cost of material consumed and value of closing stock.

- LIFO and Weighted Average with Perpetual Inventory System: If High Power Instruments Limited uses LIFO or Weighted Average Method for valuation of inventory what will be the impact on the cost of material consumed and value of closing stock.
Cases
Case 8.1: Drink Well Beer Limited—Accounting for Empty Bottles
The Drink Well Beer Limited runs a number of outlets for selling beer. Some of the bottles sold at these outlets are carried by the customers and are consumed later. In other cases, the beer is consumed by the customer in the bar operated by the company near the beer outlets. In such cases the empty bottles are left behind by the customers and the company takes the possession of the empty bottles. The company keeps proper records of these bottles and sells them by inviting tenders. While preparing the accounts for the year 2016–17, the company estimated that the stock of empty bottles in hand has a realizable value of about ₹ 12 million. The accounts team is debating about the possible treatment of these empty bottles in the accounts for the year 2016–17. The following options were discussed:
- Mention the realizable value by way of notes to accounts only. The stock will not be brought into accounts at all. As the company is not the legal owner of these bottles (having been sold to the customers) it cannot be shown as an asset in the balance sheet.
- Include the stock of empty bottles in the balance sheet under current assets under a separate heading at the current realizable value of ₹ 12 million.
- Include the stock of empty bottles in the balance sheet under current assets as inventory. Inventory is required to be valued at lower of the cost of net realizable value. As the cost of these empty bottles in NIL, the stock may be included in the balance sheet at a nominal value (say ₹1).
Questions for Discussion
- Which of the above three alternatives will you prefer?
- What will be the impact of the above alternatives on the profit and loss account of the company?
Case 8.2: The Bombay Dyeing and Manufacturing Company Limited—Valuation of Inventories on Lower of Cost or Realizable Value
The Bombay Dyeing and Manufacturing Company Limited was established in the year 1879. It is a leading player offering products like stylish linens, towels, home furnishings, leisure clothing and kids wear, etc. As per the accounting policy of the company, the inventories are valued at lower of cost and net realizable value.
During the month of March 2003, the company entered into a firm purchase contract for import of raw material viz. paraxylene at an aggregate cost of ₹ 27.82 crore. Paraxylene is an important input for manufacturing dimethyl terephthalate (DMT), one of the main products of the company. The company ‘expected that the net realizable value, estimated at ₹ 14.96 crore, will be substantially lower than the cost, compared with reference to the estimated selling price of DMT’2. Accordingly a provision for this loss, estimated at ₹ 12.86 crore was made in the accounts for the year 2002–03.
However, the company decided to reverse this provision during the year 2003–04. Accordingly, the provision for the loss was reversed during the year 2003–04 by adjusting the same from the cost of raw material consumed. The cost of inventory consumed as shown in the schedule to accounts is shown below:

The profit before tax for the company for the year 2002–03 and 2003–04 stood at ₹ 33.53 crore and ₹ 72.56 crore respectively.
Questions for Discussion
- How to ascertain the realizable value of the raw material? Should the company have considered the replacement cost of the raw material?
- What is the impact of above provisioning and reversal on the profit of the company? What would have been the profit before tax for the two years in question if no provisioning was done for the contingent loss?
- What is the impact of the above transaction on the balance sheet of the company for the two years in question?
Endnotes
- Ibid., 1.
- Annual Report of Bombay Dyeing and Manufacturing Company Limited for the year 2002–03.