12
Exploiting Fog Computing in Health Monitoring
Tuan Nguyen Gia and Mingzhe Jiang
12.1 Introduction
The number of people with cardiovascular diseases is at an alarming rate. According to the National Center for Health, more than 28.4 million people in the United States have cardiovascular diseases in 2015 [1]. Risks for heart diseases become higher for people with diabetes, obesity, and physical inactivity. Cardiovascular diseases can cause serious consequences such as kidney trauma, nerves injury, and even death [2]. For example, stroke, which is one of the cardiovascular diseases, kills about 129,000 Americans each year [2, 3]. To lessen the severe effects of cardiovascular diseases, health‐monitoring systems are often used in many hospitals and healthcare centers. These systems monitor vital signals such as electrocardiography (ECG), body temperature, and blood pressure. Based on the collected biosignals, medical doctors apply suitable treatment methods.
More than 30% of people over 50 years old fall every year with severe consequences [4]. Only half of those fall cases are reported to medical doctors or caregivers [5]. Dealing with injuries from an unreported fall is difficult, time‐consuming, and costly. Together with cardiovascular diseases, falling is one of the leading causes of adult disability and many other serious injuries such as brain injuries [2, 4]. Therefore, there is an urgent need for fall detection systems that can inform the incident to medical doctors or caregivers in real time. A quick response from a medical doctor to a fall case may help to reduce the severity of the injury and save a patient's life.
Conventional health‐monitoring systems (e.g., ECG monitoring) often have many drawbacks, such as nonubiquitous access to data and noncontinuous monitoring. For instance, 12 leading ECG monitoring systems in many hospitals do not support mobility and their ECG measurements are applied for an instant moment or a short time period (e.g., a couple of minutes). In addition, the results of the measurements provided by these systems cannot be analyzed in real time by medical doctors or specialists. There is a need for enhanced healthcare systems that proffer continuous real‐time health monitoring and other advanced services for improving quality of healthcare services. Via the systems, medical doctors can remotely access the collected data for real‐time analysis. In addition, the systems can report abnormality or emergency (e.g., a fall, too low or too high heart rate) to doctors or caregivers for a quick response [6, 7].
Internet of Things (IoT), which is described as a dynamic platform where physical and virtual objects are interconnected, can be a suitable option for improving health‐monitoring systems [8]. IoT‐based health‐monitoring systems involving wearable devices, wireless body sensor networks, and cloud computing are able to provide high‐quality services (e.g., long‐term history of data) with low costs while they do not interference the patient's daily activities [8]. For example, the wearable devices in IoT systems can collect different types of biosignals such as ECG, electromyography (EMG), and electroencephalography (EEG).
Some other sensors such as an accelerometer, gyroscope, and magnetometer can provide parameters related to human motions (e.g., stepping and hand moving) [9–11]. In many cases, the collected data are transmitted to gateways which primary forward to the data to cloud servers for further processing (e.g., data processing and data analysis). Correspondingly, the e‐health data can be remotely monitored in real time in human‐readable forms such as text or graphical forms [12]. In addition, the systems are able to detect abnormalities (e.g., a fall or a high heart rate) via algorithms running on cloud servers. The detected abnormality is informed to correspondent individuals (e.g., medical doctors) in real time [13].
However, there are challenges in these IoT systems, such as transmission bandwidth and wearable sensor nodes' energy efficiency. For instance, wearable sensor nodes in multichannel ECG or EMG monitoring IoT‐based systems often collect a large amount of data with a high data rate (e.g., about 6 kbps per ECG channel) and wirelessly transmit the data over a network [6]. Gateways in these systems primarily forward the collected data to cloud servers for storing and analysis. Correspondingly, wearable sensor nodes' lifetimes cannot last for a long time period because these nodes often have to perform both computational and communicational tasks with a limited power budget. In addition, the network and cloud servers must deal with a large volume of data, which may cause the higher error rate and infringe latency requirements of real‐time healthcare systems (e.g., the maximum latency of ECG signals is 500 ms [14]). Therefore, the energy consumption of the sensor nodes and the volume of the data transmitted over the network must be reduced as much as possible while maintaining a high level of quality of service (QoS).
A suitable solution for dealing with these challenges in IoT systems while maintaining the high quality of healthcare services is to exploit fog computing at smart gateways [15–17]. In detail, an extra layer called fog is added in between conventional gateways and cloud servers. Fog computing helps to reduce the burdens of wearable sensor nodes by switching computational loads from the wearable devices to smart gateways. For example, computationally heavy loads of running complex algorithms (e.g., ECG extraction algorithms based on wavelet transform) are forced to be run at a fog layer of smart gateways instead of sensor nodes [18]. Correspondingly, the sensor node's lifetime can be increased dramatically [18, 19]. Furthermore, fog computing facilitates enhanced services at the edge of the network and reduces the burdens of cloud servers [20]. Fog computing helps to bring the cloud computing paradigm to the edge of the network and provides advanced features, which are supported by cloud servers [18, 20]. For example, some of the fundamental characteristics of fog computing are location awareness, geographical distribution, interoperability, edge location, low latency, and support for online analytics [20]. To sum up, a combination of fog computing and IoT systems using smart gateways and wearable devices can be a sustainable solution for existing challenges in remote continuous health‐monitoring systems.
In this chapter, we exploit fog computing in health‐monitoring IoT systems for enhancing the quality of healthcare service. Fog computing and its services help to improve the energy efficiency of the sensor devices (nodes), increase the security level, and save network bandwidth. In addition, the fog‐assisted system analyzes and processes data in a distributed manner at smart gateways for providing real‐time analytic results. To demonstrate the benefits of fog computing in IoT systems, a complete system including wearable sensor nodes, gateways with fog computing, and end‐user terminals is implemented. Two cases studies related to human fall detection and heart rate variability are presented and evaluated.
The rest of the chapter is organized as follows: Section shows an overview of the architecture of an IoT‐based system with fog computing. Section provides Fog computing services in smart e‐health gateways. Section presents system implementation. Section provides a case study, experimental results, and evaluation. Section presents discussions. Section presents the related applications in fog computing. Section discusses future research directions. Section concludes the work.
12.2 An Architecture of a Health Monitoring IoT‐Based System with Fog Computing
Health monitoring IoT systems have to be reliable because their results indirectly or directly impact the medical doctor's analysis and decisions. An error or a delay in the results may lead to serious consequences, such as an incorrect treatment or a late response to the emergency, which may negatively affect human health. For example, a late notification from a human fall detection monitoring IoT system to a medical doctor can lead to a late response to a serious head injury, which quite possibly causes a death. In this situation, if a medical doctor was informed about the case in real time, the doctor could provide first‐aid procedures (e.g., stopping bleeding) to save the patient's life. Therefore, health‐monitoring IoT systems must provide high‐quality data in real time. The latency requirements of e‐health signals vary, depending on the characteristics of particular e‐health signals. For instance, a maximum latency of EMG signals is less than 15.6 ms [14]. In addition, it is necessary for the system to provide advanced services such as push notification for reporting emergencies to respondent personnel in real time.
However, the conventional health‐monitoring IoT systems built from sensor devices (nodes), gateways, and cloud server cannot fulfill the strict requirements of latency in many cases (e.g., a disconnection between the system's gateway and cloud servers). To overcome disadvantages of the conventional health‐monitoring system, advance health‐monitoring IoT systems with fog computing are presented. An architecture of the system with fog computing is shown in Figure 12.1. The system includes several primary components such as a sensor layer, smart gateways with a fog layer, and cloud servers with end‐user terminals. The functionality of distinct layers of the architecture is described as follows.

Figure 12.1 Architecture of remote real‐time health‐monitoring IoT system with fog computing.
12.2.1 Device (Sensor) Layer
A device (sensor) layer consists of sensor nodes in which each node often has three primary components, including sensors, a micro‐controller, and a wireless communication chip. In some applications [21], an SD card can be integrated into a sensor node for storing temporary data. The sensors (e.g., ECG, glucose, SpO2, humidity, and temperature sensors) are used for collecting contextual data from surrounding environments and e‐health data from a human body. The contextual data such as room temperature, humidity, and statuses of the patient activities helps to improve the quality of e‐health data and a doctor's decisions. For example, a heart rate of 100 beats/s of a healthy person will be normal when the person is running, whereas this rate will be high and problematic if he/she is resting on a chair. Without the activities statuses, it is difficult to achieve an accurate analysis. Collecting contextual data does not dramatically increase the burden of a sensor node in terms of weight, size, complexity, and energy consumption dramatically. For example, the activity statuses can be extracted from a single IC chip having 3‐D accelerometer and 3‐D gyroscope, while room temperature and humidity can be collected from another IC chip. These chips are often small, lightweight, and energy efficiency [10, 11]. The sensors often communicate with a micro‐controller via one of the wire protocols such as UART, SPI, or I2C.
The micro‐controller is often a low‐power chip supporting sleep modes and waking up methods. The micro‐controller's frequency can vary depending on applications. For example, an 8 MHz micro‐controller can be used for collecting high‐quality data from sensors and performing some light computation tasks (e.g., Advanced Encryption Standard – AES algorithm) while it still fulfills requirements of latency [11, 15]. The micro‐controller also communicates with a wireless chip via one of the mentioned wire methods.
The wireless communication chip is various depending on the applications' requirements. In general, low‐power wireless protocols (e.g., BLE and 6LoWPAN) are more preferred for low data rate applications such as fall detection or heart rate monitoring because these protocols have a maximum bandwidth of 250 kbps [10, 13]. In contrast, Wi‐Fi is chosen for high‐quality streaming applications (e.g., video surveillance or 24‐channel EEG monitoring) where energy consumption is not the most important criteria.
12.2.2 Smart Gateways with Fog Computing
Fog computing can be described as a convergent network of interconnected smart gateways with fog services. Depending on applications' requirements, a smart gateway can be movable or fixed in a specific place. Each gateway type (i.e., mobile or fixed type) has its own advantages and disadvantages. For example, a mobile gateway provides a mobility support but it has a limited battery capacity and hardware resource constraints. In contrast, a fixed gateway is often built from a powerful device supplied from a wall socket's power. Correspondingly, the fixed gateway can perform heavy computational tasks easily and provide more advanced services with high‐quality data while a mobile gateway might not be able to perform the similar tasks. In general, the fixed gateway is more preferred in many healthcare applications such as remote health‐monitoring systems in the hospital and at home.
Each smart gateway in a fog layer is an embedded device that often consists of three main components such as hardware, an operating system, and software. Depending on specific health‐monitoring applications and sensor nodes, hardware can be various. For instance, a smart gateway's wireless communication chip is compatible with the wireless protocols (6LoWPAN, BLE, or Wi‐Fi) used by sensor nodes. In addition, the smart gateway often is equipped with Ethernet, Wi‐Fi, or 4G for connecting to cloud servers via the Internet. A smart gateway can be equipped with a hard drive or an SD card for storing data and installing an operating system. Although a storage capacity of the hard drive or an SD card is various, it is often not very large (e.g., less than 128 GB) [22].
Lightweight operating systems are often preferred in smart gateways because it does not require powerful hardware. For instance, lightweight versions of Linux kernels are used in many smart gateways [8, 15]. The operating system provides a platform for installing useful software easily and helps to manage tasks and hardware resources more efficiently and precisely.
Software in a smart gateway can consist of both basic programs and fog services. These programs and services are designed for serving particular applications' requirements such as latency, bandwidth, and interoperability. Basic programs provide fundamental features and functions of a gateway such as data transmission, gateway management, and some basic levels of security. For example, IPtable, which is a lightweight and simple software installed in Ubuntu, is used for blocking unused communication ports of the gateway. MySQL or MongoDB, which is an open‐source database, can be installed in the smart gateway for flexibly, reliably, and efficiently managing database.
Fog services can consist of many advanced services for augmenting the quality of healthcare service. The services can help to reduce the burden of sensors nodes for extending their battery lifetime, saving the network bandwidth, reducing the burden of cloud, and informing emergent cases in real time. For example, push notification for informing emergent is an important service of the fog. Detail of the fog services are explained in Section .
12.2.3 Cloud Servers and End‐User Terminals
In general, there is not much difference between the cloud of a remote health‐monitoring IoT systems having a fog layer and the cloud of other IoT applications without a fog layer (e.g., automation, education, and entertainment). They all provide the fundamental features and basic services of a cloud (e.g., data storage and data analysis) [23]. However, the burdens of the cloud in IoT systems with a fog are less than in the IoT applications without a fog. For instance, ECG feature extraction algorithms and machine‐learning algorithms can be processed at a fog while the rest of the processing can be run on a cloud. Merely, results from the processing are updated in both the fog's local storage and the cloud. Correspondingly, a large amount of transmitted data can be saved and the cloud's storage can be efficiently used. In general, a cloud of IoT systems with a fog is often customized for supporting the fog services. For example, in the IoT systems without a fog, cloud servers do not send data back to gateways. In most of the cases, cloud servers merely transmit commands and instructions to gateways, which are then forwarded to actuators. In addition to commands and instructions, cloud servers in IoT systems with a fog also transmit data to smart gateways for serving some of the fog services such as mobility support.
Similar to most of the conventional health‐monitoring IoT systems, Web browsers, and mobile applications are the primary terminals of the health‐monitoring IoT systems. These terminals are often ease‐to‐use, popular, and suitable for most of the devices including smart devices (e.g., smart phone, Ipad) and computers (e.g., laptop and desktop). End users can access real‐time data in human‐readable forms (e.g., text or graphical waveforms) via these terminals anytime and anywhere. In some health‐monitoring IoT systems, executable programs are used together with other terminals for accessing the monitored data. For example, for reducing the risks from security attacks, end users have to use a virtual private network (VPN) and virtual platforms in order to use executable programs installed in the hospital's system for accessing patient's data.
12.3 Fog Computing Services in Smart E‐Health Gateways
Fog computing services locating in a fog layer of smart gateways are diversified for serving IoT applications (e.g., healthcare, education, and autonomous industry). Fog services for healthcare are distinct for fulfilling strict requirements of latency and quality of data. In addition to the commonly used fog services such as push notification, local data storage, and data processing, fog services for healthcare can consist of security management, fault tolerance, categorization, localhost with a user interface and channel managing. These services are shown in Figure 12.2 and explained in detailed as follows.

Figure 12.2 Fog services in a smart gateway.
12.3.1 Local Database (Storage)
Depending on IoT applications, a fog's local storage can be structured differently. In general, a fog's local storage can be categorized into two primary databases: an external database and an internal database [15]. The external database is used for storing data and results that are transmitted to a cloud and can be accessed by end users. The structure and the format of data stored in the external database are diversified depending on the applications. For example, the internal database can store data in a standard format of Health Level Seven (HL7). The database is always synchronized with the cloud server's database. In general, biosignals and contextual data are stored in an external database. For example, heart rates of monitored patients during a time period are stored at an external database. End users such as medical doctors or caregivers can access the heart rate data of the patients by using terminals and the local network to connect a fog's local storage when the connection between smart gateways and cloud is interrupted during a short period of time. Depending on the system's requirements and smart gateways' specifications, the storage capacity of this database varies. In general, this database has a limited storage capacity. Therefore, after a time period, old data will be replaced by incoming data. For accessing the history of data, the cloud must be used. In contrast, the internal database is used for storing configuration parameters and various parameters used for algorithms and fog services. In most cases, this database is not synchronized with the cloud servers' databases except for the back‐up cases. Merely, the system and system administrators have authority to access the database.
12.3.2 Push Notification
The push notification service is one of the most important features of the fog services because it can inform abnormalities in real time. In conventional health‐monitoring IoT systems, the push notification is always implemented at a cloud for informing abnormal cases. This helps to reduce the burden of the gateways; however, responsible persons may not receive the push notification messages in real time to the network traffic. For example, it may take many seconds or up to a minute to receive a notification from a Google Firebase service during the heavy traffic period in developing countries such as Vietnam, Laos, and Cambodia. To avoid this situation, the push notification service should be applied in both fog and cloud.
12.3.3 Categorization
In most healthcare IoT systems, the systems send real‐time data and push messages via the cloud to responsible persons. As mentioned, the latency of the data and the push messages may be too high, as much as 30 to 60 seconds (s), in the case of heavy traffic. In the case that end users and monitored persons are in the same geographical location (hospital or home), the high latency issue can be avoided by applying the categorization service together with the fog‐based push notification service. The categorization service classifies connected devices for distinguishing local and external end‐users. In general, end users must use devices that are connected to the system by one of the protocols such as Ethernet, Wi‐Fi, or 4G/5G. The service scans the devices periodically (about 5 s). When it detects locally connected devices, it stores information of the devices in a local database. When a device requests real‐time data, the system checks the local database. If the device is currently connected to a local network, the real‐time data are directly sent to the device from smart gateways. If the device requests data history, data will be retrieved from the cloud. This service helps to dramatically diminish the latency of monitoring data because the transmission path is much shorter.
12.3.4 Local Host with User Interface
Local host with an easy‐to‐use user interface is required for providing real‐time monitoring data at smart gateways. Concisely, a local server hosts web pages that can show necessary data in both text and graphical forms in the easy‐to‐use interface. The web pages have a form for an end user to fill his/her username and password. When the form is submitted, the form's data are verified by comparing the credentials data stored in a local database. If they are matched, an end user is granted an access right. In the case that a password is incorrect after a few verification times, the username can be locked for a period of time (e.g., 10 minutes). For improving the security level, two‐step or three‐step verification (e.g., checking with an SMS message or a phone call) can be used.
12.3.5 Interoperability
In general, IoT systems are compatible with sensor nodes from different manufacturers and have different functionalities (e.g., collecting biosignals, obtaining contextual data, or controlling other electric devices). Therefore, interoperability of IoT systems primarily indicates the compatibility level of the systems toward various sensor nodes that use different wireless communication protocols. The interoperability level of an IoT system depends on the application's requirements. A health‐monitoring IoT system with a high level of interoperability can be applied to different applications and helps to save healthcare costs (e.g., system deployment and maintenance). For example, the IoT systems with interoperability can support both high‐quality multichannel ECG, EMG monitoring applications using Wi‐Fi, and energy‐efficient fall detection applications using 6LoWAN simultaneously. However, it is difficult to achieve a high level of interoperability in conventional IoT systems because of limitations on traditional gateways which merely receive and forward data. Fortunately, the target can be addressed successfully by an assistance of smart gateways and fog services. For instance, several components for supporting different wireless communication protocols such as Wi‐Fi, 6LoWPAN, Bluetooth, BLE, and nRF are integrated into a smart gateway whose fog services will handle the rest of the task. Concisely, the interoperability service operates with multithreading in which each thread is used for a single wireless communication protocol. These threads can communicate with each other to exchange data if required. Incoming coming data collected from each thread are stored in a local database.
12.3.6 Security
Security is an important issue, which healthcare IoT systems have to consider attentively. A single security weakness in the systems can be exploited and hacked by cybercriminals. Correspondingly, it can cause serious consequences, such as a loss of a patient's life or a loss of sensitive data. For example, an insulin pump device can be wirelessly hacked from 300 feet away. A researcher uses his software to steal the pump's security credential and control the pump [24]. In this case, if he increases a large amount of insulin pumped into a patient's blood, the patient life can be in danger. To avoid or reduce risks from cyberattacks, the whole health‐monitoring IoT system must be protected. In another word, each device, component (e.g., sensor nodes, gateways, and cloud servers) and communications between devices or components must be protected. In many health‐monitoring IoT systems, end‐to‐end security algorithms or methods protected from sensor devices to end users are applied [25, 26]. These methods can protect the system from wireless cyberattacks, which target the communications between sensor nodes and gateways and the communications between gateways and cloud servers. In many healthcare monitoring IoT systems, the communication between sensor nodes and gateways are often more vulnerable than the communications between gateways and cloud servers. This is because it is difficult or even impossible to implement complex security algorithms in sensor nodes due to latency requirements and resource constraints. Whereas, it is feasible to perform the algorithms at gateways and cloud servers without infringing the requirements. Fortunately, sensor nodes and their communications can be still protected by applying lightweight security algorithms such as Datagram Transport Layer Security (DTLS) based algorithms [27, 28]. In some health‐monitoring IoT applications, an advanced encryption standard (AES) is applied at both sensor nodes and gateways for protecting the transmitted data between them [15]. The risks of being attacked in health‐monitoring IoT systems with a fog are higher because many systems often allow end users to directly connect to smart gateways with a fog for assessing data. Therefore, it is required that fog services provide a high level of security for protecting the whole health‐monitoring system. In addition to end‐to‐end security methods, other advanced methods for protecting smart gateways are often used. For example, authentication checking and verification are used when an end user connects to a fog's local storage [15].
12.3.7 Human Fall Detection
Many algorithms (e.g., based on camera or motion) have been proposed for detecting a human fall [10, 13, 29, 30]. Algorithms based on a person's motions seem to be more popular and suitable for IoT systems because motion data can be collected easily anytime and anywhere by wearable wireless sensor nodes without interfering a monitored person's daily activities. Most motion‐based algorithms use data collected from a 3‐D accelerometer, a 3‐D gyroscope, or both [10, 13, 30]. Gia et al. [11] show that using both a 3‐D accelerometer and a 3‐D gyroscope provides more accurate fall detection results than a single sensor type, although the energy consumption of a sensor node slightly increases. Fall‐related parameters such as sum vector magnitude (SVM) and different SVM (DSVM) are often used as inputs for motion‐based fall detection algorithms (e.g., threshold‐based algorithms or a combination of threshold and hidden Markov model algorithms) [11, 30]. The fall‐related parameters are calculated via the formulas presented by equations 12.1, 12.2, and 12.3 [11, 30]. Note that equation 12.2 is not applied to data from a gyroscope sensor.

- SVM: Sum vector magnitude
- DSVM: Differential sum vector magnitude
- i: the sample order
- x, y, z: three‐dimensional values of accelerometer or gyroscope
- θ: The angle between the y‐axis and vertical direction
The changes of an SVM acceleration and an SVM angular velocity during a fall are shown in Figure 12.3. When a person stands still or sits still, an SVM acceleration and an SVM angular velocity is 1 g and 0 deg/s, respectively. When the person falls, an SVM acceleration and an SVM angular velocity change dramatically.

Figure 12.3 Acceleration and angular velocity changes during a fall.
In this chapter, a multilevel threshold algorithm, shown in Figure 12.4, is applied. The algorithm is simple and easy to implement, while it provides a level high of precision. First, data are filtered for removing noise and interference from surrounding environments. Then they are used for calculating the fall‐related parameters (e.g., SVM of 3‐D acceleration and 3‐D angular velocity). The SVM values of both acceleration and gyroscope are compared with the first threshold. If both of them are higher than their first threshold, they are compared with the second threshold. If they are larger than their second threshold, a fall case is detected. The push notification service is triggered to report the case. When one of them is higher than its first threshold (e.g., 1.5 g for acceleration and 130 deg/s for angular velocity), the possible fall case is defined and the value is marked. In this case, the system compares the marked value with 20 previous values. If the result shows the pattern of a fall case illustrated in Figure 12.3, a fall case is triggered. In addition to sending a push notification message, an alarm message is sent to the system administrators to report that one of the sensors does not properly work.

Figure 12.4 Multilevel threshold based fall detection algorithm.
12.3.8 Fault Detection
Fault detection is a very important service of a fog because it helps to avoid a long interruption of fog services. The fault detection service is responsible for detecting abnormality related to sensor nodes and smart gateways. When a smart gateway does not receive any data from a specific sensor node during a short period of time (e.g., 5 s to 10 s), the fault detection service sends predefined commands or instructions to the node. If the node does not reply to the smart gateway after several commands are sent, the fault detection service triggers a push notification service for informing the system's administrators. A similar mechanism is applied for detecting nonfunctional gateways. The gateway periodically sends predefined multicast messages to neighbor gateways and waits for the replies. If the gateway does not receive any reply from its neighbors after some periods of time and a couple of messages, it triggers the push notification service. In case only a single gateway is used in the system, the fault detection service for detecting dysfunctional gateways can be implemented at the cloud and the similar mechanism is applied.
12.3.9 Data Analysis
The raw data captured from sensors need to be processed and analyzed into information for disease diagnosis and health monitoring. However, sensor nodes usually have limited computing power to manage all the tasks such as digitalization, communicating with wireless data transmission modules, signal processing, and data analysis. The processing is even more challenging for a node integrating multiple sensors with a high data rate that requires instant data transmission or local data storage. Comparatively, fog computing in an IoT system has stronger computing power than the energy‐efficient microprocessors in a sensor node, which can provide application customized data analysis and timely feedback to end users.
Data analysis methods are signal‐dependent and application‐dependent. However, the data analysis procedure usually contains data preprocessing and feature extraction. The extracted features are the data for statistical analysis or machine learning methods.
12.4 System Implementation
A complete remote real‐time health‐monitoring IoT system with fog services is built. The system consists of several wearable sensor nodes, smart gateways with fog services, cloud servers, and terminals. Detailed implementations of these components are discussed as follows.
12.4.1 Sensor Node Implementation
Two types of sensor nodes, including wearable sensor nodes and static sensor nodes, are implemented. Wearable sensor nodes are used for collecting ECG, body temperate, and body motion, while static sensor nodes are placed in a room for monitoring room temperature and humidity. Although several communication protocols such as Wi‐Fi, nRF, Bluetooth, and 6LoWPAN are used in our experiments, only the implementation of sensor nodes based on nRF is described in detail in this chapter. The implementation of other sensor nodes based on Wi‐Fi, Bluetooth, and 6LoWPAN are carefully discussed in our other works [6, 7, 13, 19].
As mentioned, each sensor node has three primary components consisting of a microcontroller, sensors, and a wireless communication chip. According to Gia et al. [11], an 8‐bit microcontroller is more suitable than a 32‐bit microcontroller for such an IoT sensor node that does not perform heavy computational tasks. In the implementation, a low‐power 8 MHz Atmega328P is used because the micro‐controller consumes low energy during an active mode, and it provides several sleep modes for saving energy. In our experiments, the micro‐controller is in a deep sleep all the time except for when it is receiving data from sensors and transmitting the data to smart gateways. In several experiments, the micro‐controller is active for performing encryption methods (e.g., AES). Although the micro‐controller supports up to 20 MHz with an external oscillator, 8 MHz is one of the most suitable frequencies for the sensor node. For running at 16 MHz and 20 MHz, the micro‐controller needs 5 V supply, while it requires 3 V for running at 8 MHz. According to Gia et al. [11], the micro‐controller aims to communicate with sensors via 1 MHz SPI since SPI is more energy efficient than other wirer protocols such as I2C and UART [11].
For collecting ECG, an analog front‐end ADS1292 component is used. ADS1292 can collect high‐quality ECG with two channels. Each channel supports up to 8000 samples/s where each sample is 24 bits. ADS1292 consumes low energy and communicates with the micro‐controller via SPI. In the experiments, 125 samples/s two‐channel ECG are obtained via 1 MHz SPI.
MPU9250, which is a nine‐axis motion sensor consisting of a 3‐D accelerometer, a 3‐D gyroscope and a 3‐D magnetometer, is used for collecting acceleration and angular velocity. The sensor can operate with 3 V power supply, and it consumes low energy. The sensor can connect with the microcontroller via SPI. In the experiments, 100 samples from the 3‐D accelerometer and 100 samples from the 3‐D gyroscope are acquired every second via 1 MHz SPI.
BME280 is used in different sensor nodes for collecting a body temperature and a room temperature because BME280 consumes low energy [31]. BME280 can operate with 3V power supply, and it can connect with the micro‐controller via SPI. Each temperature data sample from a monitor person is collected every 10 s because a body temperature does not change quickly. Similarly, a room temperature is obtained and transmitted in every minute for saving sensor nodes' energy consumption.
In our implementation, nRF is used because of its advantages in low energy consumption, M2M communications, and flexible bandwidth support. For example, its peak power per transmission is less than 50 mW and a time period of each transmission is about 2 ms [11]. A nRF24L01 chip is used in sensor nodes. The chip can operate with 3 V and connects to the micro‐controller via SPI.
12.4.2 Smart Gateways with Fog Implementation
Smart gateways are built based on a combination of several devices and components such as Pandaboard, HC05 Bluetooth, nRF24L01, and Smart‐RF06 board with TI CC2538cc25. Pandaboard is the core of a smart gateway and fog services since all fog services are installed and run on top of Pandaboard. Pandaboard has a dual‐core 1.2 GHz ARM Cortex‐A9, 304 MHz GPU, 1 GB of RAM. In addition, Pandaboard supports different protocols such as Wi‐Fi, Ethernet, SPI, I2C, and UART. In the implementation, Ethernet is used for connecting to the Internet, while Wi‐Fi is used for receiving data from sensor nodes that use Wi‐Fi as the main protocol for transmitting high‐quality signals. Furthermore, Pandaboard supports up to 32GB SD card for installing an embedded operating system. In the implementation, a lightweight embedded operating system based on a Linux kernel is used.
HC05 is a low‐cost Bluetooth chip that supports master and slave modes. HC05 can be connected to Pandaboard via UART. A driver is not required when setting up HC05 in Pandaboard.
A nRF24L01 chip integrated into the gateway is the same nRF24L01 chip used in sensor nodes. It is also connected to Pandaboard via SPI. With nRF, Pandaboard can receive data from different sensor nodes simultaneously.
A Smart‐RF06 board with TI CC2538 provides a capability of communication with 6LoWPAN. A TI CC2538 chip is placed on top of the Smart‐RF06 board, which is connected to Pandaboard via Ethernet. In the implementation, a USB to Ethernet adapter is used for providing an extra Ethernet port for Pandaboard.
The local database is implemented by MongoDB, which is an open source database using document‐oriented data model. For instance, in addition to biosignals and contextual data, username, password, and other important information are also stored in the local database.
AES‐256 (Standard) and IPtables [32] are applied in smart gateways for providing some levels of security. AES‐256 is a symmetric block cipher for protecting transmitted data. Biosignals are encrypted at sensor nodes and the encrypted data are decrypted at the smart gateways for storing and processing. IPtables is a type of firewall that contains many rules for the treatment of packets (e.g., allow or block traffic). IPtables checks all rules when trying to establish a connection to smart gateways. If the rules are not fulfilled, it performs the predefined actions. For proffering the higher security level, our advanced and complex security algorithms [25, 26, 28], which are suitable for smart gateways with fog computing, can be customized and applied in the system.
The fall detection algorithm based on the multilevel threshold discussed above is applied in the system. In the fall detection application, most of the noises come from motion artifacts and power‐line noise from surrounding environments. In the experiment, 100 Hz motion data are collected from both accelerometer and gyroscope. Therefore, a second order 10–40 Hz band pass filter is used. The parameters of the filter can be different, depending on application requirements.
The filtered data, including both acceleration and angular velocity, are compared with several predefined thresholds. In the experiments, 1.6 g and 1.9 g are the first and second threshold for acceleration, while 130 deg/s and 160 deg/s are the first and the second threshold for angular velocity.
In addition, these fall‐related values can be used for categorizing the activity status of a monitored person (e.g., static activity, moving activity or sleeping). In the experiments, status activities of all cases are detected successfully by a simple algorithm which counts the number of ripples whose magnitude is in between predefined ranges (e.g., 0–100 deg/s and 0.5–1.5 g). For example, the first case in Figure 12.5 is categorized into three periods, including a static (e.g., sit still or stand still) period, a falling period, and a period of standing up after a fall.
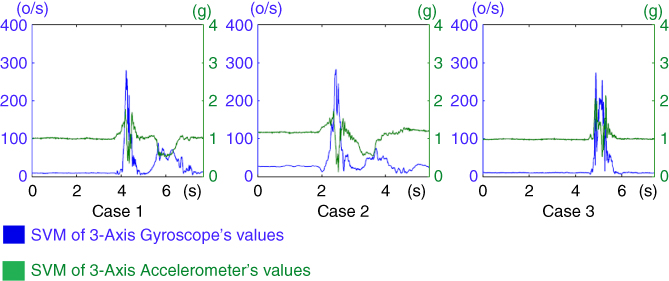
Figure 12.5 SVM of 3‐D acceleration and SVM of 3‐D angular velocity.
The categorization service is implemented at the fog with an assistance of the “iw, iwlist” packages, which are built for Linux kernel‐based operating systems. Via the scanning methods from these packages, all necessary information (e.g., MAC address, SSID, and RSSI) of Wi‐Fi devices connected to smart gateways can be easily obtained. Smart gateways scan the information regularly and update the local database. Although these packages are not fully developed, they are still suitable for the categorization service.
Data processing in the fog includes simple filtering and advanced processing algorithms. In our implementation, a 50 Hz filter is applied in Python for removing noise and interference from surrounding environments. Depending on particular countries, a 50 Hz or 60 Hz filter can be applied. For example, a 50 Hz notch Butterworth filter should be applied in Nordic countries, while a 60 Hz filter should be applied in American countries. Then the filtered data are applied with several algorithms (e.g., heart rate extraction algorithm) for detecting R peaks, R‐R intervals, or U waves. These algorithms are implemented in Python.
12.4.3 Cloud Servers and Terminals
In the implementation, Google Cloud and its API are used. For instance, Google Cloud dataflow and Firebase are used. Cloud Dataflow is service for enriching real‐time data and the history of data, while Firebase is used for push notification. The global database in the cloud is configured to have the same structure as the fog local database for achieving an easy synchronization between these databases. Different services of Google API can be used, depending on health‐monitoring applications. Cloud servers host a webpage having an easy‐to‐use interface. The webpage is built based on up‐to‐date technologies such as Python, HTML5, CSS, XML, JavaScript, and JSON. Similar to the fog's webpage, the global webpage also has a form having username and password. By using an Internet browser, an end‐user having valid credentials can connect to the webpage and access the monitored data in real time. The level of credentials depends on specific users. In addition, end users can use a mobile application to monitor real‐time data. Similar to the webpage, the mobile app has a form consisting of a username plus a password to log in and uses the same mechanism to check the credentials. The app can show data in both text and graphical forms. Currently, the app is merely built for Android phones. In the future, another version of the mobile app will be built for IOS.
12.5 Case Studies, Experimental Results, and Evaluation
This chapter presents cases study of remote ECG monitoring together with fall detection in real time. Details of each case are discussed as follows.
12.5.1 A Case Study of Human Fall Detection
For evaluating a fall‐detection feature, six volunteers, including healthy males and females whose age is about 24–32 years old, participate in the experiments organized in a lab room. Each wearable sensor node is attached to a volunteer's chest for collecting body temperature, ECG, and body motions for 4–5 hours. The collected data is wirelessly transmitted to smart gateways with a fog. In the experiments, the energy consumption of the sensor is measured in different configurations. In one configuration, data are kept intact before being sent to the gateway while data are encrypted in another configuration. At smart gateways with the fog, data are processed with advanced algorithms for detecting a human fall, analyzing ECG, and evaluating heart variability. In addition, many advanced fog services are provided for improving the quality of services. Then the data are transmitted to cloud servers, which can show analyzed and processed data in text and graphical forms.
In the experiment, each volunteer is asked to do his or her normal activities (e.g., standing still, sit still, and walking) and suddenly fall into a mattress. Each volunteer repeats his/her activities five times. The motion data acquired by sensor nodes are transmitted to a smart gateway with the fog. The real‐time acceleration and angular velocity collected from three volunteers simultaneously are shown in Figure 12.5. The data is retrieved from the fog's webpage. It can be easily seen that acceleration and angular velocity are stable in the first time period (e.g., 0–4 s in the first case) and changes dramatically in the second period (e.g., 4–6 s in the first case). The data indicates that in the first case, a person falls at 4s. Similarly, the second and third persons fall at 2.3 s and 4.5 s, respectively. These collected data are processed at fog with the fall algorithm shown in Figure 12.4 for detecting fall cases. In the experiments, all fall cases are detected successfully.
In the experiments, energy consumption of sensor nodes is measured by a MonSoon professional power monitoring tool. The total energy consumption is calculated by the following formula.
- where: Average Poweractive = Vsupply * Average Iactive
- Poweridle = Vsupply * Iidle
- Timeidle = Total measurement time − Timeactive
The energy consumption of sensor nodes is measured during 1 s. Results are shown in Table 12.1. Results show that running AES encryption in sensor node only causes a slight increase of energy consumption about 2.2 mWs. By using the 1000 mWh battery, the sensor node can be used up to 45 hours.
Table 12.1 Energy consumption of the sensor node with and without running AES.
| Mode | Energy consumption (mWs) |
| Idle (without AES) | 1.26 |
| Active without AES | 5.94 |
| Total energy without AES | 7.2 |
| Idle (with AES) | 1.044 |
| Active with AES | 8.71 |
| Total energy with AES | 9.754 |
12.5.2 A Case Study of Heart Rate Variability
As introduced above, ECG signals can be captured either by a wearable sensor device or by a professional monitoring machine in multiple leads. The raw ECG signal in Figure 12.6 is 1‐lead ECG and was measured from a wearable device. In the preprocessing phase, moving average filter was first applied to remove the baseline wander of the signal, and then a 50 Hz notch filter was applied to remove power‐line interference. In this pain assessment application, R wave is of interest in the analysis; therefore, R peaks were detected with a peak detection algorithm and R to R intervals were calculated from every two adjacent R peaks for heart rate variability analysis.

Figure 12.6 Real‐time ECG monitoring and preprocess ECG data at fog.
In pain assessment research, heart rate variability has been studied as a potential automatic parameter to quantify pain experience [33–35]. Heart rate variability (HRV) analysis is built on the extraction of R‐R interval shown in Figure 12.6, which is usually denoted as N‐N, meaning normal sinus to normal sinus. HRV can be analyzed in the time domain, frequency domain, or with nonlinear methods [36]. HRV features are extracted from time windows in a certain length, which may vary in different applications and for different purposes. In addition to pain assessment, HRV analysis is also widely applied in disease diagnoses such as cardiac arrhythmia and clinical studies such as sleep analysis. Long‐term HRV analysis is usually processed.
every 24 hours; short‐term HRV analysis is processed in time windows of several minutes; there is also ultra‐short‐term analysis in time windows that are shorter than 1 minute. Some commonly seen HRV features in the time domain analysis are:
- AVNN: an average of NN intervals
- SDNN: a standard deviation of NN intervals
- RMSSD: a root mean square of differences between adjacent NN intervals
- pNNx: a percentage of differences between adjacent NN intervals that are larger than x milliseconds
Some HRV features in the frequency domain are:
- LF: low‐frequency component, the cumulative sum of the spectral power between 0.01 Hz and 0.15 Hz
- HF: high‐frequency component, the cumulative sum of the spectral power between 0.15 Hz and 0.4 Hz
- LF/HF: the ratio of low‐frequency component to high‐frequency component
The nonlinear methods in HRV analysis include correlation dimension analysis, detrended fluctuation analysis, and entropy analysis, for example.
In pain monitoring, ultra‐short‐term and short‐term HRV features are extracted from the real‐time monitoring of ECG signals, indexing the activity of the autonomic nervous system. In a health‐monitoring system, the ECG waveforms captured by a wearable sensor node (e.g., bioharness sensor) can then be analyzed in terms of HRV features and can be classified into a pain intensity in the system's fog layer. The classifier for pain intensity recognition is first trained and tested with a pain database.
The Internet of things for healthcare research group at the University of Turku built such a database from 15 healthy female and 15 healthy male volunteers under experimental pain stimulation. Each subject experienced four successive tests on the same day. In two of the tests, the pain stimulation was heat on a forearm, which was produced by a round heating element with a diameter of 3 cm. The heating element was placed on the left or right forearm when its temperature was 30 °C and first increased 1 °C every 3 seconds before 45 °C. After 45 °C, its temperature increased 1 °C every 5 seconds and the active heating stopped at 52 °C. In the rest two tests, the pain stimulation was electrical pulses with a width of 250 μs repeating at a frequency of 100 Hz. The pulses were generated by a commercial TENS device and the electrodes were placed on the left or right ring finger. The pulse intensity was controlled by a researcher that increased 1 in every 3 seconds with a maximum level of 50. The order of the four tests was randomized. In each test, each subject was able to report the time point when he or she reached his or her pain threshold and then pain tolerance. The pain stimulation was then removed from the subject either when the pain tolerance was reported or the stimulation had reached its maximum intensity. The subjective pain intensity was self‐reported at the end of each test in the VAS score.
The No pain data was defined as the data from 30 s before the start of the test. The data between start and pain threshold was labeled as Mild pain and the data between pain threshold and pain tolerance was labeled as Moderate/Severe pain because the self‐reported pain score differs among subjects. The changes of some HRV features along with the test are presented as the root mean square (RMS) of the feature in each pain category, as shown in Figure 12.7. To explore the influence of the time window choice on the pattern, HRV features extracted from time windows between 10 s to 60 s are presented. To reduce the impact of different resting heart rate on the HRV analysis [37], NN intervals were normalized by the reference to AVNN. Moreover, to adjust the feature distribution into a normal distribution, some features were logarithmically transformed with natural logarithm and ln was added in their names.

Figure 12.7 RMS of HRV features in different window lengths and different pain intensities.
The classification was then conducted between No pain and Pain, where Pain is a merge of the other two categories. Support vector machine classifiers were trained and tested in 10‐fold cross‐validation with the HRV features in Figure 12.7. The ROC curves of the classifications in each time window length are presented in Figure 12.8. The AUC values show that the classification of HRV features had better performance in a larger time window length.

12.6 Discussion of Connected Components
Fog computing shows its capability to reduce heavy computational loads of sensor nodes by switching the loads to fog‐assisted smart gateways. Accordingly, sensor nodes can be used for a longer time per charge. Depending on the specific applications, the fog's role becomes more or less important in terms of increasing energy efficiency. For example, fog is important in real‐time monitoring applications using complex algorithms (e.g., real‐time multichannel ECG monitoring with ECG feature extraction) while fog does not dramatically increase the lifetime of sensor nodes in simple monitoring applications (e.g., temperature monitoring). With a fog, a high level of the energy efficiently of the entire system cannot be achieved. To address the target, all components of the system from sensor nodes, smart gateways, to enduser terminals must be carefully considered.
12.7 Related Applications in Fog Computing
Many IoT systems for healthcare have been proposing [38–40]. However, these conventional IoT systems still have several limitations, such as nonsupport interoperability, energy inefficiency, nonsupport distributed local storage, or inefficient utilization of bandwidth. Recently, several fog‐based solutions have been proposed for enhancing existing healthcare IoT systems. Gia et al. [18] present a fog‐based approach for ECG feature extraction. The approach extracts heart rate, P wave, T wave, from ECG signals. In addition, it helps to save about 90% bandwidth. Azimi et al. [41] present hierarchical fog‐assisted computing architecture for healthcare IoT. The approach can detect arrhythmia by algorithms implemented in both fog‐assisted smart gateways and cloud servers. Moosavi et al. [25] present an end‐to‐end security approach based on fog computing for health IoT systems. The approach provides a high level of security even though sensor nodes randomly moves from a gateway to another gateway. Rahmani et al. [22] propose a fog‐based approach for enhancing healthcare monitoring IoT systems. By using the fog‐based smart gateway, the proposed system provides distributed local storage, data fusion, data analysis at smart gateways. Bimschas et al. [42] propose a middleware at smart gateways with a fog layer. The approach provides some levels of interoperability supporting multi‐communications between standard and non‐standard protocol applications. Similarly, Shi et al. [43] present a fog‐based approach for intercommunicating between different wireless protocols such as ZigBee, WiFi, 2G/3G/4G, WiMax, and 6LoWPAN. In addition, the approach provides some levels of self‐decision‐making for selecting a suitable format before sending both raw and processed data to cloud servers. Cao et al. [44] present the fog‐based approach for fall detection systems. The approach analyzes and detects a human fall in real time by splitting the detection task between the edge devices. Similarly, Gia et al. [10] and Igor et al. [13] present the fog‐based approaches for real‐time fall detection. These approaches analyze motion data such as 3‐D acceleration and 3‐D angular velocity at smart gateways. When the collected data trespasses pre‐defined threshold, push notification messages are sent to responsible persons in real time. In [45], authors present a fog computing system for monitoring mild dementia and COPD patients. Collected data are processed at the fog for reducing the communications overload and protecting a patient's privacy.
12.8 Future Research Directions
Fog computing with many advanced services has proven an important role in improving the quality of healthcare services. However, the fog services can be augmented to achieve the outstanding quality of healthcare service. For example, data analysis and data fusion can be enhanced for improving the quality of disease diagnosis (i.e. avoiding incorrect disease diagnoses). Instead of applying conventional methods using predefined thresholds, these fog services will use machine learning such as deep learning or reinforcement learning to achieve more accurate results. For instance, fixed thresholds in fall detection algorithms will become self‐adaptive for suiting to particular situations such as irregular movements or dancing. In addition, machine learning helps to deploy artificial intelligence (AI) at a fog easier. The fog‐based system with AI helps to improve decision‐making significantly for correct and smart reactions in real time. Future health‐monitoring systems may be able to provide diverse applications by applying different analysis methods to the same physiological signals, which will meet the demand of different people with more precise services. For example, in addition to pain monitoring, HRV analysis is also useful in reflecting current diseases, indicating cardiac issues, and reflecting depression or stress.
12.9 Conclusions
This chapter primarily presented fog computing in health‐monitoring IoT systems. Fog provides advanced services consisting of distributed local storage, push notification, human fall detection, data analysis, security, localhost with a user interface, and fault detection. These services play important roles in improving healthcare services. With these services, a patient's health status is always continuously and remotely monitored by responsible persons while his or her daily activities are not interrupted. Cases studies consisting of human fall detection and heart rate variability demonstrated the benefits of the fog and its services. These services process and analyze data in real time. When some abnormalities occur (e.g., a fall), the push notification service is triggered to inform responsible persons such as medical doctors and caregivers in real time for in‐time reactions. Furthermore, fog computing and its services address challenges in healthcare IoT. For example, fog helps to improve the energy efficiency of sensor nodes by switching heavy computational loads to smart gateways. Fog is capable of detecting system faults (e.g., hardware and software faults) and informing system administrators in real time. Fog not only facilitates advanced services but also reduces the burden of a cloud. Fog computing demonstrated that it is one of the most suitable candidates for augmenting IoT systems in healthcare and other domains.
References
- 1 Summary Health Statistics: National Health Interview Survey 2017, National Center for Health Statistics, 2017.
- 2 National diabetes statistics report: Estimates of diabetes and its burden in the United States, Centers for Disease Control and Prevention, Atlanta, 2014.
- 3 E.J. Benjamin, M.J. Blaha, and S.E. Chiuve, et al. Heart disease and stroke statistics, American Heart Association. Circulation , 135(10): e146–e603, 2017.
- 4 D.A. Sterling, J.A. O'Connor, J. Bonadies. Geriatric falls: injury severity is high and disproportionate to mechanism. Journal of Trauma and Acute Care Surgery 50(1): 116–119, 2001.
- 5 J.A. Stevens, P.S. Corso, E.A. Finkelstein, T. R Miller. The costs of fatal and nonfatal falls among older adults. Injury Prevention , 12(5): 290–295, 2006.
- 6 T.N. Gia, N.K. Thanigaivelan, A.M. Rahmani, T. Westerlund, P. Liljeberg, and H. Tenhunen. Customizing 6LoWPAN Networks towards Internet‐of‐Things Based Ubiquitous Healthcare Systems. In Proceedings of 32nd IEEE NORCHIP, 2014.
- 7 T.N. Gia, A.M. Rahmani, T. Westerlund, T. Westerlund, P. Liljeberg, and H. Tenhunen. Fault tolerant and scalable iot‐based architecture for health monitoring. In Proceedings of IEEE Sensors Applications Symposium, 2015.
- 8 A.M. Rahmani, N.K. Thanigaivelan, T.N. Gia, J. Granados, B. Negash, P. Liljeberg, and H. Tenhunen. Smart e‐health gateway: bringing intelligence to Internet‐of‐Things based ubiquitous healthcare systems. In Proceedings of 12th Annual IEEE Consumer Communications and Networking Conference, 2015.
- 9 V.K. Sarker, M. Jiang, T.N. Gia, M. Jiang, T.N. Gia, A. Anzanpour, A.M. Rahmani, P. Liljeberg. Portable multipurpose biosignal acquisition and wireless streaming device for wearables. In Proceedings of IEEE Sensors Applications Symposium, 2017.
- 10 T.N. Gia, I. Tcarenko, V.K. Sarker, A.M. Rahmani, T. Westerlund, P. Liljeberg, and H. Tenhunen. IoT‐based fall detection system with energy efficient sensor nodes. In Proceedings of IEEE Nordic Circuits and Systems Conference, 2016.
- 11 T.N. Gia, V.K. Sarker, I. Tcarenko, A.M. Rahmani, T. Westerlund, P. Liljeberg, and H. Tenhunen. Energy efficient wearable sensor node for IoT‐based fall detection systems. Microprocessors and Microsystems, Elsevier, 2018.
- 12 M. Jiang, T.N. Gia, A. Anzanpour, A.M. Rahmani, T. Westerlund, S. Salanterä, P. Liljeberg, and H. Tenhunen. IoT‐based remote facial expression monitoring system with sEMG signal. In Proceedings of IEEE Sensors Applications Symposium, 2016.
- 13 I. Tcarenko, T.N. Gia, A.M. Rahmani, T. Westerlund, P. Liljeberg, and H. Tenhunen. Energy‐efficient IoT‐enabled fall detection system with messenger‐based notification. In Proceedings of 6th International Conference on Wireless Mobile Communication and Healthcare, Springer, 2017.
- 14 F. Touati and T. Rohan. U‐healthcare system: State‐of‐the‐art review and challenges, Journal of medical systems 37 (3) (2013).
- 15 T.N. Gia, M. Jiang, V.K. Sarker, A.M. Rahmani, T. Westerlund, P. Liljeberg, and H. Tenhunen. Low‐cost fog‐assisted health‐care IoT system with energy‐efficient sensor nodes. In Proceedings of 13th IEEE International Wireless Communications & Mobile Computing Conference, 2017.
- 16 B. Negash, T.N. Gia, A. Anzanpour, I. Azimi, M. Jiang, T. Westerlund, A.M. Rahmani, P. Liljeberg, and H. Tenhunen. Leveraging Fog Computing for Healthcare IoT, Fog Computing in the Internet of Things, A. M. Rahmani, et al. (eds), ISBN: 978‐3‐319‐57638‐1, Springer, 2018, pp. 145–169.
- 17 T.N. Gia, M. Ali, I.B. Dhaou, A.M. Rahmani, T. Westerlund, P. Liljeberg, and H. Tenhunen. IoT‐based continuous glucose monitoring system: A feasibility study, Procedia Computer Science , 109: 327–334, 2017.
- 18 T.N. Gia, M. Jiang, A.M. Rahmani, T. Westerlund, P. Liljeberg, and H. Tenhunen. Fog computing in healthcare Internet‐of‐Things: A case study on ECG feature extraction. In Proceedings of 15th IEEE International Conference on Computer and Information Technology, 2015.
- 19 T.N. Gia, M. Jiang, A.M. Rahmani, T. Westerlund, K. Mankodiya, P. Liljeberg, and H. Tenhunen. Fog computing in body sensor networks: an energy efficient approach. In Proceedings of IEEE 12th International Conference on Wearable and Implantable Body Sensor Networks, 2015.
- 20 F. Bonomi, R. Milito, J. Zhu, S. Addepalli. Fog computing and its role in the Internet of Things. In Proceedings of 1st ACM MCC Workshop on Mobile Cloud Computing, 2012.
- 21 M. Peng, T. Wang, G. Hu, and H. Zhang. A wearable heart rate belt for ambulant ECG monitoring. In Proceedings of IEEE International Conference on E‐health Networking , Application & Services, 2012.
- 22 A.M. Rahmani, T.N. Gia, B. Negash, A. Anzanpour, I. Azimi, M. Jiang, and P. Liljeberg. Exploiting smart e‐health gateways at the edge of healthcare internet‐of‐things: a fog computing approach, Future Generation Computer Systems, 78(2) (January): 641–658, 2018.
- 23 M. Armbrust, A. Fox, R. Griffith, A.D. Joseph, R. Katz, A. Konwinski, G. Lee, D. Paterson, A. Rabkin, I. Stoica, and M. Zaharia. A view of cloud computing. Communications of the ACM, 53(4) (April): 50–58, 2010.
- 24 D. C. Klonoff. Cybersecurity for connected diabetes devices. Journal of Diabetes Science and Technology , 9(5): 1143–1147, 2015.
- 25 S. R. Moosavi, T.N. Gia, E. Nigussie, et al. End‐to‐end security scheme for mobility enabled healthcare Internet of Things. Future Generation Computer Systems , 64 (November): 108–124, 2016.
- 26 S.R. Moosavi, T.N. Gia, E. Nigussie, A.M. Rahmani, S. Virtanen, H. Tenhunen, and J. Isoaho. Session resumption‐based end‐to‐end security for healthcare Internet‐of‐Things. In Proceedings of 15th IEEE International Conference on Computer and Information Technology, 2015.
- 27 T. Kothmayr, C. Schmitt, W. Hu, M. Brünig, and G. Carle. DTLS based security and two‐way authentication for the Internet of Things, Ad Hoc Networks , 11(8): 2710–2723, 2013.
- 28 S. R. Moosavi, T.N. Gia, A.M. Rahmani, S. Virtanen, H. Tenhunen, and J. Isoaho. SEA: A secure and efficient authentication and authorization architecture for IoT‐based healthcare using smart gateways. Procedia Computer Science , 52: 452–459, 2015.
- 29 Z.‐P. Bian, J. Hou, L.P. Chau, N. Magnenat‐Thalmann. Fall detection based on body part tracking using a depth camera, IEEE Journal of Biomedical and Health Informatics , 19(2): 430–439, 2015.
- 30 D. Lim, C. Park, N.H. Kim, and Y.S. Yu. Fall‐detection algorithm using 3‐axis acceleration: combination with simple threshold and hidden Markov model. Journal of Applied Mathematics, 2014.
- 31 M. Ali, T.N. Gia, A.E. Taha, A.M. Rahmani, T. Westerlund, P. Liljeberg, and H. Tenhunen. Autonomous patient/home health monitoring powered by energy harvesting. In Proceedings of IEEE Global Communications Conference, Singapore, 2017.
- 32 R. Russell. Linux iptables HOWTO, url: http://netfilter.samba.org, Accessed: December 2018.
- 33 A.J. Hautala, J. Karppinen, and T. Seppanen. Short‐term assessment of autonomic nervous system as a potential tool to quantify pain experience. In Proceedings of 38th Annual International Conference of the IEEE Engineering in Medicine and Biology Society, 2684–2687, 2016.
- 34 J. Koenig, M.N. Jarczok, R.J. Ellis, T.K. Hillecke, and J.F. Thayer. Heart rate variability and experimentally induced pain in healthy adults: a systematic review European Journal of Pain, 18(3): 301–314, 2014.
- 35 M. Jiang, R. Mieronkkoski, A.M. Rahmani, N. Hagelberg, S. Salantera, and P. Liljeberg. Ultra‐short‐term analysis of heart rate variability for real‐time acute pain monitoring with wearable electronics. In Proceedings of IEEE International Conference on Bioinformatics and Biomedicine, 2017.
- 36 U.R. Acharya, K.P. Joseph, N. Kannathal, C.M. Lim, and J.S. Suri. Heart rate variability: a review. Medical & Biological Engineering & Computing , 44(12): 1031–1051, 2006.
- 37 J. Sacha. Why should one normalize heart rate variability with respect to average heart rate. Front. Physiol , 4, 2013.
- 38 G. Yang, L. Xie, M. Mantysalo, X. Zhou, Z. Pang, L.D. Xu, S. Kao‐Walter, and L.‐R. Zheng. A health‐iot platform based on the integration of intelligent packaging, unobtrusive bio‐sensor, and intelligent medicine box. IEEE transactions on industrial informatics , 10(4): 2180–2191, 2014.
- 39 M.Y. Wu and W.Y. Huang. Health care platform with safety monitoring for long‐term care institutions. In Proceedings of 7th International Conference on Networked Computing and Advanced Information Management, 2011.
- 40 H. Tsirbas, K. Giokas, and D. Koutsouris. Internet of Things, an RFID‐IPv6 scenario in a healthcare environment. In Proceedings of 12th Mediterranean Conference on Medical and Biological Engineering and Computing, Berlin, 2010.
- 41 I. Azimi, A. Anzanpour, A.M. Rahmani, T. Pahikkala, M Levorato, P. Liljeberg, and N. Dutt. HiCH: Hierarchical fog‐assisted computing architecture for healthcare IoT. ACM Transactions on Embedded Computing Systems, 16(5), 2017.
- 42 D. Bimschas, H. Hellbrück, R. Meitz, D. Pfisterer, K. Römer, and T. Teubler. Middleware for smart gateways. In Proceedings of 5th International workshop on Middleware Tools, Services and Run‐Time Support for Sensor Networks, 2010.
- 43 Y. Shi, G. Ding, H. Wang, H.E. Roman, S. Lu. The fog computing service for healthcare. In Proceedings of 2nd International Symposium on Future Information and Communication Technologies for Ubiquitous HealthCare, 2015.
- 44 Y. Cao, S. Chen, P. Hou, and D. Brown. FAST: A fog computing assisted distributed analytics system to monitor fall for stroke mitigation. In Proceedings of 10th International Conference on Networking, Architecture, and Storage, 2015.
- 45 O. Fratu, C. Pena, R. Craciunescu, and S. Halunga. Fog computing system for monitoring mild dementia and COPD patients – Romanian case study. In Proceedings of 12th International Conference Telecommunications in Modern Satellite, Cable and Broadcasting Service, 2015.