
ISO 50001 as Certified Management System
The International Organization for Standardization (ISO) issues a large number of mostly technical standards with a global reach. In the 1980s, ISO expanded its scope to include management systems and their certification, mainly concentrating on quality, environment, energy, and greenhouse gases (GHGs). ISO prescribes which elements an organization has to implement, for example, procedures to measure the quality of products, indicators to alert if environmental regulation could be violated, or targets to improve energy performance. To confirm that all elements of the respective ISO standard are implemented adequately, a third-party company conducts an audit and grants a certificate. Thus, stakeholders of the organization may be sure that the management system performs. This section helps to convey how ISO certification works in detail and explains the specifics of energy management systems (EnMS).
Definition of Energy
Unfortunately, a simple definition for energy is not possible, because the term has many diverse meanings. So let us try to avoid confusion by beginning with the definition from physics: Energy can be defined as the capacity of a system to produce external activity or perform work (ISO 50001:2011, 2). This means, for example, that a car with a filled tank can drive for hundreds of miles. This book will expand on the definition from natural sciences to include aspects relevant to the accounting function and general management of a firm. In business life, energy is used to convey a variety of distinct meanings: We have to energize our sales means to put (financial) resources into marketing. An energetic person refers to social skills like vigor and determination.
The etymology of energy opens up an interesting perspective. The Greek word energeia means the power to lift mere possibilities into reality an essential, even spiritual, understanding that corresponds harmoniously to the vital role energy holds for humankind.
Energy Management
In literature, the term energy management generally refers to technical disciplines (based on the definition of natural science). The focus is on detailed technical problems like the energy management of electric grids, of air conditioning, and so on. Hence, although management is originally a business term, business matters have be neglected in the energy field. ISO 50001 supports an organizational, cost- and benefit-oriented view of energy. It is high time that business administration plays its role as a partner of engineering by implementing energy management into every function of business, both in academia and in companies.
Business and Energy Not Yet Perceived As One Field of Interest
Attending a conference, I met an innovation manager of Hoffmann LaRoche, a global pharmaceutical company. As an educated person reporting to the board of directors, he had an interdisciplinary view. When I described my field of interest, he answered with astonishment: “Energy management as part of business administration—does that even exist?”
Here are three approaches to a business-oriented definition of energy management:
- The common, easily remembered definition based on the etymology of management may help. The word management is derived from the Latin root manus agere, with manus meaning hand and agere to act. Thus, management means the handling of everything and anything. This interpretation corresponds to the widely used (and sometimes misused) term management. Therefore, when energy is the object of any effort in an organization, the term energy management is appropriate.
- The second definition is my favorite one, because it is precise and describes what actually has to be done: Energy management is the proactive, organized and systematic coordination of procurement, conversion, distribution and use of energy to meet the requirements, taking into account environmental and economic objectives (Guideline 4602 of the German Association of Engineers VDI, 3).
- ISO 50001s definition of energy management is embedded in the definition of EnMS. It can be concluded that energy management encompasses all that has to be done to implement an energy management system to meet the requirements of the standard (see next chapter).
Energy management can be defined on different levels, focusing on different objects:
- Communal, state, federal, or global level
- Organizational (corporate) level, which is the focus of this book
- Household level (as a side note, many ideas of the book may be helpful for the readers in their private lives)
- Energy management for technical systems—corresponding to the still-prevailing interpretation of the term in engineering
EnMS and the PDCA Cycle
Energy management focuses on action. In contrast, an energy management system constitutes the rules for setting and achieving a companys energy performance goals. Focusing on the organizational interpretation and level, an energy management system according to ISO 50001 (2011, 2) is a set of interrelated or interacting elements to establish an energy policy and energy objectives, and processes and procedures to achieve those objectives. This definition reads like a summary of the standard; it is not very colorful, and the terms are lacking definition (which will be provided in the course of this book). So let us conclude in easy words: Energy management on a corporate level is the handling of energy, while EnMS determine the rules of how this has to be done.
The standard supports the plan, do, check, and act cycle (PDCA or Denim cycle). However, it is quite hard to assign the elements of the standard to PDCA. Most activities will be part of the planning process (ISO 50001:2011, 16) with the following planning outputs:
- Energy baseline
- Energy performance indicators
- Objectives and targets
- Action plan
A strong emphasis on verification reveals the roots of the whole system coming from quality management (QM).
Significance of ISO Standards
ISO acts globally with the support of national standardization institutions who are member bodies of the ISO federation. ISO and its members are nonprofit associations and non governmental authorities. Consequently, the standards issued do not have legal relevance unless a governmental law or court decision refers to them, and they become effective. Nevertheless, ISO standards do have ongoing significance; it doesnt make sense to ignore technical definitions for fasteners or valves in international business. The standards are based on a broad process of legitimation through formal discussions organized globally. The discussion process is institutionalized in technical committees, with the broad participation of experts on an international basis. Draft versions (Draft International Standards [DIS]) are issued for the discussion the overall process, however, takes years.
Every five years, ISO reviews the standards. Since the ISO committees know how difficult it is for many organizations to adapt to new rules, the alterations, in most cases, pertain to details easy to implement.
Importance of Management-Oriented Standards by ISO
Management-oriented standards make up only a small part of the norms, but ISO promotes their significance intensively. This was spotlighted on the ISO homepage, www.iso.org, where the featured “popular standards” are mostly management-oriented, as on March 17, 2014:
- ISO 9000 Quality management
- ISO 14000 Environmental management
- ISO 3166 Country codes
- ISO 26000 Social responsibility
- ISO 50001 Energy management
- ISO 31000 Risk management
- ISO 22000 Food safety management
- ISO 27001 Information security management
- ISO 20121 Sustainable events
Certification of the EnMS
An organization (e.g., company) striving to improve its management system may decide to undergo certification. In doing so, they should present their achievement to the stakeholders. A third-party auditor (certifier) verifies that all requirements of the standard are met and grants a certificate.
- The first party is the company itself.
- The second party is the stakeholder who should be impressed.
- The third party is the independent, accredited auditor.
- In a way, a fourth party enters the game, because a public authority has to accredit the certifying company.
Thus, an outward credibility disclosing internal organizational performance is attained, as Figure 1.1 shows.
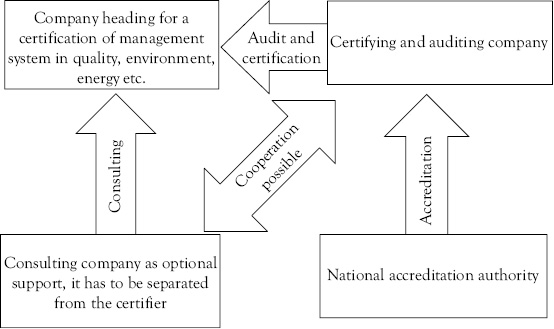
Figure 1.1 Institutions of certification
An Example of Practical Benefits
An example showing the importance of process orientation and cooperation between departments: Compressed air is produced by the energy or facility management department of a company, which is led by hundreds of pipelines into the workshops. If a leak of 0.5 cm in some hidden basement fails to be discovered, 30 L of compressed air will be lost per second, representing 27,000 kWh of energy and several thousand dollars in costs per year (depending on the local price). What’s the role of ISO 50001?
- ISO requires businesses to look at this process of energy supply holistically. Therefore, they must plan, conduct, and document regular leakage checks.
- Costs and benefits of management systems are often scattered throughout the energy supply process. It’s important to establish consumption, distribution, and possible leakages by measuring consumption and assigning usages to cost-centers. This provides an incentive for efficient energy use, for example, by reducing the pressure and switching the system off at night.
- The established management rules have to be considered as a starting point of improvement.
EnMS Certification in Addition to Quality and Environment
ISO 50001 EnMS complements the 9000 series, concerning QM, and the ISO 14000 series, dealing with environmental management. In Europe, the Environmental Management and Audit Scheme represents a comparable system to ISO 14000 with only slight differences. Currently, global warming concerns are intensifying interest in EnMS targeting reductions in carbon-dioxide emissions from fossil-fired power sources. Figure 1.2 shows scopes of the different management systems.
QM looks at everything of relevance according to the organizations own requirements. Of course, environmental issues have to be included in this scope because they do have relevance, but QM does not address this requirement. Consequently, environmental management was developed as an own field of action covering stand alone ISO management systems (ISO 14001), separate internal documentation, own staff departments, and so on.
The same happened to the field of environmental management, not really meeting the energy challenge. Experts found that the ISO standard did not cover the intrinsic energy aspect thoroughly enough, which led them to build up the line of EnMS standards. Although closely related to EnMS, the important question of GHGs is addressed only partly by reducing carbon-dioxide emissions, because nonenergy-related GHGs also exist. Global warming pushes the problem of GHGs to a paramount position in the agenda, causing ISO to open up another field of regulation and business. To provide an overview, the most important standards of the series mentioned earlier are assembled at the end of the book, following the references.

Figure 1.2 Scope of the standards for the management of quality, environment, energy, and GHGs
The following are some comments on the abbreviations: A very good QM approach may be called total quality management (TQM), overlapping other approaches like Six Sigma. Sometimes, one also refers to the entire system of QM as QMS. Environmental and energy management could be both abbreviated to EM (with or without S for system). Therefore, in this book, environmental management is written out, and EnMS follows the ISO 50001 terminology.
What does this distinction mean for organizations thinking about going for certification? They are somewhere in between the following situations:
- Some companies already have a certified management system according to quality, environmental, or other aspects, which are possibly subject to certification systems like safety or good laboratory practice.
- Other organizations, however, have no formalized, third-party audited rules and management systems.
In the first case, the energy aspect has to be added to the existing rules and documentation, taking into account that terminology must be adapted or introduced. This is the great advantage of ISO 50001. Standing in a tradition with quality and environment, the formal integration of energy should be easy in this case.
Company Example SCA
While writing this book, Uwe Rothermel, the energy manager of SCA in Mannheim, Germany, asked me if I have a graduate student interested in introducing ISO 50001 to the company as his or her thesis project. The SCA group, based in Sweden, is one of the world’s largest providers of hygienic products. The Mannheim plant, with its own power generation, would be sufficient to supply the whole city of 400,000 inhabitants. Since 1995, SCA already had a certified environmental management system, the goal of the master’s thesis was to “fathom the gap that has to be bridged covering the additional requirements of ISO 50001 and prepare a plan for implementation.”
A short note on the title “energy manager”: Uwe Rothermel has filled this position for many years, being responsible for the whole energy supply of production, namely, the power plant. Energy manager will also be defined in ISO 50001 (see Chapter 10).
At the editorial deadline of this book, the project was not yet finished; however, the student seems to do fine.
Appendix B of ISO 50001 offers a cross-reference list comparing the table of contents of quality (ISO 9001), environmental (ISO 14001), and food safety management systems (ISO 22000). Those comparisons are abundantly available from environmental or other specialized governmental or (semi)public agencies, associations of branches of companies, consulting companies revealing part of their expertise, or literature (Welch 2011).
For companies that have no certified management systems yet, a comprehensive approach is recommended. It does not make sense to erect the solemn pillar of a certified EnMS without designing the complete architecture of an overall integrated management system. But what if energy presents itself as a pressing problem? Tackle this problem with the methods and tools provided in this book, and consider the certification option according to the requirements of the market you are acting in. However, many companies just want to get some tips on how to reduce energy costs and, therefore, formalized management systems are not advisable.
Advantages and Disadvantages of an EnMS Certification
Is it necessary to attain a certification for the EnMS? The concepts of ISO 50001 systemize a whole bundle of good ideas for organizations positioning for a future with energy as a critical resource. So every company should look at the standard 50001 and get inspired, even those with little energy demand. Whether a company should pursue certification depends on many factors. Table 1.1 displays the most important pros and cons in the style of a balance sheet of arguments.
Table 1.1 Pros and cons of going for a certificate
|
Pros |
Cons |
|
|
It is important to stress that small and medium enterprises benefit from lesser requirements.
Energy as Part of Integrated Management and of Sustainability
Approaching Integrated Management
To understand an energy management system (EnMS) thoroughly, it has to be incorporated into the framework of integrated management and sustainability. In a broad understanding of sustainability, it is hard to find any management activity that is not touched by it. Sustainability means to make money (economic pillar), to improve environmental performance (ecologic pillar), or to improve the situation of people (social pillar), according to the triple bottom line concept (TBL or 3BL). Thus, it seems to be justified to discuss integrated management and the approach of sustainable management here.
Unfortunately, again, the terms are not as precise as would be desirable. Let us define integrated management (systems) as comprising all relevant management aspects in organizational structure, procedures, and documentation, following a consistent and harmonized hierarchy of objectives. This is a very far-reaching definition because relevant includes every issue and field of activity that managers and organizations decide to tackle. This all-encompassing understanding seems to be ahead of its time because, in the practical use of the term, integrated management mostly includes only quality management (QM), environmental management, EnMS, and other safety or risk-oriented perspectives. Following our broad view, here are some sample aspects and subsystems in order to demonstrate the scope that integrated management has to cover:
- The ISO-supported certification of QM, environmental management, EnMS, and greenhouse gases (GHGs, including carbon), as shown in Figure 1.2.
- Further aspects focusing mainly on risk reduction, for example, Occupational Health and Safety Management Systems (OHSAS 18001), Internet Security Management System (ISO 27000), Risk Management (ISO 31000), or the organizational enforcement of nondiscrimination according to national law.
- Regulatory systems for branches such as Good Manufacturing Practices (GMPs) for food, drug products, and active pharmaceutical products; Good Laboratory Practice (GLP); Good Transportation Practice (GTP); and some more summed up as GxP. ISO/TS 16949 contains “Particular requirements for the application of ISO 9001 for automotive production and relevant service part organizations.” ISO 50001 refers to the ISO 22000 Food Safety Certification in Appendix B.
- The number of designations linked to sustainability is quickly increasing (e.g., Energy Star, fair trade, organic food, etc.). The good idea of integration may get easily lost because of a confusing variety of certifications for management systems that have to be supported and endowed with resources.
It should not be forgotten that integrated management has to cover the primary operations through which a company earns income. This central aspect seems to be overlooked sometimes and will be explained now.
In most cases, employees on any hierarchy level do not consider QM, EnMS, or other facets of sustainability as core to their work; rather, these are important but additional requirements. Developing recipes in chemical industry, casting metal in a foundry, and conducting projects in the construction industry are examples of the daily work for which employees are paid. EnMS and other systems can be easily perceived as a hindrance to perform. It is the common belief that they only add to complexity in the workplace, with the result that the employees sometimes have to work overtime. Here are some ideas for how to integrate energy management in a lean way without demotivating employees:
- Most important are an intelligent structural organization (Chapter 10) and a stringent architecture of documentation (Chapter 18).
- Management accounting, which relies on new IT options, plays another key role, showing the financial benefits of energy conservation and efficiency (Chapters 7 and 14).
- The EnMS implementation project has to be interpreted as a process of change management (Chapter 29). Accordingly, the company members are respected and they take pride in their work, becoming more influential and effective. It is a win–win situation for the organization as a whole since it makes use of the know-how of the employees and they, in turn, feel involved, respected, and appreciated.
Integrated Sustainability Management
According to the most commonly cited definition, from the United Nations, sustainable development is “development that meets the needs of the present without compromising the ability of future generations to meet their own needs.” The triple bottom line, TBL or 3Ps, describes the taking and giving between companies and their economic, natural, and social environment through integrated (sustainability) management, balances, reporting, and disclosure. Based on this interpretation, Figure 2.1 shows different types of reviews or balances that will integrate EnMS into this concept.
- Accountants have always tackled the first aspect, the economic pillar, to keep companies profitable. The methods and tools of economic balance sheets are widely covered by business administration according to national and international legislation. In this book, we will take this as a basis and proceed to the second pillar in order to integrate physical energy.
- In ecological dimension, business meets natural sciences. Here, considerable methodology is needed to understand the ecological or environmental balance and how energy and carbon balances may evolve. The next section will elaborate on this.

Figure 2.1 Integrated sustainability management and balance sheets
- The third dimension, the social pillar, is—at first sight—not a very demanding challenge from the perspective of accountancy. The key performance indicators (KPIs) are relatively easy to determine, for example, percentage of women in leading positions, donations to local communities, or expenditures for training employees. Eventually, it is not enough to report some isolated KPIs. Social sustainability should be defined and measured within a consistent and all-inclusive framework. Here, an ongoing discussion can be observed.
From Environment to Energy to Carbon
Focusing on the second column of integrated sustainability management, it’s important to understand how environment, energy, and carbon are linked. An overall environmental balance sheet of a plant describes every physical input and output, as Figure 2.2 demonstrates.
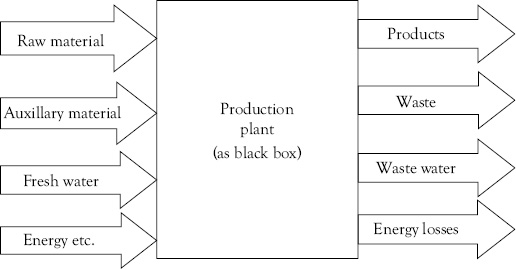
Figure 2.2 Environmental balance of a production plant
The easiest level for which to develop such a sheet is a plant or a factory building. If plants are aggregated, entire activities of concern can be displayed. This balance should include every aspect of ecological significance. Consequently, such an analysis constitutes the basis to derive balances for specific environmental aspects like water, energy, organic substances, and so on. An energy balance may be extracted by taking out every energy-related flow (or omitting the rest). An example is displayed in the Figure 2.3 . Here, the input side shows in greater detail what the arrow “Energy” indicates in the previous figure.

Figure 2.3 Energy balance of a plant
The established term balance can be a bit misleading. Mostly, only the energy input is captured, because it may be very challenging to calculate the energy losses. This is the reason why many companies only concentrate on the energy efficiency of crucial assets.
The next step would be to derive a carbon balance as part of an overall GHG balance (which is not elaborated here). The quantity of energy applied is known and has to be multiplied by the corresponding carbon emission factor. Here is an example: If we burn one liter of diesel or heating oil (which is chemically the same), 2.6 kg of carbon dioxide are immediately emitted.
Before the diesel is at our disposal, raw oil has to be mined, refined, and transported. The energy needed in those steps is called gray energy or cumulated energy demand (CED). Electricity is a very special case, because of its zero emissions when used and the strongly differing gray energy depending on the generation and procurement. Table 2.1 presents some important emission factors, including aspects of gray energy.
When working on a draft version of this table, it was my hope to present one single and ultimate emission factor for each energy form. Unfortunately, this is not possible. Many energy carriers are natural products varying considerably in quality. Furthermore, the gray energy has to be traced according to individual procurement; the invoice of the utility is a valuable information source.
Table 2.1 Carbon emission factors of selected energy carriers
| Energy | Emissions of carbon dioxide carbon emission factors |
|---|---|
| Electric energy in kilowatt-hours (kWh) | Zero when used because the gray energy of generation varies considerably: 1.2 kg/kWh for generation with brown coal, 0.04 kg (40 g or less) per kWh for wind energy |
| Heating oil or diesel (liter) (specific weight is 0.820 to 0.860 kg/L) | 2.5 to 2.7 kg carbon dioxide per liter when burned plus gray energy |
| Gasoline (liter) (specific weight 0.720 to 0.775 kg/L) | 2.3 to 2.4 kg carbon dioxide per liter when burned, plus gray energy |
| Kerosene-based jet fuel for airplanes (liter) | 2.4 to 2.8 kg carbon dioxide per liter plus gray energy. When emitted in great height, an additional factor up to 2.7 necessary |
| Natural gas not compressed (cubic meter) | 1.8 to 2.0 kg carbon dioxide per cubic meter plus gray energy |
| Bioethanol and biodiesel (liter) | Far differing numbers, from 70% savings compared with fossil fuel to negative effects because of deforestation of jungle and monocultures. One tank consumes the corn needed as food for one person for one year |
| Compressed natural gas (CNG), liquefied natural gas (LNG), liquefied propane gas (liter) | 2.3 to 2.7 kg carbon dioxide per liter plus gray energy |
| Coal | 2.5 to 3.7 kg carbon dioxide per kilogram plus gray energy |
A Little Excursion into Chemistry
It seems strange that one liter of diesel with a specific weight of less than 1.0 kg will lead to an emission of 2.6 kg CO2. When fuel is burned, each atom of carbon released will react with two atoms of oxygen coming from the surrounding air. This adds to mass. We don’t feel the weight of gas, because we are surrounded by the atmosphere of the earth with a constant pressure from all sides. If we try to weigh the heaviness of water being submerged, it would not work either.
Do you want to know how to experience CO2 in daily life (and no longer only as the abstract notion of being part of the surrounding air)? Just open a bottle of sparkling water—the sparkles are CO2.
The total carbon emissions caused by a company in a specific period can be called company carbon footprint (CCF); the calculation methodology is the subject of ISO 14064. To get a better picture of a company’s carbon impact, the boundaries of the balance have to be defined thoroughly. Are only the direct emissions included? And which part of the gray energy is taken into account? Are there any offset activities involved?
There are many useful calculation tools available on the Internet (e.g., www.carbonfootprint.com,carboncalculator.direct.gov.uk/index.html,www.co2-calculator.eu). Large business software providers offer modules that support the balances mentioned previously. The methodology of carbon calculation and the emission factor are not visible at first sight when using the tools. Consequently, quick first steps are easy, but if a company wants to establish a carbon accounting, the methodological aforementioned questions have to be answered.
Carbon accounting captures the flows of this GHG; carbon management improves carbon efficiency and conservation. Both are important parts of ecological, or green, management and the greening of organizations. Industrial ecology as a buzz word expresses the aim of developing companies according to the model of ecological systems in harmony with nature.
Physical Forms
For an accountant in industry, energy is measured in costs or sometimes revenues. For a better understanding of operations, we should also take a look at the scientific and technological side. Team-working professionals with different educational backgrounds need a sufficient overlap in their terminology to cooperate efficiently. As physical energy is the ability of a system to deliver work (see Chapter 1), Table 3.1 shows different forms of energy and practical examples of company-related work.
Energy is transformed when used at a company. Some examples are already included in the preceding table; the internal energy flow in companies and value networks will be explained in Chapter 13 (Accounting—Energy Reviews).
The first law of thermodynamics, the conservation of energy, states that energy cannot be destroyed or created, it can only be transformed. This energy theorem provides a beautiful parallel to the idea of an economic account that has to be counterbalanced. The commonly used terms energy production and energy generation can also be found in this book, but being strict, they should be avoided. The term energy losses builds upon models showing that it does not make (economic) sense to expend energy at the output side (e.g., thermal radiation of a building).
Watt and Watt-Hour
Energy has to be measured, and the most commonly used unit in companies is watt-hour (Wh). Without a basic knowledge of the energy capacity or wattage of an energy-consuming asset, this term cannot really be understood. Therefore, let us choose simple, everyday examples that are understandable for a nonengineer. The energy capacity or wattage of an asset describes the rate (or strength) at which energy is used. It is measured in watt (W). A standard hair blower, fan heater, water boiler, or lawn mower can draw between 1,000 and 2,000 W of power. The physical definition is:
Table 3.1 Forms of energy and examples of company-related work
|
Forms of energy |
Examples and explanation |
|
Chemical energy |
Everything that can be burned contains chemical energy with the option to transform it into thermal energy (heat) and other forms. Fossil energy carriers like coal, oil, and gas are nonrenewable chemical energy resources; wood, the battery of nature, is a renewable one. |
|
Mechanical energy (subcategories are kinetic energy; potential, elevation, or position energy; wave energy; elastic energy; sound energy) |
Lifting a sledgehammer increases the potential, elevation, or position energy. Letting it down produces kinetic energy, for example, used to forge a metal sheet into a car wing. An example that should be avoided: a car with kinetic energy transmits this energy into the guardrail and accordingly creates a sudden stop. Consequently, the guardrail and the car wing are damaged. |
|
Electric and magnetic energy |
Electric pump transporting a fluid, electric heating, e-mobility in all its forms, and so forth. An electric drive of a conveyor makes use of magnets to produce kinetic energy. |
|
Thermal energy |
Heat from a furnace hardening metal or of a steam cracker refining raw oil. Every item with a temperature above absolute zero (above -459.67°F and -273.15°C) contains thermal energy from a physical point of view. In engineering and business, implicitly, the desired temperature of a process (for example, to achieve an appropriate temperature in a room) becomes the zero-point of the scale: If it is cold outside, heating energy has to be provided. Given high temperatures outside, air conditioning has to deliver cooling energy. |
|
Nuclear |
Uranium or other nuclear elements can be used to transform solid material into heat (thermal energy). Recurrent accidents in nuclear power plants remind us of the risks of this technology; furthermore, the problem of disposal of nuclear waste has not been solved and the residues can be used to produce nuclear weapons. It is the author’s position that humankind should go the renewable way of energy generation and phase out nuclear power. As this is a political topic and nuclear power has near to no relevance for nonutility companies, nuclear power is excluded in the following. |

The wattage is mostly indicated on the device itself or in a manual. It says how much energy is consumed in a given period of time at full power. If the time is exceeded, more energy will be consumed proportionally. The energy input (or input energy) for one hour of lawn-mowing can be calculated by multiplying the wattage by the amount of time:

Watt-hour is the short form of “watt multiplied with hour.” Thus, the energy consumption of a lawn mower, in use for two hours, can be calculated as follows:
2,000 W × 2 h = 4,000 Wh
The current wattage of a device while being used depends on a regulation if there are more grades than on and off. The wattage in the operations manual refers to the energy input. The energy output involves the difficulty of calculating the energy efficiency and energy losses.
The Bathtub Comparison
Imagine preparing a bath, the quantity of water streaming into the tub represents energy (here without considering the temperature). If you want to be quick, you will open the water-tap as far as possible. This symbolizes the full wattage or capacity of an energy-consuming device. The water running into the tub stands for the energy already consumed, and the longer the tap is opened, the more water (energy) runs through it. Closing the tap partly is similar to lowering down the wattage and energy consumption.
In order to avoid confusing high decimal places in the measurements, the watt unit can be converted into kilo (for thousand ):
4,000 Wh = 4 kWh
Table 3.2 Levels of energy capacity measurement units
|
Measurement unit of energy capacity or wattage |
Abbreviation and dimension |
Examples |
|
Watt |
W |
An amount representing a 20th of the capacity of a typical halogen light bulb |
|
Kilowatt |
kW 1,000 W thousand, 10 3 |
Electric capacity of a small hair dryer or lawn mower |
|
Megawatt |
MW 1,000,000 W million, 10 6 |
3 MW: electric locomotive 500 MW: wattage of a mid-sized power plant, which is enough to operate 500,000 small hair dryers at the same time or to supply a city of about hundred thousand inhabitants with electricity. |
|
Gigawatt |
GW 1,000,000,000 W billion, 10 9 |
Capacity of a large power plant, which is sufficient to supply a large region or a city of one million inhabitants in an industrialized country with electricity (depends on the individual energy demand of the people and their lifestyle, e.g., New York and Dhaka are very different.) |
|
Terawatt |
TW 1,000,000,000,000 W trillion, 10 12 |
Big countries need some large power plants to generate hundreds of gigawatt, however, countries have to be combined to reach the level of terawatt. Here, the dimension of continents is reached. |
|
Petawatt |
PW 1,000,000,000,000,000 W quadrillion, 10 15 |
The gulf stream in northern Atlantic has an energy capacity of some petawatt and influences the climate in Europe by transporting warm water from the Caribbean to Scandinavia and Great Britain. |
For industrial applications, the unit has to be raised to the levels of mega, giga, and tera. Tables 3.2 and 3.3 give the abbreviations and provide examples for energy capacity in watt, as well as for energy in watt-hour.
Sometimes, the abbreviations are written with different capitalizations. Here, a common version is chosen. This pertains to the abbreviations of energy-measurement units as shown in Table 3.3 . Just as energy capacity or wattage in the previous table refers to one moment or an average over a longer period, the energy consumed has to be indicated for a given period of time.
Table 3.3 Levels of units for energy consumption
|
Energy measurement unit |
Abbreviation and dimension |
Examples |
|
Watt-hour |
Wh |
If a halogen bulb of 20 W is switched on for 1 h, the energy needed sums up to 20 Wh. If it is switched on for less than 1 h, the energy consumption has to be measured in watt-seconds with the complication that an hour consists of 3,600 sec. |
|
Kilowatt-hour |
kWh 1,000 Wh thousand, 10 3 |
Let us assume the halogen bulb is part of an emergency lighting system and switched on constantly, 8,760 h a year. The energy consumed would add up to 20 W × 8,760 h = 175,200 Wh. This equals 175.2 kWh. A typical electrical energy consumption of a household can be 10 kWh per day. |
|
Megawatt-hour |
MWh 1,000,000 Wh million, 10 6 |
The electrical energy consumption per year of the typical household has to be calculated as 10 kWh × 356 = 3,560 kWh. This can be written as 3.56 MWh. |
|
Gigawatt-hour |
GWh 1,000,000,000 Wh billion, 10 9 |
Most industrial companies can conveniently express their energy demand in terms of gigawatt-hours. |
|
Terawatt-hour |
TWh 1,000,000,000,000 Wh trillion, 10 12 |
Very large companies and small countries are on the level of terawatt-hours. |
|
Petawatt-hour |
PWh 1,000,000,000,000,000 Wh quadrillion, 10 15 |
The energy consumption of the OECD countries in Europe is about 20 PWh |
Kilowatt-hours are the most commonly used energy measuring unit in companies, but many other units exist and are applied in different branches or for specific purposes, among them are:
- Joule
- Calories
- Ton of oil equivalent (TOE) or barrel of oil equivalent (BOE)
- British thermal unit (BTU)
- Ton of coal equivalent (TCE)
It may not always be easy to find the right conversion factor, because some units exist in many variants. Furthermore, temperature, humidity, or other natural and technical conditions may be factors.
Energy Content of Different Energy Carriers
Business people should be able to shift between
- Quantities of energy carriers (e.g., liters);
- Energy measuring units (kWh or other measuring units according to the foregoing table); and
- Costs or revenues (as monetary units).
While energy procurement deals with liters of heating oil or cubic meters of gas, traditional accounting looks mainly at the cost side of the invoice. The missing link between quantities of energy carriers and energy in kilowatt-hours is provided by the heating factor. It shows how many kilowatt-hours the energy quantity may deliver:

This formula can be used for business purposes:
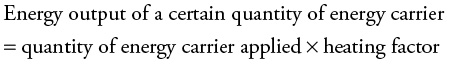
The heating factor can also be interpreted as an energy content or density of an energy carrier or storage unit. This is important, for example, in logistics, because energy has to be taken along with a car or a truck. As diesel (heating oil) has a high energy density in comparison to batteries, the weight is lower and permits a higher useful load and reach for a carrier.
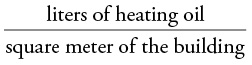
Common heating factors (depending on the exact chemical definition) for heating oil are 10.08 kWh/L or 10.45 kWh/m2 for natural gas. Oil, gas, and coal are natural products and—although refined—have slight differences in their chemical attributes. With this background information, an accountant may easily understand and transfer energy input into kilograms, cubic meters into energy balances in kilowatt-hours, and carbon balances into kilograms. Many utilities include this information in their invoices.
An Example of Application
If the consumption of natural gas in an office building of 1,000 m2 is, for example, 10,000 m3 a year, the heating factor with a range of 8.8 to 11.4 has to be multiplied with 10,000 L to calculate the kilowatt-hours used for heating. That equals 88,000 to 114,000 kWh for the whole building and 88 to 114 kWh for a square meter.
Since the heating factors of 1 L of heating oil and 1 m3 of natural gas are approximately 10, a quick estimation can be made when renting a flat or buying a house.
Again the initial intention in providing a comprehensive table with heating factors had to be revoked: Some variations of the definition of the factors due to different technical premises would have to be explained. Furthermore, the variations for energy carriers like coal can be considerable. If coal absorbs moisture, experiments have to be conducted to get a correct value. This could make sense if the lot of coal is large enough and the contract with the provider sets a minimum of energy content or a maximum percentage of water.
Energy Performance and Efficiency
ISO 50001 (2011, 14) presents a model of energy performance, with definitions that are scattered throughout the standard ( Figure 3.1).

Figure 3.1 ISO definition of energy performance
The core of the model consists of energy use (the manner or kind of application of energy, like ventilation, lighting, heating, cooling, transportation, processes, production lines) and energy consumption (quantity of energy applied). These are absolute, stand-alone indicators that cannot be interpreted without further information. It is an interesting observation that the positive connotation of the term performance could be turned into a negative one by looking at use and consumption. The terms do not match well, as it could be assumed that the higher the consumption, the higher the performance.
The other components of energy performance are relative indicators offering a ratio. Energy intensity and efficiency open up the way to consider which achievements per unit can be reached by a specific energy input:

The degree of efficiency or effectiveness makes a difference between useful (effective or net) energy and energy losses regarding a single process or a whole system. To calculate energy losses, the previous formula has to be varied:
![]()
To give some examples of application:
- Conventional car engines have an efficiency of 30 to 45 percent (with diesel having a tendency to beat gasoline); the balance adding up to 100 percent consists of energy losses from heat radiation or friction.
- Electric drives have an efficiency of 60 to 95 percent, a major reason to promote e-mobility and comparison to combustion engines.
- Wind turbines reach an efficiency of 40 percent, so this percentage of the kinetic energy of streaming air is converted into electricity.
- Thermal solar panels can convert a remarkable 60 percent of solar radiation into heat.
- Conventional coal energy plants operate with 40 percent energy efficiency and sometimes below, while combined heat and power plants can reach about 90 percent. (I met the energy plant manager of Freudenberg in Weinheim, Germany. He calculated that his facility achieves up to 95 percent.) These numbers are a massive hint to inefficiencies worldwide.
The efficiency of a technical system (a single operation or a whole plan) is difficult to measure. For practical and business uses, the inverse ratio referring to an object or purpose of consumption is established. Some examples:

Or the other way round:

Many more applications will be introduced in Chapter 14 on energy performance indicators and in other chapters dealing with different business domains.
Megatrends and Background Theory
Scarcity of Energy Resources and Global Warming
In 1972, the Club of Rome’s report, Limits to Growth, brought the insight that natural resources are becoming increasingly scarce. Although it is beyond our scope to cover this whole area, two main energy-related questions should be considered here:
- The scarcity of important fossil energy carriers (in particular, peak oil); and (of even greater relevance)
- The limited ability of the atmosphere to absorb greenhouse gases (GHGs, global warming).
This second aspect has to be interpreted as a natural resource even though nothing is extracted. Both contribute to the three dominant aims of every nation’s energy policy: To cover the energy demand in an economic, reliable, and ecological way.
Availability of Fossil Energy Resources
Let us begin with the stocks of fossil energy in a geological sense. The indicator reach measures the scarcity here:

To assure the actuality for many years, this book only contains some rough estimates. Furthermore, the driving variables for interpretation are explained.
Raw oil has got a reach in the range of decades—but this indicator has been constant already for decades! At first sight, in spite of the increasing oil consumption worldwide, the stocks did not seem to be diminished. The reason for this seeming paradox lies in the definition of stocks: They comprise the minable quantities at the current prices. As prices went up, more and more geological deposits were exploited. Between they year 2000 and the beginning of the financial crisis in the year 2008, the raw oil price for one barrel Brent Oil (159 L) went up from below $30 to $146 peak. As prices are strongly influenced by speculation and political conditions, considerable market volatility can be observed. (Current prices are easy to view at commodity exchanges or in the economic press; please pay attention to the considerable differences due to raw oil qualities.)
Coal is globally available for hundreds of years, and some countries with great importance for global warming like China may cover their demand from their own mines. Traditional growth may be attained without having to prepare for rising mining costs. Consequently, global warming has to be prevented by willful action.
Natural gas has a reach between coal and oil. Rising prices make fracking as a technology to extract gas profitable. This shale gas technology leads to falling prices in the United States. Improved technology, the political will, and rising prices brought about this unexpected development.
Nevertheless, energy is a sensitive topic even for hard-nosed managers who are maximizing profits in countries with currently cheap energy, as it deeply correlates with political, economical, and ecological crises:
- The former Saudi oil minister Sheikh Zaki Yamani stated that “[t] Stone Age did not end for the lack of stones, and the Oil Age will end long before the world runs out of oil.” Technological advances will take us beyond the oil age, bringing about advantages not primarily linked to energy. For example, video conferences are helping to conserve fuel, but they are done mostly because they are quick and convenient.
- Energy markets reflect the rise or decline of the world economy immediately and significantly. Furthermore, energy can serve as a weapon in conflicts. About 20 percent of the world’s oil demand has to pass the Strait of Hormuz in the Middle East, a region of considerable political unrest.
- Governmental regulations fighting global warming may have a sharp impact. The Fukushima nuclear disaster led to the temporary switching off of all Japanese nuclear power plants.
- Technological innovations like fracking, solar panels, or passive houses can make the breakthrough. Renewable energy carriers like sunbeams, wind, or waves have unlimited reach. The following chapters will explain how we may tap this potential energy, leaving the fossil fuels buried in the ground.
Global Warming
What are we actually doing digging out the carbon hidden in the ground since the times of the dinosaurs? Dinosaurs needed a strong greenhouse effect, because they were hematocryal reptiles adapting to the temperature of their environment. High temperatures were necessary to keep their massive bodies warm. A high concentration of CO2 in the atmosphere brought about a strong greenhouse effect. Extended swamps buried trunks and other plant material that transformed into turf, one layer after the other pressed down on the previous ones over hundreds of millions of years. Thus, turf became brown coal, fat coal, raw oil, and natural gas. The concentration of CO2 in the air went down and the greenhouse effect was reduced, determining our current climate. If we continue releasing the buried carbon, we spoil our climatic conditions risking becoming the dinosaurs of the future—being extinct.
The Intergovernmental Panel on Climate Change (IPCC) comprises hundreds of top ranked scientists advising the United Nations. They issue reports concerning global warming (see www.ipcc.ch). Their results are clear: A manmade climate change is occurring and its consequences will be catastrophic for humanity and the earth. We have to prepare for rising sea levels, extreme climate events, droughts, and inundations. The social, economic, and political impact will be hunger, climate refugees, and wars.
The ice bear of Figure 4.1 on a melting sheet of ice symbolizes the threatened natural resources of our existence.

Figure 4.1 Ice bear on dwindling sheet of ice as a symbol for the hazards of global warming
Source: Polar Bears International.
Additionally, tipping points pose a massive risk for climate models. Developments of complex systems (as the climate) are not linear but may be disruptive; an ecological system may topple. A lake can absorb a considerable quantity of nitrate, but with a small additional exposure exceeding the limits, it may die biologically. The world economic crisis in 2008 may be interpreted this way as well, as foul credits in the U.S. housing market seemingly did not have any effect at first, but eventually they triggered an economic earthquake. In the context of climate change, tipping points also take place; for example, the effects of methane gas released by unfreezing permafrost soils, or the loss of glaciers in Greenland changing the flow of the Gulf Stream.
A Social Comparison
Let us compare our children’s and grandchildren’s way of life to a boat trip. There are two vessels available: a speedboat anchoring right at the pier—and it will be fun, we can jump right on it—and a sailboat still sitting at the wharf, needing some work and effort before it can be put into the water. If they take the sailboat, the travelers may not reach their destinations in a short time. The speedboat, however, also has a disadvantage: There may be an obstacle in the water and the travelers—approaching at high speed—could lose their lives. This can be transferred to our society’s way of life with the speedboat standing for an economy based on conventional growth while the sailboat reflects an economy based on sustainable growth. The IPCC warns: If we continue to exploit conventional energy carriers and other environmental resources, many people might die. In this example, no one would accept that a beloved person enters the speedboat; the rational choice is to invest into finishing the sailboat, ensuring a safe trip. But under the condition of “the tragedy of the commons,” the world is currently deciding otherwise.
In 2006, the so-called Stern Review on the Economics of Climate Change demonstrated with great clarity that avoiding climate change would be much cheaper than mitigating its consequences (2006). The consequences for companies are less obvious than those for politics in our global village:
- Managers should observe how climate change and corresponding regulations are perceived by policy makers.
- Companies are advised to account for energy, being able to realize profitable investments to prevent GHGs.
- A long-term strategy has to be formulated and followed. It is prudent for companies to join the technologies, branches, and regions of the world that are succeeding.
- Managers should consider the ethical side of the problem.
- Additionally, every reader of the book is a voting citizen and can exercise his influence as a consumer.
The next chapter will outline which political actions are necessary to countervail climate change.
Core Idea
In a free market economy, entrepreneurs are realizing profits by optimizing costs and revenues. Competition is leading to technological progress and growth; the “benefit of the greatest number” is attained, speaking in the words of the classics. According to utilitarianism, self-interest leads to the greatest benefit and welfare for the majority in the short and long run. Unfortunately, the long-term costs of climate change are not assigned a price, markets fail in the use and allocation of so called free environmental goods. If an environmental good causes no cost, everybody uses this free resource to saturation level—a tragedy of the commons. There is only one reasonable way for the global village in a market system to overcome this failure: External (social) costs have to be internalized. External costs are imputed to others and not to the one benefiting from an economic action. The principle of causation is basic for internal accountancy and should also be integrated into the economy on national and global levels. Figure 5.1 demonstrates what happens to the market when external costs are included. The figure describes the market of any good causing carbon emissions. Thus, every material good is included; only the costs and prices for services like haircuts (without electric hairdryers afterwards) would not be changed.

Figure 5.1 Market diagram including external costs
As the supply curve becomes steeper, the market equilibrium is found at a higher price and lower quantity. At first, this may sound like abandonment, but in the long run, and with several markets involved, it will turn out to be the contrary. The additional money representing the external costs can be invested, leading to growth in other markets with less environmental impact.
We now have to take a closer look at what legislation can do to bring about this internalization of external costs. There are three principal ways of pricing priceless goods to correct this market failure. They will be discussed in the following sections:
- Direct control of behavior
- Regulation of prices through charges, fees, tolls, or Pigovian (also Pigouvian) taxes
- Regulation of quantities through a certificate trading systems and emission allowances (cap and trade)
On this basis, some further discussions have to be mapped to cover the field; we dedicate a section to each of them:
- An appropriate price for carbon has to be found.
- Taxes and certificate trading systems may lead to funds that could be redistributed to the citizens per capita (energy money), an ingenious idea with great advantages.
- Many countries grant subsidies for renewable energy sources to help them into the market. Although economic theory is suspicious of this approach, it has its practical impact and advantages.
- Summing up, embracing renewable energy and a sustainable economy could bring about the next industrial revolution.
Direct Control of Behavior
It does not fit to the concept of a free economy when governmental authorities and legislation prescribe how participants of markets have to act. Nevertheless, it is a quick and sometimes effective way to mend the discussed market failure. Making use of this instrument, authorities have two options to urge companies into a cleaner production: Either they prescribe which technology has to be applied or they define threshold values for emissions. Eventually, the effect will be the same, since the regulating authority has to make sure that an appropriate technology is available before defining thresholds. In some cases, setting threshold values provides more flexibility, by allowing companies to find creative ways in how to reach them.
Here are some practical examples for direct control of energy technology:
- The threshold values for the maximum energy demand a building may have per surface unit.
- The ban on conventional light bulbs, which are only 5 percent energy efficient.
- The European Union’s (EU) energy-efficiency guideline for production technology.
- The limits of CO2 emissions per distance that a car or a fleet of cars, which a car manufacturer has to meet.
Furthermore, a whole bundle of supplemental measures can be taken up by legislation in the form of:
- Information obligations (informing the customer about key energy indicators of the goods which they intend to purchase);
- Organizational duties (chimney sweeping once a year);
- Label initiatives (classification system for energy-consuming devices like refrigerators);
- Tax relief on the basis of nongovernmental certifications and initiatives (tax reductions for ISO 50001 certified companies).
Prescribing or banning a technology aims to enforce progress relatively quickly. On the negative side, various problems concerning competition arise because cost relations are distorted between business branches and countries. Once a technology is established in this way, it could become a hindrance to the breakthrough of advanced options. The following boxed example illustrates how difficult it can be to implement the clean technology—available for a long time now—in the global car market.
The VW 1 L Car
In 2002, VW presented a car consuming only 1 L of gasoline per 100 km. (Since 1 gal. equals 3.78 L, one could drive about 378 km/gal. with this car. As a mile covers 1.609 km, one can with 1 gal. reach a distance of 378/1.609 = 235 miles.) Members of the VW board drove some hundred miles on public highways proving that they trusted this technology. Actually, the fuel consumption was as low as expected. Still, this standard-setting car was not produced and offered to the customers. The firm probably wanted to avoid a market cannibalization with other models. Ten years later, in 2012, an advanced model was presented to the public (see Figure 5.2).

Figure 5.2 1 L-car
Source: Volkswagen AG.
Again this car was not meant for mass production; only some hundred selected customers were offered a leasing contract.
What one can learn from this story:
- The technology for energy-efficient cars has been mature for many years. Regrettably, VW used this prototype only for marketing purposes. Yet, our focus should, of course, not solely lie on VW; every car-producing company should be able to construct such a vehicle.
- It is a stunning example of how far away market mechanisms are from tapping the potential of available energy technologies for a sustainable economy. The inefficiency of the market is reflected by the comparison of the consumption of the 1 L car to that of an average car on our roads.
- The existing market system prevents innovations of this kind. Companies are looking at their revenue and not at the greatest long-term benefit for all. This seems to be their interpretation of their role in the system.
- E-mobility is a rivaling technology, energy-efficient and not dependent on fossil fuels. Finally, a democratically elected legislator could act to encourage its development over the prevailing technology.
There are good reasons as well as grave principal objections to direct legal interference in a company’s energy technology and product policy. Again advances in global governance would be a key to avoid distortions when enforcing what is obviously reasonable on a global scale.
Pigovian Tax
Arthur Cecil Pigou was a British economist and Nobel laureate who published The Economics of Welfare in 1920, proposing a tax for market activities that create negative externalities (Pigovian or Pigouvian tax). The expression tax does not fit well because taxes are intended to cover the expenses of countries or other administrative authorities. This is not the intention in the case of externalities; thus, a charge, toll, fee, or royalty for greenhouse gases (GHGs) would be a better expression. Furthermore, the negative connotation of the term tax would be avoided. As the denomination carbon tax is established, we consent here to use the term as well.
The effect of introducing a carbon tax has already been demonstrated in the Figure 5.1 This simple idea contributes to a healthy market system, with allocation of resources and technological advances leading to the creation of value. Prices should speak the (ecological) truth, as expressed by Ernst Ulrich von Weizsacker, a leading scientist teaching in California and Germany. Without internalization, profits of companies and the gross national product (GNP) are not necessarily indicators for value created, but they possibly indicate the destruction of resources that are excluded from the accounting system.
Certification Trading System
Economic theory criticizes the fixing of prices by taxing external effects, because the reaction of market participants and the quantity of carbon eventually emitted cannot be predicted exactly. A certification trading system works the other way around: The overall quantity of emissions is determined based on the capacity of the atmosphere to absorb carbon. The overall sum of emissions is divided into emission allowance units (EAUs) and sold in an auction. So—in theory—the Intergovernmental Panel on Climate Change (IPCC) could determine the emissions appropriate to maintain global warming within two degrees, as targeted. This is the theoretical foundation of the Kyoto Protocol, and subsequent agreements. According to economic theory, it is the most elegant and effective way.
Unfortunately, some difficulties arise when one looks at the design of emission allowance trading systems in reality:
- Although a global approach is needed, important countries are not participating.
- The amount of EAUs was set so generously that prices became insignificant, ranging to below $10 (check the exchange index CARBIX for the current price).
- In order to introduce the system at all, the EAUs were first assigned to the companies without costs. Hence, only EAUs of no relevance were really traded.
- Only industries with high emissions are included.
One can only hope that this tool of environmental policy is increasingly applied in a more effective way.
Carbon Trading Scheme in China
At the beginning of GHG emission certificate trading according to the Kyoto-Protocol, China hesitated to participate. In the last years, environmental problems coming from the extensive use of coal in Chinese megacities triggered a national certificate trading scheme. It is growing rapidly and will eventually outpace the volume of Europe’s system (currently the largest in the world). In 2014, some 24 million tons of carbon dioxide equivalent were traded by 2,000 companies with a value of 123 million euros (Darby 2015, according to Thomson Reuters). In 2015, the volume will rise to 40 million tons. The regional authorities are setting the price of 1 ton within the range of three to seven euros, and the trading scheme contributes to reaching the peak GHG emissions around 2030.
A Price for Carbon
What do the low prices for EAUs mean in practice? One liter fuel oil or diesel causes 2.6 kg of carbon dioxide. Given a price of $10 per EAU, a liter would cost $0.026 or 2.6 cent more (see the carbon emission factors in Chapter 2). Thus, what would be an appropriate price for one ton of carbon dioxide emissions, enforced by the economic instruments outlined before? The threshold for a real impact on the behavior of companies is generally assessed at $40 (about 30 euros) per ton. The renowned German Center for Aerospace (DLR), in its numerous studies for the Ministry of Environment, sets the price of CO2 at $90 (70 euros). Summing up several investigations, the price range is between $12 and $360 (15 and 280 euros) per ton.
Let us contribute to the discussion by applying the willingness-to-pay method: Climate change will, in all probability, lead to rising sea levels causing inundation of extended regions of Bangladesh and to the desertification of the Sahel zone in Africa. This will cost the lives of many people. What is their value? On a humanitarian basis, and seen through the eyes of relatives, every single life has an unlimited value. Thus, GHGs should have such a high price that no person gets lost. Now let us assume that the threatened Bangladeshis and Africans were billionaires. They would be willing to pay a fortune to avoid their death or the deaths of their children. This little willingness-to-pay model serves as a reminder to drive the price as high as possible. Following this line of thought, the price for carbon would trigger a stringent energy turnaround.
Contemplating the monetary value of a human seems to be cynical, as every person is unique and of unlimited value for his or her loving family, and according to self-assessment. From an economic viewpoint, the argument may be turned around: Not asking for the economic value of persons is cynical since many public decisions are based on implicitly assigning a value to (statistical) lives. Examples can be found in the context of public health care, fire fighters, admittance or prohibition of hard drugs, alcohol, smoking, or humanitarian decisions about helping refugees or abandoning them. Here are some randomly selected examples of valuations taken from different backgrounds:
- An insurance company values the life, or death, of working people in industrial countries roughly within the range of $100,000 to $1 million.
- National income accounting for GNP implicitly proposes the value of a person to be the financial contribution to the economy within the expected lifespan.
- About 30,000 children per day are dying from the consequences of malnutrition, dirty water, and the lack of basic medical care. Only a few dollars could save each of their lives.
Redistribution of Energy Money to the Citizens
Liberal economists mistrusting additional public funds raise objections to an internalization tax and the certification trading system. Their suspicionis that if a public authority gets money, a useful purpose to spend it will be found, leading to a rise of the public expenditure quota (e.g., the still existing tax for sparkling wine in Germany was introduced to fund the navy for World War I). Consequently, the funds raised by a new tax or by selling EAUs should be tied to one of the following purposes.
The original idea of Pigou and the welfare economics is to repair the damage caused by an environmental effect or to indemnify the affected party. Global warming cannot be repaired in the sense of cooling the earth down again and stabilizing the climate. To adopt the idea, mitigating the consequences would mean building dams and providing financial means for future generations, especially in developing countries of the Southern Hemisphere. In a broader sense, the idea should be applied by helping developing and emerging countries into a sustainable economy (leapfrogging). This means providing green energy technology, supporting education to speed up demographic transition, facilitating access to markets, and ceasing to dominate the food market in the Southern Hemisphere with subsidized agricultural products from the North. In practical politics, this idea ties in with an overall international development partnership. The feasibility of those ideas is often hindered by the well-known problems of bad governance, corruption, and national egoism on any side.
Redistributing energy moneyaims to distribute an equal part of the funds collected from an internalization tax or from EAU auctions to everyone, from babies to the elderly. The effect would be that people with a higher economic power and with intensified activities causing emissions would have to pay more. Yet, they have the means to invest in energy efficiency and will do so because it pays off. People with a substandard income causing emissions below average will also benefit. Consequently, energy poverty could be avoided. Furthermore, people with low income will also get the financial means and the incentive to replace inefficient devices.
What would this mean for an economy as a whole and for companies? Returning to the previous market diagram, the skimmed demand capital does not disappear. It is just converted into goods and services with lower energy intensity and, hence, into green energy technology itself. Thus, economic transition and resource-efficient growth are stimulated.
Subsidizing Renewables
This widely used instrument of environmental politics does not possess the theoretical elegance of Pigovian taxes and certificates. Here the core idea of supporting renewable energy technologies lies in supporting them until they reach market parity. Market parity means that wind energy, solar energy, and other renewables become competitive with fossil energy (even without charging conventional energy with social costs). Green energy technology becomes cheaper according to the experience or learning curve. In empirics and economic theory, costs per unit are going down 25 to 33 percent when the cumulated production doubles. In practice, this effect can be observed very clearly looking at the development of solar cells (see Figure 5.3 ).
Low prices for renewable energies can, of course, also be explained by the fact that their extraction is free (costless sun, wind, growth of biomass), while coal, oil, or gas have to be mined with increasing expenditures. Consequently, subsidies for renewables will not last forever. Hence, as an additional public task, it is necessary to provide the infrastructure for smart grids.
How exactly might subsidizing renewables work? The German Renewable Energy Act was the first law of this type, with variations adopted by dozens of countries. Any investor gets a fixed price for every kilowatt-hour fed into the grid; the focus is on the amount of electricity generated. An investor could be a household with photovoltaic modules on the roof or a farmer operating a biomass power plant. These are examples of microgeneration of energy in contrast to large-scale power plants operated by utilities. Cooperative associations of citizens invest in their own, local energy supply; some rural communities have even reached energy autonomy. Every electricity user pays the subsidy; exemptions are made for energy-intensive industries facing international competition. Based on efficiencies arising from the learning curve, the subsidy is reduced step by step before finally fading out completely.

Figure 5.3 Price of solar panels as realization of the learning curve
In countries doing it this way, the borders between utility companies producing energy and other companies consuming energy become blurred. All companies and even the private sector are merging into the role of prosumers (producer and consumer at the same time).
Triggering the Next Industrial Revolution
Long-range phases of economic growth occurring over decades are called Kondratiev waves, according to a Russian economist. Such industrial revolutions are triggered by inventions that lead to global innovations. The first industrial revolution was triggered by the steam engine, invented by Thomas Newcomen and significantly improved by James Watt in 1769. The proliferation of this new technology brought about economic growth and contributed to fundamental changes in society, politics, culture, and so forth. In brief, people’s entire lives changed from being part of an agricultural society to becoming members of an industrialized world. Figure 5.4 gives an overview of various Kondratiev waves, each marking—in chronological order—different industrial revolutions. Unfortunately, there is no consensus on how many waves have to be counted, and on their exact period of time.
If a wave phases out, its contributions to wealth, business, and lifestyle persist, but the new inventions and innovations have to take over the role of bringing about a new burst of growth. An energy turnaround has the potential needed now. Taking this important step, one is once more reminded of the first industrial revolution, where steam engines were burning coal as a fossil energy carrier. More than 200 years later, we are confronted with global warming as the price we pay for living in our industrialized world. Nevertheless, let us now look at our future opportunities. The previous sections tried to outline what needs to be done, and the advantages of an energy turnaround are absolutely convincing:
- Consequences of climate change can be mitigated.
- New sustainable economic growth is possible.
- Independence from energy imports (autarky) with resulting political and economic effects may be attained.
- Decentralization will help to reduce the vulnerability of cyber attacks and sabotage.
- Cheap (when investments are made), sustainable, reliable energy for future generations is provided (here the three key energy objectives—“triangle of energy policy objectives”—are addressed).
- The investment in decentralized supply with relatively small devices may be organized in a way that citizens control their energy supply. Ultimately, sustainable consciousness and social cohesion are strengthened.

Figure 5.4 Industrial revolutions
Helping the developing countries to leapfrog outmoded paradigms brings about a win–win–win situation: Industrialized countries strengthen their innovative abilities, the Southern Hemisphere gets the chance to grow, and nature can be preserved.
Global Governance
Let us assume a carbon tax is introduced on a global scale and fossil energy is phasing out. Is it possible to maintain the industrial way of life without warming up the earth? In a word: Yes. The technology is available for all people to live in (post)industrialized economies. Hence, the Western way of life may be maintained in most parts with some adaptations. Some (few) compromises have to be made, especially concerning air traffic, but life could be much more pleasant in a sustainable economy. The nominal standard of living could even go up, replacing material goods by services and information; the quality of life could surge immensely. This is the way visionaries such as Jeremy Rifkin (2011) and Jeffrey D. Sachs (2014) promote it.
The dominant obstacle to put the stringent approach into practice can be found in a lack of global governance. We are living in a globalized world; actions taken in one part of the world are bringing about consequences in another region. Consequently, the inhabitants of the global village form a community and have to take responsibility for one another. Thus, the globalized world needs globalized rules. Climate chance confronts us with the tragedy of the commons, the individual rationality exploiting cost-free resources to the point of saturation. The community, a democratically legitimized authority has to establish rules to enforce rationality and fairness. Besides energy, there are many other fields suffering from a lack of global governance: other environmental standards, the tax system (without havens for large fortunes or black money), or human rights.
Green Energy Technology and New Markets
Volatility of Green Energy
What are the inventions and necessary innovations for the next industrial revolution? Technology is needed, but a new energy market design is needed allowing technological options to unfold their power. The reason lies in the green energy technology itself, which can be subdivided into two categories:
- Power plants of different scales are generating energy from renewable sources (sun, wind, water, biomass, geothermal). Figure 6.1 illustrates the current global energy demand in comparison to the potential. Some examples for specific technologies are provided in the next section.
- Technology of energy efficiency. Examples are provided throughout this book covering business domains such as –facility management, logistics, and so forth.

Figure 6.1 Potential of renewable energy sources in comparison to world energy demand
The energy transition is a challenge because of a growing volatility. Wind and sun are the most important pillars of a carbon-free energy supply and they don’t deliver given a “dark dead calm” when the sun isn’t shining and the wind isn’t blowing. Smart energy grids have to be established, and companies and households are part of them.
Electricity has to be considered as the key energy form of a transition. It is most flexible, being able to operate a steel furnace, a conveyor, or a coffee machine. Fortunately, green energy technology produces mostly electricity. And furthermore, gas, coal, oil, and most other energy forms can be transformed into electricity. The other way around is possible too, but most applications are costly and not very efficient. Transforming electricity into other forms of energy offers possibilities for storage. This is important, because a major disadvantage of electricity is that it cannot be stored simply like a fuel, which just fills a tank. Technological options are power-to-gas (producing hydrogen with surplus electricity), power-to-heat (warmed up water used later), or pumped-storage hydropower plants. That means to pump up water from a lower water reservoir into a higher one when abundant electricity is available, and then regenerating the power later.
Renewable Energy Generation Technology
Energy technology is a broad engineering field pertaining primarily to utilities. Here, the opportunities for industrial companies in their roles as prosumers are taken into focus, as this chapter structured according to the source of renewable energy: sun, wind, biomass, water, thermal energy, and heat pumps (for detailed explanations see Capehart et al. 2012, Jeffs 2012, or Li 2011, and also Figure 6.2 ).
Solar power takes the form of thermal and photovoltaic energy (electricity). Thermal energy is used to heat up a medium, typically water or glycol (used to avoid freezing in winter), to provide heated tap water or to support a heating system. This simple technology can be applied for a single building or on a district-level basis. The heat energy may be stored overnight or for some days, depending on the size and insulation of the tank. The potential for tropical and subtropical regions of the world is enormous.

Figure 6.2 Examples of renewable energy sources
Source: www.nrel.gov
Several technologies are available to generate electricity from sunbeams: photovoltaic panels or cells, or large-scale solar thermal systems that use solar towers or parabolic mirrors. Solar towers and comparable devices are used in large power plants, whereas photovoltaic panels may be installed on roofs of houses, office buildings, or production facilities. Solar thermal power plants are built, for example, in deserts, with investors and operators mostly from the electric utility industry. Photovoltaic cells are available to anyone who has an unobstructed roof, ideally directed toward the equator and with a grade about 30. The electricity produced may be fed into a utility net meter or used locally. Relying on solar energy alone can be challenging, because the electricity is only available when the sun is beaming. A battery can serve as a buffer for some days. In countries with frequent breakdowns of the electric grid, solar panels and batteries may bridge a shortage of external supply.
Example Solar Cells on Rooftop
In our private home, we invested in rooftop photovoltaic cells in 2006. The panels cover about 20 m2 with a capacity of 3.4 kW peak. The peak means that 3.4 kW is produced when the sun is beaming with intensity. We harvest about 3,500 to 4,000 kWh per year, covering our demand, which is typical for a household in Germany. The investment is projected to pay off in about 12 years given a static calculation; if we have to replace the inverter module, it could be extended. The useful life can stretch over decades, because most components are not exposed to mechanical stress. Thus, it is a profitable investment—and it feels good to achieve our family’s electricity needs, carbon free.
Wind energy plants are operated on a wide scale as well. Some large offshore wind farms need investments of billions, which come mostly from consortiums of utility, venture capital, or public investors. Large wind turbines are as high as a cathedral and provide in the order of 5 MW and are so efficient that they use 40 percent of the wind energy streaming through the area covered by the rotor. Four square meters of this area is sufficient to supply an average household in industrialized countries. Smaller devices of a few meters height can be installed on rooftops. They are not very proliferated, because they need large, windy areas not disturbing any neighbor. Their efficiency is lower than large “windmills”, but this interesting segment should be observed.
The use of biomass can be as simple as burning wood. This can make sense in regions with lots of forests and advanced burning technology, for example, modern furnaces supplied by woodchips or pellets. This traditional form of use is bringing about deforestation in many countries, especially in the Southern Hemisphere. Grime and smog are undesired side effects in cities.
An advanced form of biomass is the production of methane gas and heat from agricultural byproducts, especially dung and manure from cattle breeding. The burnable methane gas may be fed into pipelines for natural gas or burned on site, generating energy by a turbine.
Moreover, energy plants like corn, sugarcane, or rapeseed provide raw material for bioethanol (a form of alcohol replacing fossil gasoline) or diesel. Ethanol is a common additive in U.S. gasoline, and in Brazil, most cars have biofuel motors burning ethanol produced from sugarcane. Controversy arises because one tank load of an average car needs so much corn that a person could live on it for one year.
Water energy is available in a variety of forms and options for practical use. The historic form of watermills serves as an example, but today the kinetic energy of water is transformed mostly into electricity by turbines. Large dams in rivers are projects for specialists, and they raise some ecological objections. Small-scale technology such as turbines put into quick running brooks has some potential. In countries with dense regulations of water usage the allowance is complicated; for example, fish travelling to its spawning ground should not be obstructed. Offshore wave energy or tide currents of the oceans have been in development for years.
Energy of earth, water, or air can be used with heat pumps. The principle functioning can be made clear in a simple way: Just imagine installing a refrigerator in a window of a house, with the refrigerator door outside and the back of the fridge inside. On the back are the tubes getting warm when the inside is cooled down in normal operation. In this installation demonstrating the operation of a heat pump, the back of the refrigerator will heat the room and—on the other side—cool the air outside. If a medium like air, water, or soil has a temperature above -273.15°C (-459.67°F, absolute zero), there is still energy contained. A heat pump concentrates this energy. Assuming optimal conditions, 1 kWh of electricity will produce 4 kWh of thermal energy for heating purposes.
The refrigerator analogy describes an air–air heat pump. Digging or drilling into the ground offers a constant temperature of about 8°C or 46.4°F. This is an advantage for heat pumps if the air is cold in winter. In summertime, the energy flow can be reversed cooling down facilities with minimum energy intensity.
Transformation of Energy Markets
The traditional energy market for electricity is comprised of suppliers (large private or communal utility companies) and customers (households and companies without their own energy plants). Operators of electric grids (often, the suppliers themselves) play a minor role because production and demand are easily schedulable. Power is produced in large plants relying mostly on coal.
A lot of new green players are appearing on the production side, taking over parts of the business model of traditional utilities. Deregulation keeps the thresholds to enter the market low. Grid management and production are separated to avoid vertical cartels. Volatility of green energy generation is leading to fluctuating prices in energy exchanges. Figure 6.3 illustrates the most important players in the new rising markets and their interaction.
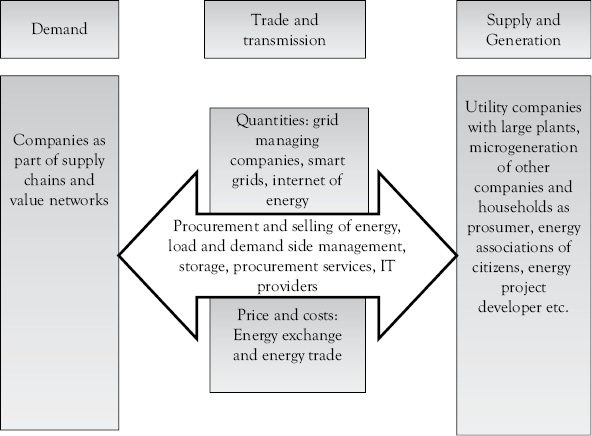
Figure 6.3 Players in the new energy-related markets
The important points for nonutility companies: They appear two or even three times in the figure. First, they are on the demand side, like traditional energy markets. Second, they appear on the supply side as prosumers. Third, they have the chance to balance supply and demand through demand-side management, load management, or energy load balancing. This means, for example, that the industry starts automated operations consuming energy when prices are low; the following section will provide detailed information on this. This trend will keep the industry busy in the coming decades. An indicator for its importance can be derived from the German energy exchange. At times, electricity is not only cheap, but it may even turn the price negative during hours of large supply and little demand. Figure 6.4 displays an example.

Figure 6.4 Example for negative prices for electricity at the exchange
Source: www.eex.de
Consequently, this means that consumers are paid for their energy consumption, for example, on a summer Sunday with good weather and windy weather in offshore wind farms. In 2013, 253 h of negative prices had to be stated at the day-ahead market.
Further conditions have to be met in order to make demand-side management (or load management) profitable. The physical scarcity or abundance of energy in the electric grid has to be reflected in the prices of the exchange and must be transferred into the accounting and planning system of the companies (Chapter 20 on energy procurement will explain how this can be effectuated).
The maxim “prices have to speak the truth” has to be followed not only in the sense of internalizing external costs. Prices have to convey information about scarcity at a frequency of 15 min or less. Designing new energy markets via legislation, the price at the exchange should make up the dominating component of the end price for the industrial and private consumer. Signals of scarcity are reduced if a constant tax, net toll, or subsidy fee per kilowatt-hour is imposed. If such taxes were not constant but are the percentage share of prices, the volatility of costs would increase. Thus, load management is more profitable and—in the end—the physical balance of the grids would be improved.
Smart Grids and Demand Side Management
To tackle those challenges, energy grids have to become smart. Smart grids (or intelligent energy networks) are combining all assets of energy generation, energy transport, grid management, conversion, and energy usage to ensure efficiency, reliability, and sustainability. This definition extends the conventional understanding, limited to electricity, to every form of energy. This is necessary because energy conversion and storage are making use of different forms of energy (power-to-gas, power-to-heat, etc.).
To explain the functioning, potential, and consequences of smart grids for companies, we will examine three steps here:
- Smart grids on an international level facilitating a green energy supply over multiple continents, as illustrated by the Desertec Initiative
- Hands-on applications for everyone in the household (smart home)
- Load management, demand side management, and net balancing for companies
The Desertec Foundation (www.desertec.org) was supported by large companies planning a grid from Iceland to Arabia, fed by different forms of green energy generation (see Figure 6.5).
The abundant space in North Africa and Arabia could be used for solar and wind farms, Norway with its pumped-storage hydroelectric plants serves as a buffer for the system, and high-voltage direct-current transmission transports the electricity to the consumers. A business person does not need to learn by heart high-voltage direct-current transmission or understand in detail how it works. It seems enough to know that electricity can be transported over thousands of miles with only a few percent loss, even under the sea. The technology for such a renewable energy supply is available.
Unfortunately, the feasibility faces severe obstacles and only elements of the whole project will be set into operation: Political instability in involved countries, investments of hundreds of billions, and technological advances could topple the calculation. For example, after the design of the whole project, on-shore wind energy is emerging as the cheapest form of green energy (and fossil energy as well if externalities were included). Thus, local solutions in the hand of citizens could outpace the megaproject of global players. Nevertheless, some features of this vision could realize their potential in the long run. The larger a grid, the easier it can be balanced. A storm band running first over France, then reaching Germany, and finally covering Poland will supply the whole grid with wind energy, even the regions with dark dead calm. We should conserve this idea of international cooperation for coming decades with hopefully more political stability and trust between nations.

Figure 6.5 Smart grid planned covering continents
Source: Desertec Foundation*
Let us now turn to smart homes, practical applications of smart grid technology are available today for everyone. Smart meters already constitute important elements of smart grids (Figure 6.6). Companies may of course make use of this technology as well, in offices and as the basis for more elaborate applications in operations.

Figure 6.6 Smart meter
Old-fashioned meters have to be read by a person, mostly from the energy supplier, on a regular basis, to produce an invoice. Smart meters are part of the Internet of Things. They possess an IP address, and inhabitants as well as utility companies can read them online using W-LAN and Internet. A simple application would be to check the current energy consumption on a laptop and switch on or off electric devices. Thus, the load is measured, energy-conserving behavior encouraged, and ideas for efficiency, by replacing old devices, generated. Load management is an intended form of smart meter application, for example, starting a washing machine when electricity prices are low (where tiered rates are available).
Utility companies or others looking into the exact load of a home will raise privacy issues. The exact load curve contains a profile of personal habits, even the TV program viewed can be detected by experts.
Google Acquires Nest
In 2014, Google bought Nest, a vendor of thermostats and specialist for home automation, for over $3 billion. The generation of data should be the driving factor for Google to enter this market. The trend toward smart homes and energy conservation involving smart grids pushed this decision. From the side of energy controlling, interesting features are developing:
- Temperatures of different rooms can be remote-controlled even by cell phones from a large distance.
- If Global Positioning System (GPS) indicates that an inhabitant is approaching his home, heating or air conditioning may provide the desired temperature automatically.
- Intelligent systems will learn about the habits and calculate an optimal setback temperature, concluding if the person leaves the house for work or for a short errand.
- Different forms of load management can be affected, involving batteries of cars, microgeneration by block heat and power plants, or photovoltaic cells.
- Predictions of energy demand or even generation are important information for grid operators.
Companies have great potential to take advantage of load management, demand side management, or net balancing. They will grow into their prosuming role of being an active player in a smart energy grid. Table 6.1 systemizes some example options of load management.
An extremely interesting point is that the importance of negative regulatory energy will grow; this means that companies will get their energy very cheap, or they are paid for the use of surplus energy in the grid. Investing in green energy plants increases the existing conventional energy supply, slowly replacing energy from conventional sources. The load installed has to be higher than the maximum load on the consumption side, because sun and wind don’t produce constantly. Consequently, a market design has to be found to reward companies for being able to store energy and to schedule consumption into phases of abundant energy generation. Many relatively small assets combined in a load management can be called swarm energy forming a virtual power plant. A critical point will be to limit the rights of a grid operator to interfere in the operations of an industrial company.
Table 6.1 Sample load management opportunities
|
Positive balancing or positive regulatory energy Demand larger than generation in the grid Frequency falls below the intended grid, frequency (in many countries 50 Hz) |
Negative balancing or negative regulatory energy Demand smaller than generation in the grid Frequency exceeds the intended grid, frequency (in many countries 50 Hz) |
|
Accelerate generation:
|
Reduce generation:
|
|
Reduce energy consumption:
|
Increase energy consumption:
|
Water and Energy
Water has the potential to generate energy flowing in rivers, in sea currents, or by waves. Switching the perspective, energy makes water available for humanity. Drinking water and water for agriculture are of vital importance because they cause or aggravate conflicts in arid regions. Here, the impact of energy for a sustainable and peaceful world becomes clear. The role of energy for the
- Availability of drinking water
- Transport or treatment
- Disposal or reuse
These energy roles will, thus, highlight the problems and chances.
Theavailability of drinking water can be assured by desalinating sea water, an energy-intense procedure. There is large potential, because human settlements prefer coastal regions, and sea water will not run out. Ideally, solar and wind power stations should supply the desalination facilities, if enough space is available. This method is much more costly than just taking the water from a river or lake, but there are several examples that the potential of inland waters is reached or exceeded (Lake Tahoe in California, Lake Aral in central Asia, or the Jordan River in the Near East).
Ground water lies at an average depth of 100 m under the surface. Due to the extensive use of this resource, the level is going down in many wells. A person can deliver about 1 kWh a day, which would be enough to pump 1 m3 water from a depth of 100 m up to the surface. This number demonstrates again that energy has a great effect on the availability of water in less developed countries.
Transport and treatment are the next steps in the chain. Many people do not have access to running water, or even a water closet, as a desirable hygienic standard. Again, energy is needed to pump the water to the location of use. In most cases, the water has to be treated before people may consume it. The necessary operations rely on pumping and other energy-related services.
Disposal or reuse will have to be focused even in countries were waste water is still dumped into rivers. Treatment has to be applied to prevent pollution. Thus, the dirty water has to be pumped through pipelines, delivered to treatment facilities, or transported to the location of further use, for example, in agriculture. An intermediate solution with little efficiency and elegance is transport with tanker trucks.
Summing up, energy and water are crucial factors for economic and sustainable development. Water can easily be stored, for example, desalinated water can be stored in elevated (high-level) tanks to assure transport with natural pressure. If tanks are filled in times of abundant electricity, the water supply system could even contribute to balance energy grids.
Big Picture
The complexity of businesses is increasing: Globalization poses the challenge to work with different cultures and to respect various import and export regulations. Product innovation cycles are becoming quicker and products themselves more individualized (mass customization). Companies are bound to different networks, while, at the same time, quality requirements are getting higher. Moreover, energy is adding to complexity with surging costs and the need of data logging, data processing, management methodology, and organizational requirements. Since the computer revolution of the 1960s, new technological possibilities have been constantly integrated into companies. First of all, large centralized computers provided operating power. Furthermore, personal computers, and the decentralization they brought along changed the architecture of IT networks. The appearance of the Internet has been another big milestone and game changer. Currently, mobile and cloud are of vital importance for the IT industry.
Thus, is IT adding to complexity or a factor of alleviation? The role of IT certainly is contradictory: On the one hand, IT definitely is a business challenge since opportunities have to be observed and implemented in company functions and, on the other hand, IT enables companies to meet the complexity arising from other sources. This chapter will explain IT trends that will keep businesses busy in the near future by applying this knowledge to the field of energy.
Green (environmental or sustainable) IT as a whole and energy-oriented IT, specifically, are divided into two fields of application:
- IT serves as a tool in all business domains allowing energy efficiency and sustainable energy supply. These opportunities and potentials of IT will be sketched in the following. This development can be denoted as computer aided energy management (CAEM).
- Green IT, in a narrow sense, seeks to optimize the life cycle of computers of all sizes. In Chapter 26, the energy aspect is discussed.
A Workshop with SAP
To identify and assess the current trends affecting energy and IT, Christian Lenze, Vice President Product Strategy at SAP, and I took the time for a workshop. We concluded that the resource in enterprise resource planning (ERP) has to be redefined following the overall need for sustainable development, and looking at the empowered tools of IT. What this means in detail is explained with the help of the next figures. Apart from Christian, I would also like to thank Matthias Settele who helped me to understand the cutting-edge of energy and IT.
Business is confronted with new challenges, but at the same time endowed with innovative instruments, as Figure 7.1 summarizes it.
The redefinition pertains to the methods connected with energy and carbon outlined in this book. Figure 7.2 links the three columns of sustainability to the type of resources tackled by IT tools.
Ever since it was the aim of business (the profit dimension of sustainability) and ERP to provide the means to use material, money, machinery, and manpower (persons) effectively, economic success was ensured. We are now in a second wave (planet dimension) integrating ecological resources systematically. It will be an exciting challenge for the future to find a way of living on earth, conserving resources for our children while living a happy life (people dimension).

Figure 7.1 Challenges and tools redefining R in ERP

Figure 7.2 The big picture of sustainability and IT
Evolution of IT as an Enabler
To explain the impact of this big picture on the way of utilizing IT in a company, Figure 7.3 shows the development and current options.
In the figure, the first level of IT applications contains stand-alone solutions like Excel spreadsheets for energy reviews and balances or energy reporting. They can amend established cost accounting with additional key performance indicators (KPIs). While advising practical thesis projects, I was sometimes astounded that high-tech companies with powerful integrated IT solutions were going this way. It could be called “quick and dirty” or seen as pilot projects. Integrating new (energy) aspects into large software packages is quite costly: The software vendor has to do the customizing. KPIs of different periods cannot be compared if it compromises the accounting system, and further lessons learned will bring more effort. In consequence, gathering experience through pilot projects (with the support of a cheap but well-educated student doing her or his thesis) may be a good beginning. However, managers should not stop here or they may be vulnerable to all of the disadvantages of stand-alone solutions. The data stand alone and interfaces have to be constructed to feed the sheets and to use the results—if it is not done by hand. In most cases, the programmer of the system has a unique know-how. If he leaves the department, the solution could be doomed. Consequently, after gathering experiences with such stand-alone solutions, they should be migrated into existing software.

Figure 7.3 Evolving tools of IT
Cross-functional software like ERP systems support business domains end-to-end with planning tools for management and accounting. ERP is looking at the operations from the business side; the technological aspect is brought in by data logging which is the interface to the technical world. The emphasis is on one company with some outbound aspects, for example, on the supply chain management. ERP accesses integrated databases. Standard procedures of production planning, logistics, and other functions are customized and supported. Financial accounting describes operations and supports, reports inside, and discloses outside.
Business intelligence(BI) is contributing to the sophistication of management by answering questions that extend daily operations by far. Standard applications are performance measurement and management, supply chain management, or marketing. As an example, marketing wants to know how many of the customers who buy product A also buy product B, where they are living, how they were impacted by marketing measures, how they are paid, and so on. To get the answers, data warehouses have to be configured, containing internal information (customer addresses, products bought, and so on) and external data (linking post codes to regions, browsing the Internet for additional information). Here, Big Data enters the game as well as problems of privacy. To make use of data warehouses, on-line analytic processing (OLAP) can be formulated to answer the questions before marketing, as an established application, will enhance energy (see Chapter 14 on management accounting with its section about “The Cutting-Edge”).
In-memory databases (IMDBs), Big Data, and the Internet of Things(IoT) are empowered by the cost decline of computer chips. IMDBs only transform the data into random access memory (RAM) that is available for user applications seemingly without limits. SAP HANA is an example of an IMDB; when combined with ERP, it enables a more sophisticated planning in all business needs. Exceeding the boundaries of a firm, Big Data symbolizes the intake of everything available on the Internet. A combination with the technical side of business and life is IoT: Devices in companies and households are getting an Internet IP-address and can be connected, monitored, and controlled via remote. It is, to put it a bit deridingly, the Internet of Everything. In the case of energy, the challenges of renewables and smart grids are meeting their counterparts (Internet of energy).
The real world meets the digital world as every asset that is automated and digitally programmed delivers data and might even control other assets. The same applies to every machine, air conditioning unit, and truck contributing to the challenge of big data. Where is the data coming from? Figure 7.4 provides some sources of data generation and conveyance.
The availability and ability to process data seems to be unlimited. The limiting factors are the methods applied, the organizational habits of firms, and the way of thinking of humans. In the past, IT, due to its complexity, was mostly the limiting factor for progress. Nowadays, this role is taken by human brains. Cloud computing, mobile computing, ubiquitous computing, visualization tools like management cockpits, ambient intelligence:Let us interpret these buzz words as an attempt to help people use these new options. Figure 7.5 gives an insight of how management can be supported by dashboards or management cockpits.

Figure 7.4 Data logging of energy in the Internet

Figure 7.5 Example of a management dashboard
Source: SAP, www.help.sap.com/eei10
What is required besides technical equipment? Companies need enough people to understand the new E2E (electronic-to-electronic or end-to-end) processes and to be capable of implementing new applications and networks. Every business domain is touched, standing alone, and interacting: Logistics contributes to improve customer relationship management (CRM), ambient intelligence is revolutionizing facility management, design has to consider recyclability, management accounting needs to extend to an integrated reporting—the list could be continued.
It is obvious that the applications of these evolving tools are almost ubiquitous in the field of corporate energy, but they will impact most business functions, enabling better planning and control in production, logistics, facility management, and so on. Consequently, the business domains will be able to cooperate in an intensified manner accessing the same sea of data by using integrated, intuitive IT tools and following well-defined, cross-sectional procedures, as Figure 7.6 shows.

Figure 7.6 IT supported interaction of business domains
It seems exaggerated to state that functions are melting together, but cross-sectional, networking collaboration will be a key to operational efficiency and success. The rising challenges are turning into significant opportunities through revolutionary technologies making their way into the mainstream. Summing up, companies have to control their operations with an intensity that was unimaginable some years ago.
Public Awareness, Legitimacy, and Disclosure
More and more people are aware of the difficulties and flaws inherent to a market system. Thus, they question the role and the legitimacy of companies. Companies are under pressure to justify their actions, especially if the critical stakeholders are customers bringing in the revenues. Companies investing are gaining a strategic advantage preparing for a more knowledgeable customer. Consequently, integrated reporting is going mainstream and is boosting sustainability in companies.
There are numerous standards and frameworks structuring the disclosure:
- Global Reporting Initiative (GRI)
- ISO 14000 series standards for environmental management systems
- Sustainability Accounting Standards Board
- International Integrated Reporting Committee
- The Sustainability Consortium (TSC)
- The Carbon Disclosure Project (www.cdp.net).
Every standard and balance contributes to the triple-bottom-line definition of sustainability according to its acceptance. The GRI homepage offers an insight into the market of sustainability certification; tens of thousands of companies are registered, and disclose their reports on the website (https://www.globalreporting.org).
The most tangible way to assess those certificates is done by applying the systems of key performance indicators. What do the companies reveal about their performance and their methodology? ISO 50001 does not really contribute to this (Chapter 14), because it is mandatory to use energy performance indicators (EnPIs). The standard, however, does not determine which ones. It will become clear that it is in the company’s best interest to be explicit. Here, IT enters the game. The new opportunities allow companies to identify and publish many, detailed EnPIs (this thread will be followed in Chapter 17 about marketing).
Socio-Economic-Environmental Balance
Some companies go ahead and develop their own standards. An example is BASF, the world’s leading chemical company, developing a socio-economic-environmental analysis named SEEBalance (Figure 8.1).
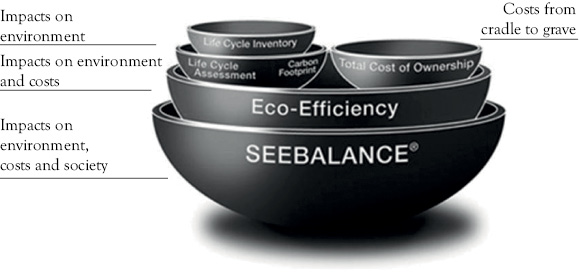
Figure 8.1 Socio-economic-environmental analysis
Source: SEEBalance, www.basf.com/group/corporate/en_GB/sustainability/eco-efficiency-analysis/seebalance
One could say that companies that inform their stakeholders by public disclosure systems are courageous in a way. They have to invest in human resources or internal accountancy efforts to maintain the project. Moreover, they risk the possibility of a bad performance presented to the public. Furthermore, they are caught in the system because a withdrawal will be noticed, damaging the company’s image. Knowing this, organizations managing these disclosure systems keep the requirements quite low for participants; the aim is to lure companies into the system of continuous improvement, like ISO 50001 does. In many countries, the core of the economy is a variety of small, medium, and family businesses, which are even more important than the “blue chips.” Therefore, ISO 50001 only states that EnPIs in any form and baselines are formulated to trigger and measure the improvements.
Conducting a credible disclosure in all fields of sustainability, the principles of financial accounting have to be transferred and met: relevance, materiality, completeness, inclusivity, consistency, transparency, and exactness or accuracy. Companies investing are gaining a strategic advantage preparing them to compete for a more knowledgeable customer.
Cross-Reference Table ISO 50001 and Business Administration
This cross-reference table provides the structure of the main part of the book, linking the table of contents of ISO 50001 in the left column to business functions on the right. In the table of contents (ToC) of ISO 50001, only Chapter 4 is of paramount relevance. Thus, only Chapter 4 is referred to in Table 9.1 .
Table 9.1 Cross-reference ISO 50001 and business domains
|
ToC of ISO 50001 |
Energy-oriented business administration: business functions |
Chapter no. |
|
4 Energy management system requirements 4.1 General requirements 4.2 Management responsibility 4.2.1 Top management 4.2.2 Management representative |
Structural organization of energy management |
10 |
|
4.3 Energy Policy |
Relationship between energy policy and strategic planning, business ethics, and corporate social responsibility (CSR) |
11 |
|
4.4 Energy planning 4.4.1 General 4.4.2 Legal requirements and other requirements |
Compliance management helps to fulfill all external, internal legal, and other requirements |
12 |
|
4.4.3 Energy review |
Linking energy reviews or balances to accountancy:
|
|
|
4.4.4 Energy baseline 4.4.5 Energy performance indicators (EnPIs) |
Managerial accounting, for example, EnPIs and energy-oriented balanced scorecard (BSC) |
14 |
|
4.4.6 Energy objectives, energy targets, and energy management action plans |
Investment appraisal: Identifying profitable investments with methods such as total cost of ownership (TCO), optimal replacement point, sensitivity analysis, energetic amortization |
15 |
|
4.5 Implementation and operation 4.5.1 General 4.5.2 Competence, training, and awareness |
Human Resource Management (HR): Communicating an energy management system inside the organization |
16 |
|
4.5.3 Communication |
Marketing and customer relationship management (CMR): Taking into account the informed customer using sustainability apps and Big Data |
17 |
|
4.5.4 Documentation |
Quality Management: Documentation of integrated management systems explaining the ways and perspectives of integration |
18 |
|
4.5.5 Operational control |
Maintenance: smart metering, management cockpits, mobile computing |
19 |
|
4.5.6 Design 4.5.7 Procurement of energy services, products, equipment, and energy |
Energy in further corporate functions
|
20 21 22 23 24 25 26 |
|
4.6 Checking 4.6.1 Monitoring, measurement, and analysis 4.6.2 Evaluation of compliance with legal requirements and other requirements 4.6.3 Internal audit of the EnMS 4.6.4 Nonconformities, correction, corrective action, and preventive action 4.6.5 Control of records |
Control and audits |
27 |
|
4.7 Management review |
Internal revision |
28 |
Eccleston et al. (2012), Howell (2014), and Welch (2011) describe the requirements of ISO 50001 in a detailed way. Simon et al. (2011) and Welch (2011) focus on the integration with environmental management.
Organization (Management Responsibility—ISO 4.2)
Overview
Addressing the organizational side of ISO 50001, the three areas of organizational theory are touched on and may be consulted for advice (basics of organizational theory are assumed as known).
The first area is the organizational structure. This is addressed explicitly in ISO 50001 Section 4.2 describing the role of top management, their representative (energy manager), and energy management team. This field is discussed in the following chapters.
The second area is process organization. Procedures have to be fixed, described, and taught to the ones executing them. A lot of energy-related processes are cross-functional or even relate to other companies in the supply chain or value network. Consequently, workflow management has to be enhanced, or new procedures must be defined, assured by IT support. Most topics like procurement, maintenance, and so forth are linked to some form of procedural implementation. Following are a few examples:
- Energy demand planning, procurement, and load management
- Procedures of good housekeeping in facilities management
- Standards of energy reviews, reporting, and disclosure in accountancy
At this point, the connection to quality management (QM) and environmental management is of extreme importance. These management systems can be enhanced meeting the needs of energy. The practical tools of process organizational work shed light on what has to be done, here are a few examples:
- Handbooks for organization, QM documentation (see Chapter 18)
- Checklists for procurement
- Flow charts to introduce new personnel
- IT workflow management (templates are developing as the specific know-how of specialized IT-producers or consultants)
- Checklists, specifications, and forms of consulting (or certification) companies
A balance between advantages of specialization and advantages of working together (integration) has to be found. The contents of what has to be integrated into the organizational procedures are described throughout this book.
The third area of organization is project organization or change management (which is not always identified as separate field). The processes of energy are mostly interdepartmental. Let us not be deceived: Implementing an EnMS means a fight for power between the departments. The energy manager will have an influence on the investment budget, on the workload of staff, and on internal reporting and performance evaluation of organizational units. Chapter 29 in this book will introduce some guidelines for how to avoid resistance and other hurdles by introducing EnMS as change management project.
Energy Management in Structural Organization
How is energy integrated into the structure of a company from an organizational point of view? Section 4.2 of ISO 50001 enumerates many duties of top management and their representatives, which can be read like a summary of the standard. The core idea is that energy is a topic for top management; in branches with a high impact of energy costs, this is self-understanding. If a company is heading for a certification, top management has to trigger the project and review it (according to 4.7 in ISO 50001). The standard assumes that top management is able to appoint a representative who can do the work; in most firms, he will be titled as the energy manager. He has to have the skills, responsibility, and authority to push forward all relevant energy topics on all organizational levels. The representative can be supported by an energy management team.
How powerful is the energy manager? The standard specifies that he has to be endowed with the authority covering all the topics mentioned (ISO 50001: 2011, 6). It is not stated clearly if this authority just contains the right to advise the line managers from a staff unit or if he is in the power of command. Three different levels are differentiated:
- An energy manager with advisory function in a staff department.
- A staff unit endowed with dotted-line competencies.
- The energy manager institutionalized in a high-rank level in the line.
Figure 10.1 illustrates the first option of an energy manager holding an advisory function in a staff department.
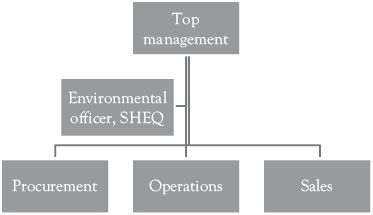
Figure 10.1 Energy manager as advisory staff

Figure 10.2 Energy manager with dotted line competencies
In some countries, environmental officers are imperatively mandated as advisors of line managers, and they are not allowed to be in the line of command themselves. The reason is that better surveillance of environment law using the four-eyes principle. In consequence, the role of the environmental officer is restricted to advising, initiatives, and monitoring. The same structure is common (but not excessive) in the fields of safety, health care, quality, and some others. The name of the staff unit could be Safety, Health, Environment, Quality—an overview of other fields was given in Chapter 2. Energy could be easily added to fulfill the formal requirement of the standard (there is someone in charge), but it is dependent on the will of top management and the personal charisma of the energy manager, which may be enforced in the organization.
The second level of empowering the energy manager includes installing him in a staff unit endowed with dotted-line competencies, as Figure 10.2 demonstrates.
That means he has real power over people, assets, and money in the realm of the department managers in issues pertaining to energy. The interfaces are complicated to define—a problem that cannot be avoided in any case, because the nature of energy is cross-functional. In small and medium enterprises (SMEs), one person often carries two functions. It means, for example, that if the chief operating officer takes on the tasks of an energy manager additionally, then he appears twice in the organizational chart, in the main function in operations and in the staff department.
The highest level of power for the energy manager means to install him on a high-rank level in the lineor in the board of directors itself (see Figure 10.3).
The job should be taken over by the top manager who is responsible for the most important energy consuming assets in the plant. Top level energy managers should have enough know-how and time for their work and the support of a dedicated team. This solution could bring about quick implementation of decisions.
What about large companies and other forms of structural organizations? Large companies with a matrix organization need to find an individual solution of implementation that will depend very much on the branch and history of the firm. In most cases, energy will be built up alongside the quality and environmental aspects of the organization.

Figure 10.3 Energy manager on high-rank level in the line
In concerns, a centralized energy management has to be built up and coordinated by regular meetings of the energy managers of the group’s companies. Additionally, the know-how of the business domains in the companies must be exchanged and economies of scale tapped. This means, for example, that:
- Energy procurement is centralized for the whole group to increase purchasing power.
- Energy representatives for facility management, logistics, and so forth are named and share their experience.
- Lessons learned in different countries and continents are exchanged by energy representatives of such regions.
Even in large groups, companies don’t necessarily have to hire a new person on a new position for each representative mentioned. But, it should be made sure that a contact person acquires the new knowledge in the dynamic field of energy, and that this expertise will be shared for the benefit of the whole group. Regular meetings and other tools to share know-how exist in most groups focusing on established business functions. The energy management team should make use of those structures assuring that their themes are listed on the agenda of the existing routines.
Assigning Licensee Responsibilities
The organization wants to reach a unity of task, responsibility, and competence for every position. In business studies, the standard method is to assign tasks to workplaces in structural organization and to define procedural workflows interdepartmental. From the side of energy, this model should be extended to equipment; especially, facility management requires official approval for operation. Every technical asset has to be assigned to a workplace that:
- Has the task to cover all licensee duties;
- Is responsible if something goes wrong; and
- Has all necessary competencies to be successful.
Some examples from the energy field explain the importance:
- The production of microchips needs air-conditioning technology for clean rooms. If facility management forgets to change filters generating dust in the room, the current production will be spoiled causing high damage.
- Exothermal chemical reactions produce heat as long as material for the reactions is available (lighting a match is an example). Synthetic resin or nuclear power plants depend on a reliable cooling system. If they are shut off for maintenance without coordination of operations, a blast with casualties could follow.
- If the tubes of compressed air frequently running in the basement are not checked regularly, leakages could go undetected. A leak of a few square millimeters can easily cause energy cost of thousands of dollars a year.
Company Example Chemical Industry
Conducting a consulting project in a large chemical plant in my previous position as environmental consultant, my team had to implement a corresponding management system. An important element was to establish a register of licensee responsibilities, a biunique assignment of every relevant technical asset to departments or even workplaces. The project was triggered by the board of directors. As a registered legal entity, the incorporated enterprise itself has the role of licensee for all assets requiring approval of a public authority. The board of directors has legal responsibility to uphold this duty. Through this project the board fulfilled its organizational duty.
Thus, the following has to be considered when assigning workplaces to equipment:
- The mapping has to be unambiguous.
- It has to be complete in the sense of covering every legal requirement and technical necessity in the given situation.
- Such a register should be integrative, including aspects of energy, environment, quality, safety, operations, and so forth.
- On the side of structural organization workplaces (in SME often persons are addressed), substitutes must be named covering all relevant times of operation.
- Looking at different types of operations, all conditions have to be covered including regular production, maintenance, tests, and audits of all kinds. The preparation of emergency plans is of utmost importance in many branches. Many, very different departments and external entities (service companies, utilities, firefighters, etc.) will be involved.
For documentation purposes, many tools like handbooks, registers, and catalogs—preferably in digital, online format—may be used. Here are close links to the chapters about compliance management and legal requirements (Chapter 12) and quality management and documentation (Chapter 18).
Corporate Ethics and Strategic Planning (Energy Policy—ISO 4.3)
Overview
ISO 50001, in Section 4.3, requires adherents to issue an energy policy. The example in the following box shows that the core ideas and element of the standard should be reflected.
Energy Policy
Minimum Requirements to Meet ISO 50001
We improve our energy performance continuously by setting and revising energy objectives and targets. Necessary information and resources to achieve objectives and targets are provided. We adhere to all legal and other requirements, purchase energy-efficient products and services, and design energy performance improvements. This energy policy is documented and communicated at all levels in our company.
Addressing Moral Core Ideas
An energy policy being close to the formulations of the standard tends to appear like a legal paragraph, summarizing the most important elements and keywords. However, a policy should be much more, reflecting the company’s corporate social responsibility (CSR), culture, and basic values. So don’t feel inhibited and express your organization’s mission and vision using terms like responsibility for our children or fight global warming. Express your thoughts and concerns how profits may be reduced or fostered by striving for energy efficiency and renewables. Address and consult the internal and external stakeholders to make the energy policy a valuable instrument of mission building helpful to leadership and participation.
Company Example Tata Power
Tata Power is India’s largest integrated power company with a hundred years of history, starting a hydro-electric power plant in 1915. Ever since, the vision of the founder J.N. Tata influenced the company: “In a free enterprise, the community is not just another stakeholder in business but it is in fact the very purpose of its existence.” This serves as a landmark for the corporate policies concerning fields like sustainability, environment, or energy conservation. (http://www.tatapower.com/sustainability/policies.aspx).
The formal side of this requirement is easily met; a paper signed by top management and other officials such as energy representatives has to be communicated within the company. In contrast to this minimum, the impact of an energy policy can be considerable. The policy should be the lighthouse giving long-term orientation, requiring a strategy that has to be operated on basic values. Embedding the normative and strategic goal setting, planning, and management, Figure 11.1 contains five levels with various time ranges. The two top levels are not covered by the usual canon of business studies, but it seems to be justified to integrate them here because of the societal and political dimension of energy management.
Organizations as lobbyers influencing legislation may exercise a considerable influence redesigning energy markets. In principle, this is as an important element of a vivid and living democracy in which stakeholders of governmental action are involved and may contribute. If exaggerated, lobbyism poses a threat to democracy, because massive influence on legislation is exercised in a nontransparent way. In this book, Part II introduced basic decisions and interests a company could have on this level. Nevertheless, further details of lobbying with egoistic or altruistic motivation will not be followed.
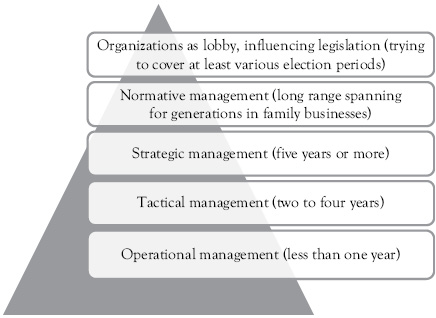
Figure 11.1 Levels of goal-setting, planning, and management
Normative managementintroduces basic values and the ethical dimension into organizations. This aspect will be covered in the following, proposing different ethical theories as foundation of an energy strategy.
Strategic managementhas to bring values closer to action. The standard methods of strategic planning have to be applied and adapted to meet the upcoming energy challenges. Some examples will be sketched in this chapter. A critical point will be the intangible advantages of a proactive long-term strategy. I’ll present my own model for how different ethical theories and strategies match with one another.
Tactical management has to be mentioned, but in business studies, and many companies, planning it is not visible by its own methods and tools. Consequently, this level will be merged with the strategic one.
Operative management and control cover energy planning activities with an impact lasting for less than one year. Many sections of Part III will provide corresponding methods and examples.
How to work with this hierarchy? The theoretical way of planning is top-down: First basic (ethical) values as foundation of an (energy) strategy are broken down into tactical planning and operational management. ISO 50001 implies this way of proceeding. Practical management often starts bottom-up: First, attainable, realistic targets are set, building a basis of strategy. To be on the safe side, management tends to set targets modestly, thus, it is easier to overachieve. To combine both, a principle of countervailing influence can be recommended. A top-down visionary big picture has to be grounded by involving a realistic view from employees’ bottom-up.
Unfortunately, some companies feel compelled to issue well-sounding and far-reaching policy papers, trying to exceed the competitors. Certification can hardly set a limit, because policies do not contain accountable, measureable targets. If a visible gap between visions claimed and factual action opens up, the effect of an energy policy may become adverse. Credibility of top management, the leadership style in a company, and energy management as a whole may be damaged. This remark pertains to quality, environment, and all other fields of policy formulation as well. Corporate culture research has revealed the great power of a credible vision contributing to shared values in an organization. This chance should not be missed in the case of energy.
It might be a problem if integration arises, because policies, guidelines, visions, and codes have to be formulated for a number of fields, for example, quality, environment, energy or carbon, leadership, nondiscrimination, compliance, business in developing countries, and so on. Large companies publish dozens of pages. For small and medium enterprises (SMEs) the integration will not be so explicit, but the need to cover the same fields has to be stated. What to do? Go ahead and formulate what has to be said for your organization. Be individual and credible by truly involving the people in the company.
Methodology: A Short Model of Model-Making
The famous article of Milton Friedman in The New York TimesMagazine in 1970 “The Social Responsibility of Business Is to Increase Its Profits,” remains relevant. The flaws of a market system regarding fossil energy supports the view that the normative level cannot be neglected. Hence, what is ethics and how can it be introduced into management as an approach of applied science?
Ethics can be explained as thinking about basic values in a systematic way. This is what is meant by corporate ethics or CSR, not differentiating between ethics and morality in everyday business. A valuable access to the word offers the green etymology of etica as habit. Our moral sentiments depend very much on our upbringing, the culture, and customs we are living in. Ethics as a scientific discipline tries to bring this forward by shedding light on the unconscious. Science has to be objective, logical, and based on verifiable facts without subjective value judgment. To build a theory, models (defined as simplified images of reality) are integrated with ethics respecting those requirements of science. Figure 11.2 visualizes three steps to do so.

Figure 11.2 Methodology of theory building
There are three steps necessary to build a theory in applied sciences:
- First, the scientist (or the scientific working manager) has to determine basic values. No scientist can avoid decisions about the objects of his model building. Furthermore, there is no way to avoid decisions about the objective of research, the methods used, time horizon, and—in social sciences—the idea of man. Such decisions are value judgments as the basis of the theory.
- The second step contains the main work that has to be done. In the processing of empirical data, logical conclusions are drawn and mathematical methods applied in order to develop hypotheses and find conclusions for practical action.
- The third step of theory building indicates that the recommendation has to be implemented. Natural sciences have the possibility of repeated experiments under ceteris paribus conditions. Social sciences including scientific management can be implemented only once.
An Example in Logistics
The members of the board of a logistics provider have an investment budget of $5 million. Mr. Friedman wants to buy new trucks with a return on investment (ROI) of 10 percent, Adam Smith, Jeremy Bentham, and John Stuart Mill (to cite the names of the classics) prefer to invest in the energy-efficient retrofit of a cooling warehouse, ROI 5 percent. If externalities of carbon emissions would be included, the ROI rises to 15 percent. How to build a theory for decision making? If the value base of the theory would adopt traditional utilitarianism, Milton Friedman’s preference had to be followed. If the original idea of utilitarianism including externalities is applied, the retrofit wins.
The use of the term theory may be confusing here, because according to the figure for the practical decision making, a comprising theory consists of all three steps. On the other hand, theories (like utilitarianism) are slotted into step one as basis. Such a proceeding may be accepted, because theories can be small or large, overlapping, or serving as an element for one another.
Thus, the requirement of science to ensure freedom of value judgments has to be differentiated: wrong conclusions, lack of logic, and deliberated manipulation in the second step of theory building are not allowed. However, in the foundation of a theory (first step), value judgments are inevitable. This opens the door for ethics. The scientist should spell out deliberately what kind of values he uses as the starting point. Then he has to be strictly logical about the consequences and recommendations. This procedure opens the opportunity to compare the consequences of different sets of ethical values (different ethical theories) with a given problem in energy management.
Ethical Theories as Basis of Energy Strategies
What are the possible value sets we can use as a basis for our strategy? Different ethical theories can be adopted in step one to serve as the foundation for practical theory building and decision making, and the following are chosen for a closer discussion:
- Utilitarianism in its traditional form
- Utilitarianism with internalization of external costs
- Deontological ethics based on duty
- Communicative ethics with the example stakeholder approach
Further practical mindsets as foundation of environment management are outlined in Wicks et al. (2010, 321–27).
Utilitarianism in its traditional form was already explained and rejected (Chapter 5). This attitude may appear in business in the form of legalism: If a company acts according to law, it is ethically on the safe side—that is the view of several managers. As explained, the need to go beyond legalism is growing. The following theories are chosen for closer examination as enhancement or substitute of this conventional, neoclassical interpretation of utilitarianism.
Utilitarianism with internalization of external costs is a sort of pleonasm, because it should be self-evident that all consequences of an economic action are assigned to the one who earns the profits. The “wealth of the (industrialized) nations,” to cite Adam Smith, is caused partly because externalities occur. This wealth provides the means to mitigate the consequences of climate change, to modify agriculture, or to build higher dams. Canada or Russia will even profit from global warming. Most developing countries of the Southern Hemisphere didn’t benefit from the exploitation of fossil energy and the wealth of industrialization, but the greenhouse-effect will show the worst consequences in the form of desertification and sea-water inundation in just those countries not possessing the means to mitigate.
To accept this value base would mean for the energy ethics of a company in industrialized countries to internalize on a voluntary basis, if the economic situation allows for it. How exactly to apply this theory has to be subjected to further individual discussion.
Deontological ethicsdefines systems of duties a person has to follow. A universal version and golden rule of deontological ethics existed as early as in ancient Egypt: “One should treat others as one would like others to treat oneself.” In Kaliningrad in 1788, Immanuel Kant formulated the categorical imperative during the period of enlightenment: “Act only according to that maxim whereby you can at the same time will that it should become a universal law.” The impact of this rule is enormous: There are no pretexts possible like “I am not responsible for the market system and its external effects” or “If I would do otherwise, it would make no difference.” Consequently, one has to act as if it would be up to him that the world depends upon.
The Christian creed is in core a deontological system based on love: The golden rule stated by Jesus in the Sermon on the Mount (Mathew, Chapter 7, verse 12). A Christian would want to live up to the second commandment “love your neighbor as yourself” (Mathew, Chapter 22, verse 39). As the world has become a global village, people suffering from the consequences of global warming have to be considered as neighbors. Hence, Christians (or other followers of a deontological ethic) should act as if they were themselves threatened by the severest consequences that are likely to occur.
In secular countries with market systems, Christian ethics finds its place on two levels: On the first level are companies as a whole with an explicitly Christian mission; for example, entrepreneurs and family businesses who want to live up to their values. Additionally, the churches themselves own several companies, often in the nonprofit sector. The second level is the individual ethical basis of owners, managers, and employees in companies with a secular culture. Research on corporate culture (shared values in an organization) shows that the stronger the common values, the more successful the organization. Consequently, good, profit-oriented management respects the values of the employees in order to avoid a gap between private beliefs and the practice in the firm.
Communicative ethics with the example of the stakeholder approach is an accepted ethical practice in market systems. Communicative ethics states that a decision agreed upon in a fair dialog with all stakeholders is ethically justified. Thus, procedural ethics describe the way in which consensus is reached; the contents of the agreement are not determined. Many companies try to practice this ideal because it has numerous advantages for leadership and economic success in a complex and dynamic world: Fair communication helps to coordinate operations and make them more effective, resulting in motivated employees. Such companies may easily retain customers and cooperate with suppliers.
Global warming obliges companies to integrate the people influenced by the greenhouse effect into the circle of stakeholders. It is practically impossible to organize a direct dialog, but representatives should be the substitute. Applying communicative ethics, companies would have to act in their energy management systems (EnMS) in a way that people suffering from global warming would consent, a requirement of far reach.
Defining an Energy Strategy
A strategy as a high-level plan to reach long-term objectives in the field of energy is not easy to describe. So let us examine three different ways to formulate an energy strategy:
- A company could fix a maximum payback period or a minimum ROI for energy investments, with or without integrated nontangible effects. Consequently, actions will follow as realization of the formal criteria manifesting in technology. This way of strategy formulation does not determine what technology will be applied.
- To cover this gap,technological decisions have to be worked out coining the strategy. This could mean developing a long-term energy action plan, for example, to construct a block heat and power plant, the energetic retrofit of buildings, and so on.
- A strategy can be defined by energy performance indicators (EnPIs, see Chapter 14), defining the targets to reach. The indicators could pertain to internal operations (e.g., 50 percent renewables in five years), or external market indicators are applied (“We want to be among the top five of our branch using renewables”).
A comprehensive strategy involves all options, a close eye on economic success in a broad sense, a rough-cut action plan, internal, and external EnPIs to measure success.
These are different methods to describe a strategy, but how to fill it with content? There are many methods of strategic planning available. Again the methodological problem to choose a method arises (see basic value judgment in moral reasoning). The method and data input chosen determine the outcomes of the model. In the following, some standard methods of strategic planning will be applied to energy. There is not the one correct method; a multimethodological approach should be followed.
Embedding Energy into the Overall Corporate Strategy
The energy strategy of an organization is not independent; it has to be embedded into higher-level strategies of the company as Figure 11.3 shows.

Figure 11.3 Embedding an energy strategy into higher level strategies
The background facts have to be thoroughly analyzed in a given internal and external situation, including soft factors such as moral and cultural aspects. To attain long-term profitability, an overall corporate strategy covering every relevant perspective will already be available in most companies when tackling energy. Standard methods such as portfolio management (stars, cash cows, poor dogs, question marks) and norm strategies for product life cycles have to be interpreted according to the energy view. Please mind that this understanding of life cycle of a product is different from the one underlying the concept of ecological life-cycle assessment (LCA) analyzing the production of a product looking upstream and downstream the supply chain. As an integral part of the overall strategy, a discrete sustainability strategy is being formulated by an increasing number of companies (see Laszlo and Zhexembayeva 2011). Touching many aspects involved (long-life of products, competencies and payment of employees, customer service, etc.), every company follows a sustainability strategy implicitly. The environmental, energy, and carbon strategies are important aspects of sustainability (see Chapter 2 about integrated management). The introduction of ISO 50001 and an energy policy will reveal gaps in the overall planning system, offering a good opportunity for consolidation.
Scenario Techniques
Scenario techniques try to shed light in the dark by illustrating different versions of what could happen in the world with relevance to business. Energy demands complex scenarios involving many aspects with a far-reaching scale as the following examples underline:
- Political developments—as energy is sourced globally, political and social observations have to cover the whole world;
- Global warming—its consequences, social perception, and following greenhouse-related legislation on national and international level;
- Technology of energy generation, energy efficiency, and—if of relevance—energy-related aspects of own products;
- Prices of different energy carriers with a special focus on renewables;
- Product market changes, public sustainability awareness, and the need for legitimation and disclosure (e.g., by ISO 50001 certification).
There is no single monolithic technique to create scenarios. On the contrary, predicting what may happen requires creativity and lateral thinking and also a combination of other elements. For example, companies may use external or internal studies about energy markets, creativity technologies like brainstorming or morphological box, simulation calculations in accountancy with a different cost structure, expert interviews (Delphi method), and so on. A nice idea are wildcards, pulling a virtual card (idea) after finishing a scenario: What would happen if the Strait of Hormuz were blocked? What would be the effect if smart cities become the dominant trend? What if a genius improves solar power revolutionary (like James Watt improved the steam engine of Newcomen, see Chapter 5, the section about the industrial revolution)?
An early warning system screens the corporate, social, political, and technological environment to find weak signals of upcoming hazards for the business model. Developments pertaining to energy itself may be regarded as heavy signals popping up in the news regularly. The concept has to be applied in a much more detailed way; for example, observing the development of a special technology by scientific literature. Accounting could contribute by a simulation calculation: What would happen to costs, revenues, and profits if external costs of carbon would be adequately priced in?
The following sections contribute to scenarios focusing on different aspects like technology, decision making involving competitor’s behavior, and so on. They may as well be interpreted as stand-alone methods of strategic planning.
Technology Assessment and Technology Life Cycle
Energy-related technology might pertain to generation and efficiency, energy usage, or own corporate products. Managers have to observe recent developments, and they have to choose at the right point of time the right technology. Table 11.1 summarizes which important aspects have to be taken into account.
This table just contains some hints for how to get an overview of selected technologies as starting point for an elaborate investigation. The learning curve (already introduced in Chapter 5 about subsiding green energy technology) provides a theoretical background for evaluation. The following box gives insight into an elaborate study describing the interaction of technologies.
Strength, Weaknesses, Opportunities, Threats Analysis
Introducing the strength, weaknesses, opportunities, threats analysis (SWOT) method applied to energy, some important points for a foundry as an example company are presented by Figure 11.4 . Casting metal parts is very energy intense, with about 15 percent of total costs flowing into coal, gas, or electricity. A concrete company stands behind, but as weaknesses are tackled, the name shouldn’t be mentioned.
Table 11.1 Energy technology assessment
|
Technology |
Technical maturity |
Reduction of initial cost in the future |
Link to other investments |
Useful life in years |
|
Combustion motors of vehicles (Chapter 23) |
Slow progress, but not all technological options are available on the market (see “1 L car”) |
Depends on strategy of manufacturers, varying prices in different countries indicate the possibility of sinking prices |
No |
>10 |
|
E-mobility (Chapter 23) |
Batteries still in development |
Yes, early stage of market introduction |
For example, loading stations |
>10 |
|
Passive house (Chapter 24) |
Yes |
No or low |
No |
>50 |
|
Controllable electric drives (Chapter 25) |
Yes |
No |
No |
>20 |
|
Infrared heating system for manufacturing halls (Chapter 24) |
Yes |
No or low |
No |
>30 |
|
Power-heat cogeneration |
Yes |
Depending on country and size of asset |
Planning procedures for smart grid integration |
>20 |
Combining Solar Cells, E-mobility, and Storage—A Scenario
A study by the leading investment bank UBS concludes that the combination of solar cells, electric vehicles, and battery storage units will improve its profitability constantly (Parkinson 2014). The payback time of around 12 years in 2014 (which is already interesting for early adopters) will go down to 6 to 8 years in 2020, equaling a ROI pre-interest of more than 7 percent. In 2030, the payback time could fall dramatically to three years. In consequence, those disruptive technologies will contribute to the downsizing of centralized fossil fuel generation. UBS advises its customers to “join the revolution.”
Strengths Long tradition, dedicated workforce, elaborate procedures with the result of a high energy efficiency applying the given technology based on coal |
Weaknesses Reliable, but old technological equipment consuming coal, bad CO2 performance |
Opportunities Investment into new electrical furnaces, micro generation of renewables, participation in smart grids, considerable costs cut and dramatically improved CO2 performance |
Threats Shifts in energy prices for different carriers, changes in subsidies and legislation |
Figure 11.4 SWOT analysis of a foundry
The strengths and opportunities are the main topic of this book, which is an invitation to understand and tap the whole competitive advantage of energy. Weaknesses and threats will be elaborated in detail in the following section about risks.
Risk Management and Benchmarking
Risk management consists of three principal steps:
- Identification of risks
- Analysis and assessment of risks
- Control of risks through risk strategies
The identification of risksdepends in many ways on the previous sections (scenarios, early warning, SWOT, etc.). Here, an additional tool is provided to benchmark a company’s energy performance, which may reveal risks. Table 11.2 shows selected EnPIs in order to identify critical points and for other purposes.
Before applying this tool of benchmarking in strategic planning and managerial accounting, it has to be thoroughly defined, which indicators shall be looked at, which conclusions shall be drawn, and how indicators are quantified. It has to be decided as to what shall be the benchmark, and the EnPIs can be compared notably to
Table 11.2 Assessing and benchmarking EnPIs
|
Very weak |
Weak |
Average |
Strong |
Very strong |
|
|
Cost indicators |
|||||
|
Energy cost |
|||||
|
Part of energy cost of total costs |
|||||
|
Index of energy cost surge (or decline) |
|||||
|
… |
|||||
|
Energy efficiency |
|||||
|
Energy applied per product |
|||||
|
Energy per square meter floor surface |
|||||
|
… |
|||||
|
Green energy and carbon |
|||||
|
Carbon emissions |
|||||
|
Part of green energy supply |
|||||
|
… |
|||||
|
Application of relevant technologies |
|||||
|
Regulated electrical drives |
|||||
|
Passive house |
|||||
|
Infrared heating system |
|||||
|
… |
|||||
|
Management system and organization |
|||||
|
Organizational assignment of tasks, competencies, and responsibilities |
|||||
|
Objectives and targets monitored by energy-oriented managerial accounting |
|||||
|
… |
- The theoretically top level attainable (e.g., looking at the best technology available);
- Top competitors;
- Branch average;
- Internal objectives and targets;
- Company performance in previous periods.
Benchmarking data for competitors may be difficult to acquire, but here are some possibilities:
- Disclosed reports should be viewed, especially the Global Reporting Initiative, which provides abundant insight (www.gri.de).
- Environmental agencies or scientific studies publish relevant data.
- Statistical agencies or offices, political ministries, or departments.
- Personal connections in network meetings (complying with all limits of confidentiality).
- Comparisons with companies of the group and partners in a supply chain or value network.
Analysis and assessment of risks will follow after the identification. At this point a risk matrix can be helpful (Figure 11.5).

Figure 11.5 Risk matrix
All the risks, critical points, key technologies, strategies implying hazards, and so on that have been detected by the foregoing methods have to be mapped into the matrix.
Control of risks by risk strategies divides into three main streams:
- Bear the risk: Accept it and do nothing, just monitor the hazard. This is for the fields left and low in the matrix.
- Reduce the risk: This risk strategy may cover all the measures and tools of energy management deployed in this book. It is applicable notably in the middle range of orange fields in the matrix as shown in Figure 11.5.
- Insure the risk: Let others bear it and pay a constant price for it. This solution has to be recommended for high risk if the existence of an organization is at stake. The gist of this option can be applied in some aspects of energy; for example, long-term price options of purchasing. Beyond traditional insurance, energy related risks can be reduced by going into renewables and or even heading for autarky in the long run.
Decision making under uncertainty typically results in bad choices. Consequently, some managers have a tendency not to decide in order to avoid mistakes (it should be noted that doing nothing itself constitutes an implicit decision). Companies should nurture a culture of not asking about mistakes or even guilt. Instead, the habit to summarize lessons learned will be helpful. Even if the strategy didn’t evolve as planned, a company will win—if it is decided better than the competitors.
Short-Term Versus Long-Term Profitability
To get a more complete picture of strategic energy decision making, short- and long-term profitability have to be taken into account. Figure 11.6 systemizes the intangible effects of a sustainable energy strategy.

Figure 11.6 Hard and soft impact of sustainability on profits
It is tough management to consider intangible, soft, indirect, systemic factors for success; for example, attitudes and opinions of customers are hard facts for sales. The most important arguments may be summed up as follows:
- If the economy does not suffer a worldwide setback, energy prices will surge. This is true, especially, with regard to limited fossil energy, whereas renewable energy sources are unlimited and prices could be stable one day. Companies with an efficient use of energy prepare for rising prices. If companies use non-fossil energies, this may stabilize the price growth rate in the future. Correspondingly, the price of EAUs for carbon dioxide is another strategic hazard threatening companies. Being aware of their CO2 emissions through carbon accounting means that they have an early warning system.
- Efforts to improve the EnMS should be communicated to stakeholders, especially to customers. On the one hand, ecological leaders may profit from a better image, higher sales, and sometimes it is even possible to get higher product prices. On the other hand, companies that are lagging behind may suffer from disadvantages by missing the standards of the industry.
- Shared values that are formulated and lived in a firm are forming the corporate culture. As already mentioned, corporate culture is strongly correlated to the economic success of an organization. Adding energy ethics to the values of the firm helps to increase profits through mechanisms like stronger motivation, better coordination, less conflicts, and increased attractiveness on the labor market. However, if policies, codes, or guidelines from the top do not correspond with the reality of the firm, the effect is just reversed. It is worthwhile looking on the homepages of companies. Practically every large firm has relevant documents on the second level of their pages covering thoroughly all aspects of corporate ethics.
Linking Ethics and Energy Strategy
The Touchstone of All the “Warm Words”
In the case of energy efficiency the moral touch brings about a special problem: Is it justified to decide upon such investments in the same way as every other project? This is the touchstone of all the warm words in codes, policies, and speeches. If a company is not struggling for a common approach to investment acceptance, it is led unprofessionally. If a company does not differentiate between normal and ethical investments, it loses credibility. Here, energy as part of environmental management is focused, but the whole breadth of CSR from wages, donations (that may have profitability too), product stewardship, warranty, and so on is included. Until now we were dealing only with hard, quantitative data, but long-running, morally triggered projects have a soft, qualitative impact that may outpace quantitative data. This may be explained with the help of a complex target system with interdependencies as shown in Table 11.4 .
Let us get back to the value basis of energy strategies and try to match and measure both. A critical point of an energy strategy is the decision criteria concerning investments in energy efficiency and renewable energy. What requirements of ROI and payoff period do investments have to meet? Table 11.3 shows the different energy strategies companies may follow (as most tangible of the three methods to describe an energy strategy).
Table 11.3 Clusters of energy strategies
|
Strategy |
ROI and amortization period for energy investments |
Accountability (only quantitative, hard data or qualitative, soft factors as well?) |
Time horizon |
|
Short-term strategy |
25%, 4 years |
Short-term accountable, quantitative data only |
1 to 5 years |
|
Long-term strategy |
5% to 10% 10 to 20 years |
Hard data and qualitative long-term factors additionally |
Decades |
|
Extensive strategy |
Covering the weighted average cost of capital (WACC) |
Hard data and qualitative long-term factors additionally |
Decades, spanning generations |
Companies following a short-term energy strategy build up high hurdles for a business case, be it in energy or another field. Energy accounting and related investment appraisal help to detect profitable measures.
The long-term strategy does not only look at direct accountable investments and cost reductions, but other factors that are difficult to quantify are taken into account additionally. The methods to calculate the ROI of investments normally don’t make a difference between investments that have an expected useful life that is little longer than the payback period, or those with a very long machine life. Energy-efficient electric devices, insulation of buildings, heating systems, solar panels, and numerous other energy related facilities are sometimes in use for half a century. This contradiction may be bridged by soft factors that should be taken into account to get a more complete picture (see further discussion in Chapter 15).
Applying the extensive strategy, the business case in energy should cover the WACC so that the effects on the profits of the company are at least neutral. If a company finances its credits, for example, with five percent, it corresponds to a payback period of 20 years given a static calculation without interests. That seems to limit to the realization of measures even if the deciders want to behave ethically.
At this point, energy strategy and ethical theory have to be matched. Table 11.4 offers a grid to discuss which strategy goes with which theory.
Please mind that this table may serve only as a starting point in order to elaborate the value base of individuals or organizations.
Table 11.4 Relationship between energy strategy and ethical theory
|
Utilitarianism in conventional interpretation, legalism |
Utilitarianism with internalization of external costs |
Ethics of duty (deonto-logical ethics) |
Commun-icative ethics |
Code of ethical conduct, energy policy accepted by a company |
|
|
Short-term strategy |
x |
To be discussed individually |
|||
|
Long-term strategy |
x |
(x) |
(x) |
(x) |
|
|
Extensive strategy |
(x) |
x |
x |
x |
Going Beyond Self-Interest?
Reading policies, missions, or codes that some companies publish, we could get the impression that profits are just side effects of higher aspirations. Eventually, the complex interaction of doing good and economic non-tangible benefits inhibits an ultimate judgment of whether the basic motivation is self-serving or altruistic. Let us look at the checks and balances of corporate governments to see that in many cases it is not realistic to suppose altruistic action renouncing profits. Figure 11.7 shows a model of the governance of a large European company with shares traded at the exchange.

Figure 11.7 Corporate governance and control in a large company
Beginning bottom-up, let us suppose an idealistic middle manager wants to deviate from increasing profits by investing in buildings insulation, a corporate power station relying on wood pellets, or an energy-efficient vehicle fleet with a bad ROI. This decision with its deviation from investment approval standards has to be signed off by top management. Top managers depend on the supervisory board to get their contracts renewed. The supervisory board has to execute the will of the general assembly of shareholders who elected them into their position. Institutional investors (bound to the will of anonymous clients who want to assure their pension) will focus on profitability as well. Analysts and their mathematic approach still exercise a dominant influence on buying and selling decisions of banks and investment trusts so that the shareholder value will hike down the chain to the middle manager. Everybody has to play his institutional role, and has someone pressuring him when deviating.
In contrast to such a blue chip story, there are other types of companies where a broader margin of decisions may be possible:
- SME and family businesses not depending on anonymous investors, sometimes thinking in generations and not in quarters of a year
- Ethical investors with many different sustainability-oriented specializations; for example, climate investment companies
- Public companies, non-governmental organizations, and non-profit organizations
- Cooperative societies
Compliance Management (Legal Requirements—ISO 4.4.2)
What is compliance management and what role it may play in an energy management system? The energy policy aims for a big picture of ethical values, strategy, and long-term business success; this could be described as a top-down proceeding. As a next request, the ISO names “Energy Planning” specifying first “Legal Requirements.” In a thorough approach, a register of all relevant legal standards and the adherence documented should be listed bottom-up. As in the field of energy, the legal framework is mostly technical, and the energy manager could be the one doing this. Apart from that, compliance management looks into the subject as well. It has to ensure that all internal and external rules and regulations are obeyed. Large companies establish such units as staff positions with the main intention to prevent corruption, betrayal, or fraud in any form inside the company and to deal with the supply chain and other stakeholders. Quality, environment, energy, and other main social aspects of sustainability may be considered to be side aspects of this corporate function of compliance management. Many compliance managers (if there is such a position in large companies) are lawyers, so they will cooperate, and rely on functions with energy know-how.
Company Example: John Deere
I made the acquaintance of the compliance manager of the Europe headquarters of John Deere, a leading manufacturer of agricultural machinery. She had a background in law, was located in a staff position reporting to the board of directors, and stated that about 15,000 legal regulations have to be surveyed by the company. A plant with critical assets like a large block power station can be touched by about 1,500 legal requirements. Those numbers can be disputed, but they present an interesting insight by experts.
A quick look on the standard’s history explains why legal aspects are stressed: The importance of keeping up to legal requirements stems from quality management and product liability. In some countries like the United States, products that fail and cause accidents may generate an amount of compensation that could possibly ruin a business. In some countries, rigid legislation exists regarding environmental management, focusing on the company as a whole or even as a responsible person. Breaking environmental law could lead to imprisonment even for a leading manager in Germany. The trends explained in Chapter 5 reveal that in the field of energy, legal regulation intends to rely on market instruments, increasing prices by taxlike instruments, emission certificate systems, or subsidies. Violations of such regulations lead to economic consequences that are reflected in economic disadvantages but not punished by courts.
Nevertheless, some technical standards (for example in the building sector) have to be obeyed. They refer mostly to new construction projects because the right of continuance protects the assets of operation. In the end, it makes sense (and is required by the standard) that an overview of relevant technical standards exists in some form and is monitored. The energy manager will sum up the results from the business domain. The register or catalog can be decentralized. This means, for example, that the energy manager ensures that research and development (R&D) follows the energy-related regulation for their own products and establishes it in the documentation system. A car manufacturer would have to include in his strategic product development plan the maximum CO2-emission per distance his vehicles have to meet. That is core know-how of car developing units, whereas the energy manager has just to show up and check that it is done.
Accounting (Energy Reviews—ISO 4.4.3)
Overview
Energy reviews are the “determination of the organization’s energy performance based on data and other information, leading to identification of opportunities for improvement” (ISO 50001:2011, 3, the central term energy performance was already introduced in Chapter 3). The term energy reviews is so close to energy balances that they are used synonymously here. Energy audit as a related term covers a broader scope; it means a systematic look into a defined system containing reviews and balances as one core element. “Energy management system reviews” or audits are somewhat different, as they do not focus on energy input and output. They check if every element of ISO 50001 is implemented appropriately.
Energy reviews or balances may be applied in
- Biology and ecology, looking into the energy balance of living organisms or whole ecosystems;
- Economics, analyzing the energy supply and consumption on state and federal level; or
- Engineering, focusing on technical systems applying physics, chemistry, and other sciences.
The engineering approach frames the understanding of energy reviews by business administration and ISO. Energy-consuming operations are interpreted in a sociotechnical, organizational sense evaluating them economically. Thus, the data of reviews and balances is immediately flowing into accounting. The step from physical energy quantities to prices and costs means to create energy accounting. Energy accounting insinuates a separate system apart from established accounting systems. The aim should be to cover energy in accountancy and enhance the commonly used system. A stand-alone framework of energy accounting (supported, for example, by Excel) could be a learning phase heading for integration eventually.
A little hurdle in terminology presents itself, because energy balance (bilancia [ital.]: two-armed balance) does not really correspond to a business balance sheet composed of assets. Energy reviews or balances find their equivalent in a profit and loss statement, which contains fluxes in a given period.
Boundaries and methodology of energy reviews have to be thoroughly defined and documented. Here are the most important categories discussed in the following sections:
- The first, and easiest, step consists of measuring the physical energy input of a whole plant, location, or facility. For the cost side, cost-type accounting covers this field.
- In order to find improvement opportunities, individual operations have to be examined. More or less sophisticated technical analysis of variables determining the energy consumption bridge the gap between cost drivers and cost center accounting.
- On this basis, the allocation to cost objects (single operations, parts, or products) becomes possible. Ultimately, cost object accounting establishes manufacturing costs for products.
Up to now, this structure makes use of the typical way cost accounting is introduced in business study classes. But an internal view is not enough to cover energy in accountancy:
- Stakeholders urge companies to optimize life cycles of products. On the economic side, whole supply chains do compete. Consequently, companies are depending on the cooperation of partners upstream (direction to initial production) and downstream (direction to customers). A life-cycle assessment (LCA) involving sustainability including energy provides paramount data, because the heaviest environmental effects are often located at the beginning or the end of a chain.
- Based on this foundation, prosuming energy presents some specific challenges.
- Accountants and functional managers may be skeptical about the profitability of introducing energy accounting. Thus the benefits and applications are outlined.
- Finally, this chapter discusses the steps of implementation in the last section.
Plant Review—Cost Type Accounting
To measure the energy consumption of gas, oil, electricity, and so on in one year is quite easy; every small and medium enterprise and household does so. Chapter 2 presented a figure visualizing this topic. Cost-type accounting and book-keeping are linked immediately to the environmental and energy review on the level of a plant. Raw material is booked in pieces, the use of water is measured by reading a meter, and fuel oil accounted for by measuring the contents of tanks. Traditional book-keeping and environmental balancing differ only by a light shift of modeling: Accounting is mostly interested in inputs and outputs causing costs and revenues, whereas energy reporting wants to cover every physical effect of production.
The normal sequence of, first, measuring a physical flow and, second, evaluating it economically is often turned around: In many companies, accountancy takes the quantity of energy applied from the invoice of the energy provider first. Second, on this basis, the balance of material flows will be derived.
To get a better understanding of the energy supply of a whole plant, Table 13.1 introduces some important terms and explains the principal flow from energy generation to energy service. This could be also called an overview of the supply chain for energy. For a better understanding, three continuous examples can be read following the columns.
This model should not be aborted before defining the energy services. Thinking from the end means to be creative about rendering the service without energy input. To exemplify what this means the last line of the table provides examples:
Table 13.1 Energy supply chain
|
Primary energy as it can be found in nature, initial production of mining, or utility companies |
||
|
Fossil, nonrenewable energy (coal, crude oil, natural gas) |
Regenerative, renewable, or green energy (wind, waves, solar radiation, geothermal energy) |
Nuclear fuel like uranium |
|
Secondary energy (transformed primary energy) often used similar to end-use energy (energy ready for consumption) provided mostly by utility companies, partly this could be green energy
|
||
|
Coal transformed into coke by a coking plant Crude oil cracked into benzene or gasoline, diesel, gas, bitumen by a refinery |
Solar radiation turned into electricity by solar technology or heat by a solar collector Wind power station, heat pump |
Processing the uranium to nuclear power rods and producing electricity in a nuclear power plant |
|
Tertiary energy as useful, effective, or net energy In our focus company (part of plant energy balance) |
||
|
Burning fuel gas to heat buildings Combusting gasoline to move a car |
Electricity supply of a working machine |
Energy supply of a lamp |
|
Energy services (the final benefit of energy application) In our focus company (part of plant energy balance) |
||
|
Warming rooms and production halls Covering distance in a car to reach other people |
Processing of component parts |
Illumination |
- Too cold in a room? Close the window before starting to heat.
- Need to meet colleagues in another city? Think about video conferencing.
- Cut energy input treating parts? Avoid scrap first.
- Too dark? Draw up curtains or plan buildings with windows aligned to the south.
Process Reviews—Cost Center Accounting
Cost place or cost center accounting looks deeper into the operations, and shows the flow of material, services, and energy through the workshops of a factory building or a plant. In Figure 13.1, cost centers and the operations performed are symbolized by gearwheels.
A single operation may be a numeric control (NC) machine, a coating process, a glowing process in a furnace, all the transportation, and so on. Here, light is shed into the black box of a whole plant. Visualization tools are energy flow charts (Sankey diagrams). Figure 13.2 contains the industrial example of a furnace, thus, one example gearwheel of the Figure 13.1 is examined closely.

Figure 13.1 Process balance within a plant

Figure 13.2 Sankey diagram for a reheat furnace in steel industry
Source: www.e-sankey.com/en/demos-screenshots/
Note: Heat fluxes represent the combustion of natual gas, the heat recovery loop to preheat the combustion air by a recuperator, the steel ouput, and different heat losses
Every single cost center and operation has to be understood; variables and drivers for energy consumption and costs have to be identified. The drivers indicating energy consumption (and costs in established cost accounting) may include
- The duration of treatment of a production job;
- The number of parts processed;
- The number of rotations of an NC machine per minute (the intensity of operation as working units per time); or
- The temperature of an oven.
Here we are paralleling activity based costing (ABC) and machine hour rates in cost accounting, which is examined in the next chapter. As understanding and mode ling of operations from technical and accounting viewpoints are crucial, an everyday example will clarify the challenges (Figure 13.3).

Figure 13.3 Energy operations modeling for the example of a car
Filling the tank of our car at a service station, we have to consider if the consumption of fuel is adequate. The energy performance indicators (EnPIs) “distance per gallon” or “fuel per 100 km” have to be applied. The distance covered is the first driving variable of consumption. To understand deviations from average, additional variables have to be taken into account. These are especially
- Velocity (disproportionally high air drag when going faster)
- Surrounding temperature (heating or air conditioning switched on or off)
- Tire pressure (low pressure increases consumption)
- Type of route (highway with constant speed, stop-and-go in the city, mountains, etc.)
Technical handbooks and documentation provide a first insight into technical data. For a car this is a booklet; for a milling machine or other industrial equipment the manufacturer provides extended technical documentation. Just as an attentive driver gets a feeling for the consumption of his car, the engine operator has an intuition for the smooth operation of this device. If a car driver is pondering increased energy consumption, he may get the idea to check the air pressure in the wheels. If this is the reason for the reduced energy efficiency of the car, not only this technical aspect of the production process of car driving is improved, but also the handling of the car is better, and the risk of a tire blowout is reduced. These are two aspects of quality reducing the risk of accidents considerably. This example should provide an idea of how technical aspects of energy, quality, handling, long-term durability, and so on can be mingled.
In the car example, the energy consumption is measured at the gas station and compared to the average. The baseline is determined by forerunning technical experiment. Taking into account the current variables (a first step of mathematical modeling of operations), the measured and the calculated EnPIs can be compared. Deviations indicate when something goes wrong and correction has to be made. Figure 13.4 gives a practical high-end example of electricity demand modeling in the food industry.

Figure 13.4 Electricity demand in a food company
Source: Nutreon Engineering (2014).
The different curves show different modeling ex-ante projections of energy demand of a cost center in the food industry in comparison to the actual as-is consumption measured ex-post. The remarkable point is how close the different curves of calculated energy demand and actual consumption come together. The correlation coefficient R2 indicates that 92 percent of energy use can be explained by the model underlying this chart.
Application of Production Theory
Studying business, I had to learn production theory model A to E. Every model contributes to the understanding of operations in a company, but model E just introduced multiple variables determining the technical process. Unfortunately, my lectures did not provide an example. After seeing many production sites, I got an idea what model E really means. When I tried to convey this experience to my own business students, I failed at first. Evolving my teaching methodology, I am now going the way reflected in this book: First a simple, every-day example like driving a car, cooking, or heating a living room, then a complex example taken from industry, just as an invitation to go deeper.
In complex plants, not only one asset has to be understood in isolation but many more. Therefore, several relevant devices are in interaction. A furnace emits warmth, so that heating of factory buildings is not necessary, or a small district heating can be fed. This is welcome in wintertime, but in summer the thermal energy is not needed; it has to be discharged or cooling has to be provided.
The analysis of single machinery and operations should be aggregated to model whole plants. However, this theoretically sound way does not fit into the practical situation of many companies that initially consider a plant as a whole using the data available and then look at the most important processes and devices. There is another restriction to realizing an energy balance sheet to its full potential. Most companies will only determine the energy input; they will not calculate the energy losses of the output side in detail. To measure or calculate the energy output is complicated and tricky, as energy efficiency and losses have to be analyzed. In most cases, efficiency data for whole plants is based partly on estimations and averages.
The internal energy supply and conversion transformation often create preliminary cost centers that could be block power plants, tanks for oil, a service station, or solar cells. Their entire energy profile and costs will be allocated directly and indirectly to the main cost centers.
Product Reviews—Calculation (Cost Object Accounting)
The third part of cost accounting (calculation) may be described by Figure 13.5, modifying a previous one. Here, the passage of a product through a plant is introduced.

Figure 13.5 Product balance
Source:Kals (2010, 31).
We have to track the passage a product runs through the manufacturing process (cost centers). As balances of every operation are ideally available, the calculation of a product (cost object) in the style of machine hour rates becomes possible. Ideally, we measure the exact energy going into a specific production of a product in every process. Summing up all the operations a product undergoes results in an energy balance of the product. On this basis, the carbon balance of a product can be derived easily.
As with all other cost types, energy costs have to be split into a variable and a fixed component. Variable energy costs are caused by milling machines or forklifts, whereas fixed costs will come from –furnaces or cooling warehouses. Variable costs can be assigned as itemized, individual costs to cost objects like parts or products if exact monitoring and measuring takes place. Fixed costs have to be divided by the number of products. Figure 13.6 contains the overall flow of cost accounting.
Different calculation methods introduced by an example
Let us assume a shaft or another part has to be treated for 2 h on a working machine with an electric capacity of 30 kW. The energy cost can be considered in the product calculation in different ways:
The most simple and still widely used method is to estimate the energy cost as part of overheads.
Division calculation would mean to measure or calculate the energy consumption of the working machine in a period of time (let’s say a month) and to divide it by the number of shafts produced (output of 80). If the machine runs for 8 h a day, five days a week, four weeks a month at full power, the calculation is as follows:
Energy consumption:
30 kW × 8 × 5 × 4 h = 4,800 kWh
Energy consumption per unit:
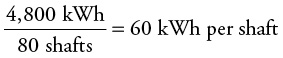
This method may be tricky if different parts are treated, equivalent unit calculation has to be applied.
The next step of elaboration would be to establish energy as a visible and integral part of a machine hour rate calculation. The electric capacity has to be multiplied with the duration of the operation:
30 kW × 2 h per shaft = 60 kWh per shaft
Here, the outcomes are the same to show the similarities of both ways. Actually, the division calculation with measured data could reveal waste of energy if the machine runs idle or with an ineffective mode of operation. In this case, the measured data would be higher than the calculated result for one part.
Smart metering opens up more advanced options. In the previous methods, no different grades of operation were introduced. But a digitally programmed working machine can measure the energy consumed at any time depending on the given mode of operation—logging and assigning the data to the exact part (cost-object) just treated. As automation and meters proliferate, this will be the method of the future.
Since electricity prices have become volatile, we will see less calculation based on average costs in the long run. Smart metering and digitally programmed machinery allow assigning exact costs at any moment to each production lot.
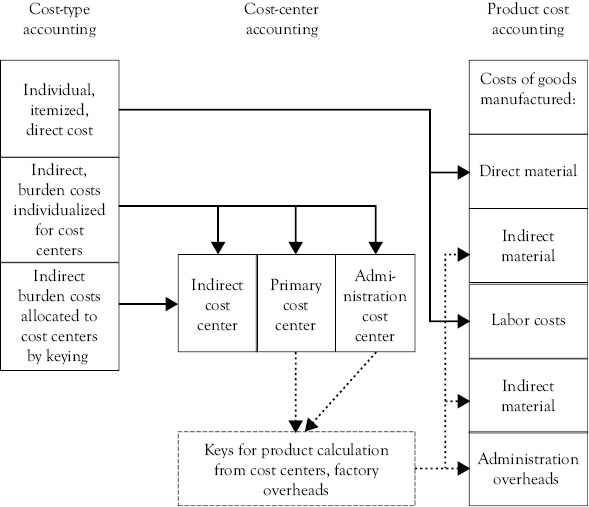
Figure 13.6 Overview of cost accounting
These balances are dominated by an engineering and natural sciences approach. Let us now analyze how they may be introduced into accounting. We follow the common steps from cost-type accounting over cost center accounting to cost calculation of products (Figure 13.6).
The secret is that new methods of data acquisition allow for turning artificial overhead costs into measured, exact energy consumption, and direct costs. Smart metering, automated operations, radio-frequency identification, and global positioning system are helping to capture operation data online, to assign them to cost-places, and to elaborate the key for calculation. That helps a lot in improving the calculation to determine the manufacturing costs of a product.
LCA and Value Networks
Until now, we were looking only at our plant. What is it about gray energy or gray carbon emissions? Table 13.2 shows what may be included additionally; the concepts expressed may be applied to material products, including energy, and other objects like parts or even services.
This concept was first developed for the complete environmental assessment introduced as product life cycle analysis (LCA described in ISO 14040).
It seems strange that energy-related aspects are taken out and described in specific standards, as energy is already covered by the environmental approach. But the importance of energy and carbon are on such a strong rise that the ISO decided to dedicate standards to this field, namely ISO 1406x-series (see Selected ISO Standards in appendix).
Table 13.2 Limits of system for LCA
|
Limits of system |
Explanation |
|
cradle-to-gate |
Product life cycle from mining of raw material to the output gate of the own company. |
|
cradle-to-grave (sometimes called “womb-to-tomb”) |
The whole life cycle from mining to disposal and dumping or recycling. |
|
gate-to-gate |
From the own input gate to the output gate. Thus, the company’s internal operations. |
|
gate-to-grave |
From the company’s output gate over subsequent production steps at other companies, including the use of products and their disposal. |
|
cradle-to-cradle |
Similar to cradle-to-grave with the emphasis not on disposal and dumping but on recycling. The aim of closed-loop value networks is expressed. |
New terms signal new ways of thinking: Linear supply chains should become closed-loop supply chains or (sustainable) value networks. To integrate LCAs (with their focus on externalities) into internal investment appraisal, the concept of life-cycle cost (LCC), whole-life cost, or total cost of ownership (TCO) are at our disposal (they will be elaborated in Chapter 15 on energy-oriented investment appraisal). In respect to energy, it is not possible to close the loops physically, because this would mean to bring energy losses down to zero, which is impossible. Thus, closing the loop should be defined as carbon-neutral energy systems. That means using renewable energy to compensate for energy losses.
To apply these boundaries and explain closed-loop supply chain as a step toward sustainable value networks, Figure 13.7 may be helpful. Enhancing comparable models in literature, the energy aspect, with the renewable and fossil sides and new players like smart cities, is included.
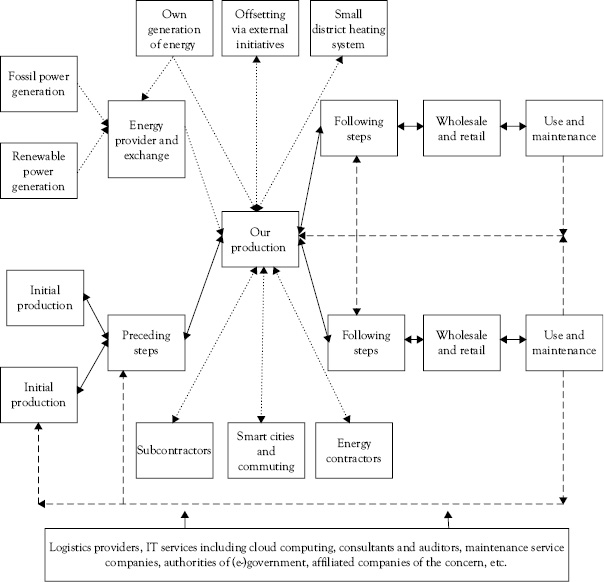
Figure 13.7 Energy-oriented value network model with closed loops
But how to get the information from outside the individual company? A small or medium-size company cannot launch research projects for every part and product. To address this need, databases as practical practice tools provide relevant information about environmental, energy, and carbon assessment. The following are some examples:
- Database of ecological balances of the European Commission (www.lca.jrc.ec.europa.eu/lcainfohub/datasetArea.vm)
- ProBas (process-oriented basic data for environmental management tools of the German federal environmental agency) (www.probas.umweltbundesamt.de/php/index.php)
- Database of ETH University of Z rich (www.ecoinvent.org/)
- Wal-Mart hub (www.walmartsustainabilityhub.com), large companies may invite their suppliers to share their data
- GEMIS (global emission model of integrated systems of the Eco Institute in Freiburg, Germany) (www.oeko.de/service/gemis/de/index.htm"> )
The Impact of Prosuming
As explained, companies and households are becoming prosumers—microgenerating energy, storing it, and helping to balance the electricity net by load management. What does that mean for energy reviews, balances, and accounting? Input-oriented balances will be expanded to the output side; accountants will not be looking only at costs because energy generates revenues.
To represent this development adequately, the periods of time for updating technological and business balances have to be reduced dramatically. To provide powerful tools of planning and controlling, it will not be enough to report once a year, a quarter, or a month. The concept of energy balances discussed here will evolve the concept of business balance sheets or profit-and-loss accounts, because the similarities to technical controlling will grow. Attaining a higher granularity, single assets and operations within cost centers have to be focused. Advanced methods of data logging like smart metering provide the means to update every 15 min, in some applications reaching an online stream of data. Companies operating energy grids have to provide reserve capacities in the range of minutes involving virtual power plants with the participation of nonutility firms. Hence, this development is really necessary and beneficial. As a consequence, we will see an increasing intensity of rolling wave planning linking accountancy and physical energy operations in all business domains.
It has to be discussed if such revenues contribute to the operating or nonoperating result of a company: If the earnings come from operations pertaining to the primary purpose of the company, they should be assigned to the operating result; for example, selling the waste heat of a furnace and feeding it into a small district heating system. Solar cells on the rooftop of any nonutility company will contribute to the nonoperating result.
Benefits
Improving energy accounting requires an understanding of the principle of causation. This core idea of accountancy presents many potential benefits to convince top management, accountants, and functional managers to act. The important advantages for accountancy are:
- More precise price calculation of products, improving amount of coverage for fixed costs per unit.
- More precise internal billing and assigning of energy consumption to profit centers and cost centers, providing incentives for conservation
- Better energy demand planning, budgeting, and financial planning
- Improved tools to identify action by EnPIs and (sustainability) balanced scorecard
- Better investment appraisal including TCO and calculation of optimal replacement point
- Contribution to improve allotment of cost and profit centers to display energy-oriented interdependencies (for example, who pays for compressed air?)
Energy accounting plays its role as well, exceeding the boundaries of a single company. Without cross-company accounting and a corresponding framework of contracts, progress can be blocked (see the following example). Furthermore, energy accounting is helpful and sometimes indispensable in building up business networks; related buzzwords are sustainable supply chains and virtual power plants.
Cross-Company Accounting Coordination in a Company Group
During a site inspection in a concern (which shouldn’t be named here), my enthusiasm was growing: The list of obviously profitable investments in energy efficiency became longer and longer as I walked around with the general manager of the operating company using the plant. At the same time, the mood of my guide dimmed.
- Replace the warm air heating with an infrared heating system? That would be the responsibility of the service company facility management organized as own legal entity within the concern. They are not willing to invest because the hire contract does not allow higher rent for the next three years.
- Supply energy inventory for the whole industrial park with an on-site combined power and heat plant? The service company does not have an adequate investment budget.
- Efficient electric forklifts instead of the old-fashioned diesel ones? Competency of the service company logistics was an issue. In this case, investments and reduced costs would flow together, but there is a personal problem with the manager in charge who blocks every proposal.
Not only does accountancy benefit from an improved energy logging, allocation, and planning, but also every other business domain. Some examples include:
- Provide bottom-up data for strategic planning.
- Use demand planning with load curves as a basis for negotiations with energy suppliers, cutting costs in procurement, and avoiding peaks to get electricity cheaper at any time.
- Assign job to the cheapest machine in production and operate machinery with the right intensity (that means velocity of production).
- Include setup-costs in operations management to avoid warming up of assets more exactly.
- Use monitoring of an asset’s energy consumption as a warning signal that an operation does not work properly (predictive maintenance).
- Operate the infrastructure in an optimal way (compressed air, tubes for pumping product, lighting, etc.).
- Operate decentralized energy plants for the company’s own consumption or selling (solar, wind, and block power station).
- Use decentralized storing facilities (batteries, cooling warehouses).
- Choose the right transportation method under cost, energy consumption, and carbon aspects.
- Operate heating and cooling with optimal parameters (night setback, inlet temperature, standby, and shutting completely off).
- Define operating, stand-by, and shut-off of assets quantifying conservation in good housekeeping.
The general idea touching management culture and philosophy is that there are unprecedented opportunities to understand internal operations better and map them to accounting. The grip on improvements combining business and engineering brings about competitive advantages for companies being a step ahead.
Steps of Implementation
IT plays a critical role enrolling energy in accountancy. The basic ideas of Chapter 7 on the “evolvement of IT as an enabler” are applied here for accountancy. The different steps following now can be interpreted additionally as milestones of an introductory project:
- Collection of available data develops a quick and dirty energy review at the on-site level, using a stand-alone available software or freeware. When companies enter the field, Excel spreadsheets are often used for the first steps. Another way of IT-support may be specialized programs for carbon footprint calculation or energy flow charts that are cost-free available on the Internet. Try to identify the paramount spots of energy consumption and discuss possible initiatives.
- Execute the integration into standard accounting procedures in your company. Expand on the database through the installation of new meters and calculations of energy use of assets. Look at the operations in detail and assign energy use correctly, with costs and carbon linked to objects (products). Evolve the standard accounting software and use stand-alone Excel sheets only as a playground to try new things. The integration should be in a few great leaps, because reports and indicators will change. That means time indexes and benchmarks are not fully comparable to past years. Hence from this perspective, few thoroughly planned steps seem to be better than little changes every year.
- The big vendors of integrated enterprise resource planning (ERP) solutions cover more and more aspects of sustainability, environment, and energy. Covering the methodology proposed here, several software modules have to be acquired and customized, as they offer powerful but costly opportunities. Fully integrated systems do not appear on the horizon; ERP solutions representing mostly the business view have to be linked with interfaces to operational energy data logging and control of technical devices.
- An ultimate step aims to integrate external data from suppliers and databases (big data) and tap the cutting edge of business intelligence, BI, and in-memory database, IMDB, (application examples will be elaborated next in Chapter 14 about managerial accounting and EnPIs). Features should be visualization tools like management cockpits and mobile computing, possibly with the help of the data cloud.
Management Accounting (Baseline—ISO 4.4.4 and EnPI—ISO 4.4.5)
Overview
Management accounting is a profession that involves partnering in management decision making, devising planning and performance management systems, and providing expertise in financial reporting and control to assist management in the formulation and implementation of an organization’s strategy. (IMA 2008,1)
In the case of energy, the different balance sheets and reviews represent the bulk of information supply covering a wide range of methods of management (or managerial) accounting.
To enhance the energy aspect, the established environmental (sometimes called ecological) management accounting (EMA) practices serve as a stepping stone. The interaction between monetary environmental management accounting (MEMA) and physical environmental management accounting (PEMA) has to be clarified when applying them to energy and carbon. The International Federation of Accountants (IFAC) defined EMA as
the management of environmental and economic performance through the development and implementation of appropriate environment-related accounting systems and practices. While this may include reporting and auditing in some companies, EMA typically involves life-cycle costing, full cost accounting, benefits assessment, and strategic planning for environmental management. (IFAC 1998, 1)
The methods mentioned and many more are covered in this book applying to energy and carbon. This chapter is dedicated to key performance indicators (KPIs) as important tools for management accounting, which is not covered in other chapters. As a starting point, we should analyze the requirements of ISO 50001 concerning energy performance indicators (EnPIs—the energy-related KPIs):
- At first, simple metric variables that are absolute numbers have to be detected, for example, the overall energy use of a plant.
- Ratios construct a relationship, for example, the energy use per product unit, or the percentage of renewable energy of the whole energy consumption. All of the other EnPIs provide an index number when compared over time.
- The third option mentioned in the standard consists of complex models (see Chapter 13). The aim here is to integrate EnPIs into established KPI business systems like the balanced scorecard (BSC).
ISO 50001 requires that EnPIs have to be defined, documented, and interpreted. However, the standard does not specify which ones to make use of. The threshold to participate is intentionally kept low. Thereby, organizations should be invited to take a first, easy step, just to start walking.
An EnPI (for example, the energy consumption of a building) visualized in a graph depending on the time forms an energy baseline (see Figure 14.1). Baselines are necessary to measure the impact of an energy efficiency investment.
In most cases, a model of physical systems is necessary to isolate the influence of the measure and to interpret a baseline in order to evaluate the effect of an investment. Here are some examples:
- A vehicle’s fuel combustion depends not only on the car technology, but also on the velocity.
- The energy use of a building per square meter is influenced not only by the heating, but also by the outward temperature, and the desired temperature inside.
- The energy consumption of a machine depends not only on its efficiency, but also on the capacity utilization (if it is not an oven or cool store with fixed energy consumption and costs).

Figure 14.1 Energy baseline
So, we take up again the modeling of operations as discussed in Chapter 13. The baseline measures the energy performance and offers the means to quantify objectives and targets. A further application can be the checking and interpretation of volatile energy consumption. Figure 14.2 provides an example from the food industry.

Figure 14.2 Baseline with volatility of energy cost per day
Source: Nutreon Engineering (2014).
The spread between 8,000 and 14,000 euros energy cost per day has to be analyzed with the help of technical parameters, as explained, to gain hints in measuring energy conservations.
How to systemize EnPIs considering the existing framework of managerial accounting KPIs? The following approaches may be helpful to transform the technical understanding of energy measuring in a business context:
- EnPIs according to energy reviews and balances linked to cost and revenue accounting
- EnPIs and BSC
- Cutting edge methodology of business intelligence (BI) based on in-memory databases (IMDB)
EnPIs Derived from Energy Reviews
Energy reviews and balances of all kinds offer a great opportunity to determine and classify a broad variety of EnPIs. A first structure of indicators should be the hierarchy going down from the company level to that of individual equipment (Figure 14.3).
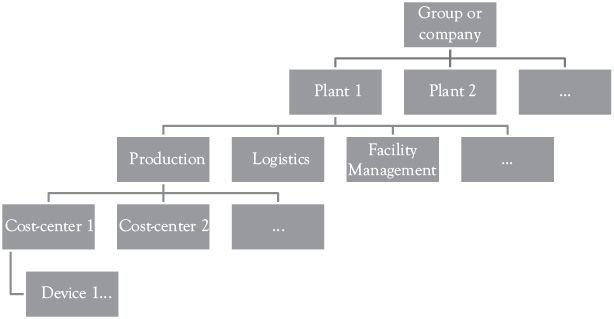
Figure 14.3 Hierarchy of EnPIs according to company’s organization
This simple hierarchical structure can be viewed from different perspectives offering multiple opportunities to define EnPIs:
- An important and indispensable view consists of differentiating according to energy carriers and forms like oil, gas, electricity, and so forth.
- To distinguish between renewable and fossil energy is an important perspective
- Modeling EnPIs can concentrate on
- energy consumption (concentrating on liter, kilowatt, etc.)
- carbon (kilograms, tons)
- costs and revenues (monetary units)
Additionally, procedures cutting through the functions, cost-centers, and devices in the hierarchy of the figure have to be described by EnPIs. The conversion of energy in different forms throughout the plant has to be followed, for example, from electricity to compressed air to operations of a screw driver (energy supply or transformation chain). Doing so, in every energy application, the efficiency and losses may be calculated. Furthermore, the operations to produce parts, semifinished goods, and products deliver many EnPIs. Enhancing this gate-to-gate figure to life-cycle assessment and value networks, many more energy-related indicators could come into existence linking to the models of cooperating companies and other partners.
EnPIs in BSCs
A proliferated system of KPIs is the BSC. Starting from the vision, mission, and strategy of a company, all indicators are arranged in different hierarchy levels according to four perspectives:
- Financial
- Customers
- Internal business processes (operations)
- Learning and growth (employees)
There are three options to combine EnPIs and BSC:
- Elaborate EnPIs as a stand-alone solution besides BSC; the previous section introduced possible structures. If a BSC is the estISO 50001 and some management ablished system of KPIs in a firm, this option only makes sense as a tentative transition period.
- Integrate energy as part of sustainability as a fifth perspective into BSC. In most companies, energy and sustainability do not have the importance to be equally lined in. Therefore, the next option of a truly integrative system should be recommended.
- Integrate EnPIs into the established perspectives. This is in most cases the appropriate, long-lasting method meeting the importance that energy has in the given surroundings. Nevertheless this is quite demanding: All the perspectives have to be evolved and enriched (see Figure 14.4 with exemplary EnPIs).

Figure 14.4 Energy-oriented BSC
The Cutting Edge: BI and IMDB
The megatrend IT outlined in Chapter 7 offers the means to reach a new level of KPIs supporting managerial decision making. Based on the forgoing explanations of BI and online analytic processing (OLAP), the vision for energy management is casted into the OLAP cube in Figure 14.5. An OLAP-cube visualizes the relationship between three variables of an application field of BI. It is due to the limited capacity of the human brain and the possibility to visualize cubes that we usually focus on three variables.
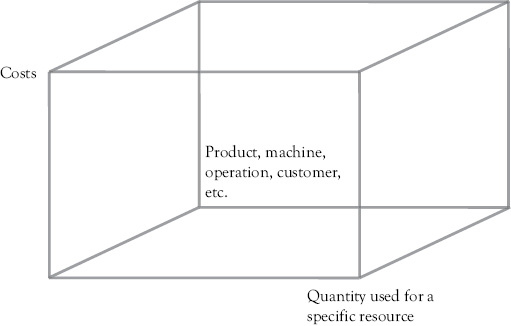
Figure 14.5 OLAP cube applied to energy management
Adopting this method to energy, the following three variables are chosen:
- In the first dimension (x-axis), the use of resources is measured with the corresponding physical unit of measurement (kilo, liter, kilowatt-hour, etc.).
- The second dimension (y-axis) links the price to the quantities to get the costs.
- The third dimension (z-axis) illustrates the cost unit, which may be interpreted as product, machine, operation, customer, transport, facility, and so forth. For every application, an individual cube could be presented.
BI tries to get an understanding of the interdependencies and mechanisms at work in an experimental and playful way. The consequences of actions like replacing an asset, changing a supplier, increasing production of a product, and so on may be calculated easily and swiftly. If a user wants to know more, he has to just drill down deeper into the database linking information to gain new insight.
There is a tricky side effect, that is, information is generated about persons that should stay confidential: Which shift leader has the lowest productivity on Monday morning? Which truck driver gets the least miles out of a gallon? Which team causes the highest quantities of energy losses?
BI solutions mean that OLAP is not only tinkered with by a management accountant or plant manager, but also a systematic, interpersonal approach has to be elaborated. Typical applications are an overall performance management (with ecological and social performance included prospectively), customer relationship management (CRM), and—though not yet established fully in most companies—energy and environmental management.
In-memory databases (IMDB) offer a shortcut to traditional BI with the need to build up a data warehouse with a lot of effort and expenses. BIdeserves extraction, transformation, and loading (ETL-processes). IMDB simplifies the data availability and accessibility, because formerly unimaginable masses of data may have been held in the working memory (random access memory, RAM). Thus, the job of IT-professionals becomes much easier to make data available. Companies can concentrate on what conclusions they want to draw and what methods to apply solving the new problems outlined.
The developments discussed until now fall mostly within the internal side of a company. They are flowing together with an evolving opportunity outside: Big data means all the data generated day by day on the web, in mobile computing devices, and (as far as accessible) in companies. From big data to big business is only a step; the dominating application today is marketing (see Chapter 17). It is remarkable that information for stakeholders does not physically come from the companies’ servers. Cloud computing is helping to keep the data available and to increase capacity utilization of servers. Network partners and all who are interested in the information may get it from the data cloud if access is granted (or hacked). In addition, mobile computing provides information everywhere. Companies that understand and manage complexity best will win.
Who defines an optimal level of IT and EnPIs application? The marginal cost of data acquisition and processing has to be evaluated against the marginal benefit of better decision making. It is up to managerial accounting to decide which of these masses of indicators should be defined and interpreted. As explained before, the costs of data logging and processing are going down rapidly, consequently, the number of indicators that should be used is increasing. Hierarchies of indicators offer the option to supply the managers only with few numbers at first, but the management accountants themselves have the possibility to go into detail and to help managers do likewise.
Investment Appraisal (Objectives, Targets, and Action Plans—ISO 4.4.6)
Overview
Energy objectives and targets (O&T) are necessary to put energy policy into practice. O&T have to be SMART (specific, measurable, appropriate, realistic, time-bound). Otherwise, they could not serve as an objective measure in the plan, do, check, and act (PDCA) cycle in order to improve energy performance. Progress is achieved by energy action plans. Table 15.1 offers an example with typical investments, measures, and initiatives.
Importance of Investments in Energy Conservation
Typically, companies have energy expenses in a range of 2 to 5 percent of total cost. Obviously, materials and personnel are cost types of greater importance, but in times of shrinking margins, many companies are struggling to break even at all. Thus, energy has to be taken into focus. At a conference, I had an interesting conversation with Robert Seiter, executive director of climate change and sustainability services from Ernest & Young. He confirmed that most companies should be able to reach 20 percent conservation just by changes in behavior and measures of highest profitability. Twenty percent of 5 percent energy cost represents 1 percent of overall cost. For a company at the break-even point, this could make the difference between profit and loss.
Table 15.1 Example of an energy action plan
|
Action |
Department–person responsible |
Target date |
Target of energy conservation per year and carbon conservation per year |
Budget, cost reduction per year, return on investment (ROI) payback (optional: carbon amortization) |
|
Replace air compressor |
Facility management, technical services—Enid Energy |
June 30th, next year |
20,000 kWh per year 10,000 kg CO2 per year |
$24,000 budget $8,000 per year savings 33% ROI three years payback |
|
Implement carbon accounting |
Accountancy—Carl Carbon |
March 31th, next year |
Pilot project based on spreadsheet paralleling established cost accounting gate-to-gate involving a student |
$4,000 cost savings, ROI, and payback hard to measure |
|
Replace five old trucks |
Logistics—Clint Climate |
End of the year |
$3,750 dollar per year fuel cost cut 6,500 kg CO2 per year |
Profitability has to be assessed involving reduced maintenance cost, better reliability, new technical features of trucks, and so forth. |
|
Training good housekeeping |
Energy management representative and human resources—Ephron Efficient and Consuela Conservation |
June 30th, next year |
Rule of thumb: 20% overall conservation by changes in behavior. Conservation depends on company size |
Zero (variable) cost, cost reduction depends on company size ROI theoretically infinite payback immediate |
… |
ISO 50001 and some management textbooks give the impression that the sequence is to fix O&T first and formulate initiatives to achieve them afterwards. In practice, the opposite is done: Managers first check what is feasible and derive afterwards which O&T can be reached. Some energy measures do not cause cost (e.g., switching off machinery at night, instead of leaving them in stand-by mode), but many investments need financial means. Consequently, an overall balance of the following has to be reached:
- Investment budgets in a planning period (which can be a fixed number or a variable, bargain-based sum);
- Investment budgets needed for energy initiatives and their profitability; and
- Other investments and their profitability.
In many cases, departments compete for the investment budget, financial accounting being the goal keeper, defining requirements and top management in the role of referee, and also defining the rules. In companies with well-established managerial accounting and financial planning, it is easy to fulfill the requirements of ISO 50001: All the energy-related budgets, actions, and O&T are integrated into comprehensive planning procedures. The energy-related investments just have to be stripped out and summed up. Companies not using such elaborate planning tools should think about developing them in the course of implementing an EnMS.
There are some specific, energy-related methods going beyond the normal ways of corporate budgeting and investment appraisal. This chapter is dedicated to them, each discussed in a section:
- Total cost of ownership (TCO), whole-life cost, life-cycle costs (LCC)
- Replacement point of assets
- Sensitivity analysis
- Payback period versus ROI and corporate social responsibility (CSR)
- Energy payback and “energy returned on energy invested” (ERoEI)
- Subsidies for investments
TCO, Whole-Life Cost, and LCC
In Chapter 13, we introduced life-cycle assessment (LCA) including physical external effects, and sometimes the terms in the heading of this section seem to be used synonymously. Unfortunately, this is not satisfying, I would sum up the actual use of the terms as follows:
- LCA refers mainly to ecological effects; economic and sometimes social views are less in focus.
- Whole-life cost and LCC denominate the economic evaluation of a product, part, or substance over the whole span. Ithas to be made clear what the boundaries of the system are and what kind of internal and external costs are considered.
- LCC and TCO are sometimes stated to be the same, but TCO have clearly an internal focus. This concept was first applied and popularized for IT hardware and software. That means, TCO concentrates on the scope of the focus company gate-to-gate and internal costs. So, the information for a traditional investment appraisal is provided.
An additional remark on the spelling of the terms should be mentioned: Sometimes they are written with capitalized letters (all the words or only the first one). Mostly cost is singular, but costs as a plural form can often be found too. The advantage of this confusion is that few errors can be made.
To go into the details of TCO, Table 15.2 offers an overview of typical phases of a gate-to-gate life cycle. This model concentrates on technical equipment like drives, new metering devices, furnaces, air conditioners, and so forth.
A stunning number clarifies the immense relevance for ISO 50001: Energy cost may be up to 95 percent of the total costs of ownership of an electricity-intensive asset. Hence, if accounting does costs to the asset, the potential to cut costs is not recognized. Procurement takes the wrong path if it only compares the acquisition price for energy-related technical investments. On the one hand, it is so easy to get the offers and choose the cheapest one; many procurement departments are sticking to this routine. It is considerable work for different departments to calculate the TCO. The method differentiates between costs directly assigned to the equipment (like buying price) and indirect costs not allocated (preparation of purchase, maintenance, or energy). TCO invites the company to turn indirect costs into direct ones allowing for better decision making. (It should be noted that direct and indirect cost are used here differently from cost accounting, where the assignment to our products is in focus.)
Table 15.2 Phase of gate-to-gate life cycle to calculate TCO
|
Phase of life cycle (within a focus company) |
Sample type of cost (internal, nonsocial) |
|
Purchasing including all preparations (total cost of acquisition) |
|
|
Construction, installation, test, and startup |
|
|
Operations of the device itself and related assets (floor space, media, and energy supply, if assignable) |
|
|
Deinstallation or deconstruction and disposal |
|
Assets, which have an influence on energy consumption, are pushing this problem with new intensity. Even if they are not in the 95 percent topping the list, ovens, air conditioners, trucks, heaters, and so on may easily surpass 50 percent energy cost of TCO. As the expected useful life may easily span decades, the development of the energy price plays an important role.
Beside those assets directly consuming energy, other equipment with an indirect influence have to be analyzed. Examples are insulation, technical control systems, or energy recycling. The complete technical system has to be understood, the interdependencies have to be mapped, and the context of organizational procedures has to be taken into account.
Optimal Replacement Point
Energy-consuming devices like pumps, drives, and heating systems can stay in operation for very long, with good maintenance for decades. I visited a foundry with a coal-heated furnace dating from 1899 (no mistake in the century). Technical innovation, shifting prices, or changes in capacity utilization can contribute to reaching the optimal replacement point. In practical management and operations, this means scrapping an asset during its useful life, a psychological difficulty. In literature, sophisticated models to calculate the optimal replacement point are available, but they often don’t meet the needs of practical decision making. Table 15.3 presents a hands-on calculation tool for a quick and effective decision as to whether machinery should be replaced. The numbers are derived from a project in a power plant.
Table 15.3 Calculation of replacement point
|
Cost type |
Electric drive in use |
Replacement option with automatic regulation and improved energy efficiency |
|
Energy cost per year |
240,000 euros |
150,000 euros |
|
Other operational costs (maintenance) |
Equal for both options, so not relevant for calculation |
|
|
Depreciation linear over 20 years, per year |
zero euro |
7,500 euros |
|
Interests (5%) |
zero euro |
7,500 euros first year, then sinking because of declining salvage value |
|
Overall costs per year |
240,000 euros |
165,000 euros |
In this example, the pump was 50 years old and fully depreciated. In any case, the optimal replacement point has to be calculated by looking only into the future without minding sunk costs, which are fixed costs determined in the past. If we have a better opportunity for the future, it is irrelevant how much money is sunk into an investment or if it is already depreciated. It is courageous to scrap a fully working machine, air conditioner, or compressor. Who is responsible for this waste of money? That could be the conventional reaction of the superior. Savvy bosses praise such action, saying: “Great, we learned something and you took action.”
Vendors of technical equipment and engineering service companies tend to oversize assets. They make more money doing so and avoid any reproach that the capacity they provide is insufficient. The negative side can be an increased consumption of energy. Companies should check regularly to see if all the capacity installed is needed or if conditions shifted, and it pays to replace equipment.
Sensitivity Analysis
A critical point is often the percentage to which energy savings are possible when considering a replacement investment. Sensitivity analysis helps to structure the problem; one variable (the percentage of cost saving) is changed to see the impact on a decision criteria (like the payback period). Figure 15.1 contains an example of an investment about 100,000 monetary units with a yearly energy expense of the same 100,000 (those assumptions may be realistic for electric drives, radiation heating, or lighting in Germany).

Figure 15.1 Sensitivity analysis
To begin from the right hand side of the scale, the measure would pay off in one year if energy savings would be 100 percent. Going to the left, the effect of lesser savings can be monitored and the decision maker can match the probable outcomes of the investment with his economic requirements.
Other independent variables are possible, for example:
- The investment level (which is demanding to set in complex technical projects)
- Prices of energy
- Technical parameters (thickness of insulation, dimension of pumps)
- Interest rate
Business intelligence may help to provide sensitivity analysis of different kinds and in varying combinations in order to understand investments in a playful way. But, the old-fashioned approach can be effective as well. In many cases, it is possible to get a quick insight with paper and pencil. The technical experts have to first contribute numbers according to rough thumb rules just to check if a green zone could be reached. Afterwards, time and money can be invested to elaborate a measure.
Payback Period Versus ROI and CSR
Some companies (especially before the crisis of 2008) have the internal guideline that every buck they invest has to be paid back in two to three years. This does not match with the growth rates of economies as a whole, and the expectations thus have come down. But still some companies are struggling to limit the payoff period to four to five years. A deplorable consequence is that many investments in energy efficiency have useful lives of decades and no chance to pass this gate.
Here are two model calculations showing the difference in investment appraisal for short and long terms. They have the potential to reconcile the differing views. As interest rates are extremely low at the moment, the model is static without interest effects; thus the core idea is featured more clearly. In Table 15.4 are the assumptions and outcomes for the short-term investment.
Company Example
Last year, I had a workshop, and one participant was the energy manager of a global player. He complained that it is not fair to consider those long-term investments with the same indicators as a machine that is scrapped five years later or a product with a short life cycle. In this case, he was fighting against management accountancy being strict about it. Large companies tend to be bureaucratic.
Table 15.4 Model calculation profitability short term
|
Investment sum, budget: |
any number—no influence on results which are expressed in percent |
|
Useful life: |
five years |
|
Costs cut per year in comparison with investment sum: |
25% |
|
Payoff period: |
100% investment/25% flowing back every year = 4 years |
|
Net present value and ultimate value (same in a static calculation without interests): |
5 years × 25% yield per year = 125% of investment sum |
|
ROI every year of the lifetime: |
25% overall yield/5 years lifetime = 5% ROI per year |
This project meets the sharp decision criteria of a payback period of four years. But there is only one year of useful life left to get an ROI. Thislast year would provide 25 percent ROI for the whole five-year life span, so an ROI of 5 percent per year is yielded. As we don’t integrate interest in the model, the net present value and the ultimate value are the same—125 percent of the investment budget, which does not depend on the concrete number. In comparison, initial facts and results for a long term project are displayed in Table 15.5.
Table 15.5 Model calculation profitability long term
|
Investment sum, budget: |
any number—no influence on results which are expressed in percent |
|
Useful life: |
20 years |
|
Costs cut per year in comparison with investment sum: |
10% |
|
Payoff period: |
100% investment/10% flowing back every year = 10 years |
|
Net present value and ultimate value (same in a static calculation without interests): |
20 years × 10% yield per year = 200% of investment sum |
|
ROI every year of the lifetime: |
100% overall yield/20 years lifetime = 5% ROI per year |
Many companies would not decide for this long-term option, because the payoff period exceeds a decade. (When the time is longer, interest becomes more important and the payoff period is extended.) But after the first 10 years of operation, there is another decade left with 10 percent cash flow every year! So net present value and ultimate value double the budget invested, the overall profit of the project is 100 percent. The ROI per year is again 5 percent because the overall profit of 100 percent has to be divided through a life span of 20 years. But the assumptions were worse, 10 percent per year in the long-term investment versus 25 percent in the short-term calculation.
What does this mean for corporate planning and decision making? The often favored investment criterion payoff period is an indicator of risk, not an appropriate indicator of profitability or profits. If ROI, net present value, or final value are considered additionally, the decision is more sound. Every company has to decide for itself which indicators to apply. Moreover, the intangible effects of an investment have to be considered, and the strategic and ethical dimensions must be involved, as explained in Chapter 11.
Undoubtedly, it is reasonable to fix threshold indicators for investments systematically for a whole company, but a lot of exceptions may arise. The following are examples applicable to energy and beyond:
- A device that is broken and has to be mended immediately at any cost to keep up operations.
- A risky investment in a product may be necessary to keep pace with a competitor.
- Psychological reasons may enter the game; a manager could favor a prestigious investment building their own monuments.
- An action plan is simply the result of corporate power play overcoming reasonable systematic decision making.
Energy Payback and ERoEI
An indicator constructed with similarities to the economic payback criterion is the energy payoff or payback. It may be applied to investments on energy efficiency:

The ideal case is an optimization of control of air conditioners, furnaces, or other devices with nothing more than attention and clicks of a mouse: The payback is near to zero. On the other side, a bad investment (in this view) may not play in the energy investment in the useful life.
Another field of application is renewable energy power stations of any kind:

To give examples, wind power stations need some months to return the energy invested, and solar cells need time in the range of years depending on various factors. It is disputed if this indicator may be applied to fossil power plants, because the operation needs constant energy input and part of this input will even be lost. In contrast, green technology profits from the abundance of wind or sun. A technology such as a heat pump is a hybrid requiring energy input in operation, but the generation benefits from renewable energy from the surrounding air, soil, or water (see Chapter 6).
It is important to state that carbon is another important view and application of this indicator. With the help of the carbon factors (Chapter 2), quantities of energy carriers can be conversed into carbon emissions. Thus, a carbon payback period can be determined paralleling the energy calculation. The energy and carbon application of payback need considerable technical input and know-how involving value networks. Asa facilitation in comparison with cost and revenue indicators, interests or taxes don’t have to be introduced into the models.
ERoEI is almost the inverse of payback, but this indicator refers to the whole lifespan of an investment in efficiency or of power generation:
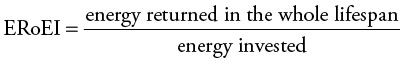
The ERoEI of wind power stations with a useful life of 25 years reaches 50 or more. The indicator can be applied to mining of fossil energy as oil in sand or schist: The ERoEI can be (with a broad band) about five. That means five barrels of raw oil mined need the equivalent of one barrel of energy input. An indication that extracting sand or schist oil is energy intense, costly, and land consuming.
Subsidies for Investments
Energy investments may profit from subsidies because of the public interest in fighting climate change. A company should check whether the following options are possible:
- Direct subsidies (money for investments in certain technologies like combined heat and power generation, insulation of buildings, etc.)
- Tax incentives
- Low-interest-rate loans for investments
- Guaranteed prices for microgeneration
- Cost-free or low-cost consulting from environmental or energy agencies or associations of companies
One should also consider the support of universities hiring a student to do work toward his bachelor or master’s thesis. It is a win-win-win situation:
- You will benefit from a highly engaged young person at the threshold of being a professional at low cost. If she or he is good and you have got a vacancy, you can offer him a job afterwards; the job interview and adjustment are already completed.
- The student learns more than just writing a thesis for the shelf, earns a living, and has better qualification when going for a job (in your company or elsewhere).
- The advising professor contributes with his background know-how (which can be very valuable in the dynamic field of energy) and widens it by applying it at your company.
Human Resource Management (Competence, Training, and Awareness—ISO 4.5.2)
Criticism of the Structure of the Standard Pertaining to the Next Three Chapters (16 to 19)
According to plan, do, check, act cycle, the planning is finished and the do is reached at this point. The standard may be criticized for this structure, because training to convey competencies and awareness is not only doing, it has to be planned as well.
A further critical point pertaining to the structure of ISO 50001 should be mentioned. The next three chapters are so closely interlinked that the separation seems to be arbitrary: “4.5.2 Competence, Training and Awareness” relies on “4.5.3 Communication.” An important tool of communication is provided by written documents, so “4.5.4 Documentation” has to be included.
The idea of this section of ISO 50001 is simple: Every member of the organization has to be aware of his role in the energy management systems (EnMS), and every person has to be endowed with the necessary abilities on her or his exact place. Training is the main instrument to reach this objective. The organization of training is the job of human resources (HR) or personnel management. Different views help to structure the measures necessary:
- Life cycle of employees in a company
- Business domain and function
- Trainers and various trainings
The life cycle of employees includes selection, hiring, and continuous on-the-job training (firing and retiring is not of relevance here):
- Selection process of staff: Introduce questions of attitude toward sustainability, environment, energy, and values into checklists for the job interviewer or assessment center.
- Hiring: Introduce the main documents for the position and check if any knowledge gaps in regard to the job description has to be stated. Establish appropriate trainings to cover this.
- Constantly confirm that new competence requirements are arising and integrate them into regular appraisals with the boss.
Another perspective shows up when looking at the role business domain,and function within the firm:
- Elaborate lists of desirable energy know-how for logistics, facility, production, purchasing, and other managers.
- The energy manager and his team have a double role: On the one hand, they are the ones pushing the process forward (personnel department is just executing and is a tool from this side). On the other hand, they have to keep their knowledge up to date themselves.
Different sorts of training and trainers could structure training measures:
- In-house training or seminars out of the house
- Short or long period of time
- Individual or standardized
- Costly or provided cost-free by associations or agencies
- Costly or provided cost-free by public agencies
- The respective supervisor or an expert from outside the department instructing staff
The register or catalog of legal requirements should be consulted to make sure that everything is covered (Chapter 12). Again, energy training has to be part of integrated training measures. As quality and environment do confront companies with much higher requirements, energy should be integrated into the corresponding teaching infrastructure. A decisive point will be the budget and allowance process for training measure. Work councils or trade unions should be involved according to the legislation and habits of the country and branch.
Table 16.1 Qualification matrix for exemplary energy related competencies
|
Qualification, type and content of training, duration |
||||
|
Overview EnMS and good housekeeping, few hours, in-house, trained by energy manager |
Know-how for procedures (e.g., load management), hours to days duration, in-house by energy manager or energy team member |
Special know-how (e.g., energy procurement), duration depending, external training |
||
|
Participant or target group of training measure |
Every company member |
x |
||
|
Everyone involved in the respective procedures (e.g., facility management, production planning, etc.) |
x |
x |
||
|
Specialists (e.g., buyer) |
x |
x |
x |
|
To gain an overview and define standards, a qualification matrix should be developed (see Table 16.1).
Repetitions and updates have to be planned in addition to this first matrix, covering all requirements while not wasting colleagues’ time and company money.
Marketing (Communication—ISO 4.5.3)
The standard mentions three fields of action in this section:
Internal communication (giving the name to this chapter of the standard) is mandatory; it can be effected by trainings (see Chapter 16), by written documents (see below) or, for example, by talking to people.
Suggestions of improvements must be included, as well, but depending on the size and scope of the organization, this can be carried out in a rudimentary form. It has to be ensured (and documented in some way) that everybody is asked about improvement ideas and that the ideas are evaluated and put into effect if approved.
External communicationhas to be also considered by the organization, thus the whole fields of marketing, public or investor relations, financial and sustainability disclosure, and the like are involved. It can be decided that no external communication should take place.
Marketing will follow broadly the overall sustainability, environmental, and energy strategy of the organization (Chapter 11). A follower company will try to keep energy invisible in his marketing campaigns. Companies implementing ISO 50001 will be leaders and should make use of their achievements as an additional buying argument. In some markets, a good energy management could be in itself or could contribute to a unique selling proposition (USP)—for example, selling green energy in utilities, the building industry, or the car market. The dominant argument will be the product itself being energy efficient, but to convey a complete and credible image to the customer, a powerful energy management systems (EnMS) in producing the products is important.
The customer type Lifestyles of Health and Sustainability (LOHAS) stands for a trend looking at the whole life cycle of the products that are consumed and the companies behind them. LOHAS are educated, have a good income, and are well informed by using smart technologies. Hence, if a company wants to achieve a USP attractive to the LOHAS markets (or wants to reach suppliers), all 4 Ps of the marketing-mix have to be considered:
- Product: Energy efficiency of the product itself has to be top and also the operations in the background including the supply chain or value network.
- Price: Energy efficiency allows in the long run for low manufacturing costs, but an image of sustainability leads to higher end prices and widens the gap of net profits.
- Promotion: The whole toolbox of advertising, public relations, sales organization, and sales promotion has to be tapped. Some new developments linked to an EnMS will be discussed in the following.
- Distribution (place): The physical logistics of products pose a problem, because transportation is energy intense. For example, in February, an organic apple was consumed in the north, but grown in Argentina. This cannot be called sustainable as the apple embodies several thousand miles of transportation. As a result, companies have to discuss the role of emissions according to transportation and the distance of markets they want to serve in their overall energy strategy and communication.
Let us combine IT (Chapter 7) with disclosure (Chapter 8), energy performance indicators (Chapter 14), and draw the conclusions for promotion. More and more disclosure systems supporting the company’s legitimation can be found and the information reported to the public can be accessed ubiquitously. No doubt, businesses and consumers are getting used to handling big data, and therefore, sustainability data is part of that trend. Companies should prepare to get their data available, to base their planning on it and to get ready to disclose where they stand and what they have achieved. New apps inform the consumer in the shops about the ecological balance of the products. Customers will use more and more choice engines to process the flood of data and to get what they want (Thaler and Tucker 2013, 50).
Some companies seem to have adopted this trend and invest heavily into marketing, sometimes without the background performance and achievements necessary for such a self-confident appearance. In the future, the markets will punish some factors that contribute to greenwashing more quickly than they do today. Sustainable management accounting is evolving, disclosure systems establish themselves, and smartphones providing access to data will become global standard. In addition, terms like shit storm (a massive reaction of a great number of Internet users) triggered by minor misconduct were unknown a few years ago. The advice to companies is to be consistent, consolidated, and credible.
Quality Management (Documentation—ISO 4.5.4)
Documentation goes hand in hand with organization, which is the crucial factor of integrated management (Chapter 2). Companies already have written rules that, in many cases, framed quality management (QM) and other systems like environmental management. Energy requirements should be integrated harmoniously. Figure 18.1 provides the hierarchy of documents frequently found and proliferated especially in QM literature as a starting point.
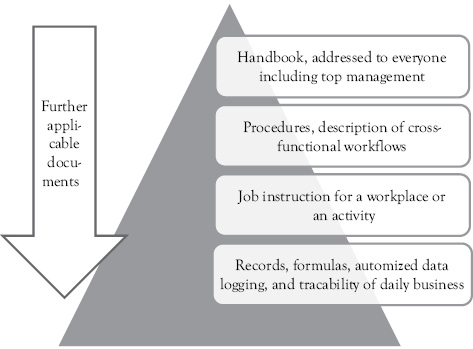
Figure 18.1 Hierarchy of documentation
At the top of the hierarchy, a handbook contains information relevant for the whole company with (ideally) long-lasting validity; for example, the energy policy, organizational charts, and a description of the documentation system itself. Further applicable documents have to be listed completely covering the respective following level.
The next level of cross-functional procedures does not pertain to the company as a whole, yet some departments or at least different sorts of workplaces within a department are touched. Some examples include:
- Energy demand planning and load management (involving procurement, disposition, production planning, production, etc.)
- Investment approval (involving accounting, finance, and departments with noteworthy investment needs as production or FM)
- Media supply in operations (involving FM, production, energy supply in own power plans if existing)
If only one type of workplace was to be covered, job instructions describe, for example,
- What the tasks, responsibilities, and competencies of the energy manager are;
- How production planning has to assign a job to a machine with the highest energy efficiency; and
- How to operate a cooling warehouse.
The records of daily business could be
- The old-fashioned way of, taking notes on a paper;
- Writing or logging into IT to state that an operation is completed; or
- An automated IT-supported recording of workflow progress.
A critical point comes up if deviations occur. According to ISO 50001, evidence of verification, preventive action, and corrective action has to be provided in any procedure.
What are the different ways of editing the documentation and publishing it within the company? The following steps of development can be observed:
- The traditional paper will fade out in the long run, but it will preserve its existence in niches for a long time in the future, especially on the lower level of records. Furthermore, notice of receipt for documents may be necessary for environmental, safety, or other risk-related instructions. Such rules can be countersigned in paper form with a greater awareness than just using IT signatures.
- Online documentation in the Intranet in noneditable format like PDF will be always current and no confusion about the version will arise. It is easily accessible with reading or writing permission for employees or company officers. An easy and cheap way to transfer paper into online files.
- Online documentation with integration into enterprise resource planning and other relevant software, already deployed, is an elegant and efficient way. The IT supported workflow system provides many templates and customized procedures in operations management, building services management system, logistics, and so on. Additional cost of implementation has to be considered.
- Content management systems(CMS) such as Joomla!, WordPress, Wiki, and Typo3 are designed to manage all the knowledge in an organization. Employees may access with an intuitive browser surface. Those systems make use of the Wikipedia method.
How does such a structure support an effective integrated management? An undesirable development especially for small and medium-sized enterprises (SME) would be to establish such hierarchies of documents in isolation for quality, environment, energy, safety, organization and leadership, compliance, and so on.
Company Example
An employee at lunch with a technical manager of a chemical company expresses his frustration: “I have to work overtime this week, those certification guys are under way again. All those papers and lists they want to see, just hindering me from doing my work. If archeologists are excavating our company in a thousand years, they will suppose having found a paper mill and not a chemical plant.”
How might we avoid such problems? The same physical or administrational operations are only seen from a different point of view; the documentation should preserve the source and unity:
- SME should follow a strategy of strict integration—one company handbook, one documentation system edited by one staff unit for all aspects of integrated management.
- Every member of the organization should find the relevant rules for their own position easily, in one chapter, in a dossier, in an index, or a register. This could facilitate integrated certification audits.
- These recommendations will not be feasible in large companies and company groups. For each case, the appropriate degree of separation and integration of the documentation has to be found.
- Look at the problem from the innovative perspective of knowledge management with internal Wikipedia. Creativity and engagement of company members can be fostered by providing the right IT tools.
Maintenance (Operational Control—ISO 4.5.5)
Maintenance consists of inspection, servicing, repair, and technical improvement. Three strategies can be named:
- Breakdown, failure, outage caused, or malfunction maintenance: A device is not checked until it fails, only then measures of maintenance will follow. This strategy is only appropriate for assets of low cost, without the potential to interrupt larger parts of the production system. A broken drive of a conveyer of an assembly line could cost $10,000 per minute in the car manufacturing industry because of the work coming to a complete standstill. Furthermore, the deferred maintenance should have no significant influence on repair costs. If the motor oil of a car is not filled up and replaced regularly, the whole motor will be damaged and has to be replaced completely. Complex industrial plants need the definition of several hundred thousands of different maintenance objects. Many companies have not reached that standard completely, and many technical devices are just wearing and deteriorating until they fail, even if this strategy causes avoidable costs.
- Preventive or prophylactic maintenance: Here, the opposite of breakdown maintenance is marked. After a defined period of use, a device will be replaced without regard to the current technical state. This costly strategy has to be applied for assets with an extremely high cost impact if they fail (just like the previously mentioned drive of the conveyor assembling vehicle), if repair is only possible at special periods of time (shutdown of a refinery for an overall revision), or if safety concerns dominate (primary cooling cycle of a nuclear power plant).
- Predictive maintenance: A device is monitored continuously and appropriate measures are taken in time to keep up a defined technical condition.
This last mentioned approach, condition-based predictive maintenance, shows the link and opportunities related to energy management and operational control. Assets like drives or energy grids of all kinds do lose energy efficiency if they are not maintained properly. Let us look at the example of a car, easily accessible for nontechnicians. Some modern cars are endowed with a control system surveying factors like energy consumption, temperature of engine, and oil pressure to measure abrasion. If anything goes wrong, the driver will be asked to schedule an appointment at a car repair shop. Advanced systems observe the deterioration and indicate need for a service inspection according to the current state, not only relying on fixed intervals of time or distance. This example may be transferred to nearly every complex system with the advantages of alerts if tolerances are left (including energy efficiency) and lower maintenance costs (because of exactly timed intervals). Smart metering and improved IT capacities help to maintain more and more assets according to this preferable strategy, keeping costs of operational control low.
An important part of maintenance pertains to meters, sensors, data transmission, and all other kind of measuring equipment. While establishing an energy management system, most companies can build on quality management, which is always specialized in this field. Furthermore, statistical methods may help to detect and interpret deviations, outliers, or to complete series if readings are lacking for some reason.
By monitoring technical performance indicators and energy performance indicators continuously, emergency situations and possible disasters can be avoided. Furthermore, energy has to be integrated into emergency plans in several ways; for example, shutting off electricity grids to avoid shocks to fire fighters and avoidance of burning or blasting of energy tanks, and at the same time, providing energy for emergency measures, and so forth.
Procurement of Energy (Design—ISO 4.5.6 and Procurement—ISO 4.5.7)
Overview
Structure of ISO 50001 and Next Chapters
The following chapters of ISO summarize a large bundle of interlinked activities: “Design” (ISO 4.5.6) and “Procurement of Energy Services, Products, Equipment and Energy” (ISO 4.5.7). The design section 4.5.6 claims that “The organization shall consider energy performance improvement opportunities and operational control in the design of new, modified and renovated facilities, equipment, systems and processes” (ISO 50001:2011, 10). The procurement section 4.5.7 requests to take into account the effect on energy performance of “expected operating lifetime when procuring energy using products, equipment and services.” Procurement of energy itself is included here as well (ISO 50001:2011, 10).
The paragraphs present a mixture of assessment of technology and administrational processes impacting a wide range of business functions. Therefore, the following chapters 20 to 26 of this book make use of this broad approach demonstrating the core ideas of energy management in business functions.
In utility companies or large energy-intensive firms (gypsum, concrete, foundry, or chemical), specialized energy procurement or trading departments are established with considerable man power and know-how. In other industries and for small and medium enterprises (SMEs) with a lower impact of energy on total costs, the procurement department of a company usually provides energy as one of several goods they are responsible for. In the past, this was appropriate and not a very demanding task:
- For the procurement of oil, coal, and other storable fossil energy carriers, markets have to be observed with ordering low prices. The same applies to compressed gas in tanks. Cars and trucks get their tanks filled by the driver if it is empty—a sort of decentralized procurement with few possibilities to vary in time and price.
- Natural gas is delivered through pipes on the basis of an overall contract (full supply contract with a utility).
- Electricity is provided likewise streaming through wires with full supply provided by a utility company with a constant price at any time.
- Further forms of energy needed in a plant are generated with other forms (compressed air, cold or warm media, steam, etc.).
In the future, rising prices and volatility of (electricity) markets are game changers. The next chapter offers an overview of the opportunities and variables energy procurement has to attend to increasingly. For oil, gas, and so forth, the known methods of procurement can be applied, but for electricity, Chapter 20 describes innovative tools. Contracting in Chapter 21 means that company-owned energy-generating assets (e.g., heating and cooling system) are taken over by utility companies. Besides procurement, microgeneration opens up the option of selling energy generated on-site; it makes sense to bind this function to procurement in the structural organization. Table 20.1 gives an insight into the complexity of future energy procurement and trade.
Table 20.1 Overview of methods and challenges of energy procurement
|
Methods of procurement |
Storage and conversion |
Other options besides storage to avoid price hikes |
Influence on CO2, use of renewables |
|
|
Oil, coal, compressed gas |
Traditional market observation, chart analysis, lot-sizing methods |
Easy storage depending on size of tanks and so forth. |
Long-term delivery contracts. Hedging at energy exchange |
Liquid burnables from biomass and biogas. Influence up to 100% (see CO2-factors Chapter 2). Coal: no influence |
|
Natural, noncompressed gas |
Full supply contracts with utilities |
Storage in large tanks and caverns, large companies and utilities with access may buy at low prices |
Long-term delivery contracts. Utilities: hedging at energy exchange |
Up to 100% buying biogas |
|
Electricity |
Traditional full supply, in future: tools like in the following chapter |
Accumulators (expensive) conversion into heat, compressed air, and so forth which can be stored for hours or days |
Long-term delivery contracts. Portfolio management and hedging at energy exchange |
Up to 100% buying green electricity |
|
District heating |
Voluntary or mandatory contract |
Only for some hours or a day steering temperature |
No, but normally good prices because of efficient energy use or use of waste energy |
The provider of district heat has influence, the buyer does not |
|
Internal energy (steam, cold stores, compressed air, etc.) |
First level: No contracts needed, multiple options of energy conversion, and storage to allow for demand side management (examples, Chapter 6). Developing those innovations, energy could make money in the long run. Important contribution of a firm to balance a green energy net (without being able to express a percentage like in the other lines of the table). Second level: External control as part of virtual power plant. (Well to combine with energy contracting in the next line.) |
|||
|
Contracted energy |
The contractor provides heat, cold, compressed air, and so forth at the very spot of use investing and operating the facilities in the buildings of the company |
Multiple options of demand side management like forgoing line |
Facility contracts last typically for 10, 20, or more years. Efficient technology and the know-how of the contractor help to keep cost low. In the first years saving by beating the previous base line of costs |
Often going green or at least being more efficient is one of the motives for contracting |
Short-term operational procurement (maximum time horizon of one year) is one of the first things to look at when tackling energy. A change of contract may cut expenses very quickly at no cost, adding immediately to the bottom line. Strategic procurement with the crucial question of energy mix involving renewables is of even greater importance than the first quick wins. In addition, it is of greater complexity because the long-term energy mix depends on investments in energy and other equipment.
Procurement of Electricity
The changes that the whole electricity market and supply chain are undergoing were explained in Chapter 6. What does that mean for the electricity procurement of companies? Three steps of energy contracts and procurement styles have to be separated:
- A standardized contract of full supply with one utility or energy trading company
- An individual contract for companies with higher consumption and more market power
- Procurement at the exchange (using intermediators)
Standardized Contract
Standard tariffs providing electricity at any time for a constant price will fade out in the long run. Sometimes meters allow for two prices, a higher one in the day and a lower one at night. That is a first try to convey scarcities to the consuming entity, becoming inappropriate when solar power is flooding the grids at midday.
Individual Contract
Individual contracts for companies contain some agreements beyond full supply contracts for households and small businesses:
- Load price (fixed-base price per period for the provision of a certain amount of load in kilowatt)
- Maximal load (kilowatt the customer is not allowed to exceed without extra charge)
- Working price (price for every kilowatt-hour actually used in a period of time)
- Connection devices (transformers and the question of who operates them)
- Reactive current (power factor)
- Duration, liability court
Price variability is often included, as are duration of fixed prices, indexed prices, or price escalation clauses for coming months or years. This should be elaborated to convey current intraday scarcities to the companies to allow for demand side management.
Procurement at the Exchange
Few companies will ever buy directly at the exchange: Specialized trades have to be hired (not only one to assure time-coverage and representation, IT-tools and their maintenance, fees etc.). But, besides utilities, other service and trading companies bridge the link between consumer and exchange. The idea of a purchasing association may be applied here as well. Consequently, every procurement manager, even in an SME, has to be informed about the rules of the game to find a right place and the advantages for his or her own company.
The core idea is to construct tariffs through the energy supply and trading chain so that scarcities are modeled through prices and adaptation of behavior; for example, load management is rewarded. It makes sense to imagine what a company should do if it could act directly at the exchange or would be responsible directly to do its part to balance the grid. The starting point is the company’s demand; Figure 20.1 gives a graphical presentation of the load over a working day.
The mathematical integral (area beneath the load curve) represents the energy consumed. How to cover this demand? Figure 20.2 shows different types of procurement methods or contracts available; they are bundled in portfolios (portfolio management). This is, of course, a simplified form, because in reality the time frame, intermediators, call and put options, bundling of products, and so on are only accessible to experts of the financial markets and exchanges.

Figure 20.1 Load curve and energy demand

Figure 20.2 Portfolio management in energy procurement
A core notion underlying the system is the prediction of consumption being able to go ahead of balancing demand and supply. The simplest form of predictability is the baseload used 24/7. Lighting, pumps running round the clock, and so forth form this basic block of demand, coverable mostly with relatively low costs.
Block and hourly contracts (peak load) consist of energy purchased for fixed hours a day, for one day, on working days only, or throughout the week, for an agreed period of time. Those blocks could be only optional, intraday, or for a period years ahead of time. The intraday market triggers normally physical flows of energy; future markets serve for hedging and speculation. Financial investors enter energy exchanges as field of their business activity. The trading volume exceeds the physical energy multiple times.
Balance energy or unscheduled energy flows (another form of peak load) have to be purchased at any price to uphold operations, if no form of load management is applied. Hence, there is an incentive to predict the load curve exactly.
The duration curve demonstrated by Figure 20.3 is an additional instrument that helps to analyze demand. In the style of an ABC-analysis, the high load peaks are arranged at the left side and the low electricity demand is shifted to the right side.

Figure 20.3 Duration curve
Company Example: Outsourced Energy Procurement
There was the opportunity to follow the development of Enoplan, a company purchasing energy for retail chains, checking their invoices (which can be complicated), and performing load analysis to identify options for increased efficiency. The company was a start-up first and then integrated into TV, a large group. The managing director Ralf Schade is pushing forward the business model. At its beginning in 1990, the company had a single-digit number of employees. Now, the threshold of 100 is broken with a considerable surge following a strategy of internationalization.
Direct Marketing of Company-Owned Renewable Generation
Microgeneration offers some related opportunities and challenges. Let us distinguish some typical situations:
- A company operates solar cells or wind turbines on its roof. In many countries, a fixed feed-in compensation makes accounting easy.
- To balance the grid, microgeneration operators are more and more pushed to market their energy directly at the exchange, normally with the help of partners, utilities, energy service companies, and traders.
- However, if internal consumption is more profitable, accounting and technical controlling becomes more complicated. Batteries could be used to buffer electricity in order to increase the portion of energy consumed by the company itself. Combining it with other types of load management (storage for compressed air, cold warehouses, etc.), the overall production planning system has to be enhanced.
- If all of this seems to be too complicated, appropriate space on rooftops or lots may be leased out, which hands over the risk to the side of the investor.
After all, energy procurement as a process is demanding for the procurement department. To determine demand and manage load, the energy-consuming units have to be involved, especially operations planning. An energy department with responsibility for assets like heating and so on is playing its role. Managerial accounting indicates all the procedures in their system and consults all the others on how to invest and operate the company as a whole.
Finance and Contracting to Procure Energy (Design—ISO 4.5.6 and Procurement—ISO 4.5.7)
Industrial companies usually invest in their energy assets themselves and operate them alone. Typically, heating, air conditioning, supply of compressed air, and so forth are located in the basement or on a nearby building supplying a production site. The idea of contracting is to let such energy assets be decided upon, invested, and operated by specialists (contractor, energy service company). It is not the core know-how of the nonutility company (contractee); for example, a mechanical engineering or pharmaceutical company, to ensure the energy and media supply. If specialists like utility companies take care of this, the contractee gets resources free for the core business, and the contractor can deploy his or her expertise to increase energy efficiency and reach savings. In other words, utilities as contractors do not only sell energy (oil, gas, electricity) as inputs for corporate energy-conversion processes, but also provide the form of end energy in the desired quality. For example, compressed air, heat, steam, and cold air have to be available in certain time frames with given temperature, pressure, and so forth defining fines if the contractor fails. An interface has to be defined as the point of transfer; a contractor could even operate and maintain the energy grids inside the plants.
A good opportunity to think about contracting is when investments in energy assets have to be made anyway. The performance of the contractors may be tailored choosing from the following catalog:
- Planning (if only this is provided, it is a conventional service)
- Investment and construction (the contractor provides the liquidity for the investment and the contractee has no upfront costs)
- Operation and maintenance
Metering and controlling of operations allows for different types of financial recompense for the contractor. A fixed price for energy as the traditional way could be transferred into a win-win situation and seen as an incentive for both to head for efficiency: Before the retrofit is made, a baseline is compared to the costs afterwards, savings are divided by a ratio or more elaborate rules between the partners (energy savings performance contracting). Thus, the consuming company profits when it supports the contractor in peak shaving, load management or maintenance shutdown, and so forth. Large contractors operate remote control rooms for all of their contracting projects and provide better monitoring and control than a small and medium enterprise ever could.
Procurement Other than Energy (Design—ISO 4.5.6 and Procurement—ISO 4.5.7)
In this chapter, maintenance, repair, and operations materials (MRO) are addressed, focusing on industrial companies and excluding the already discussed energy commodity itself. In terms of a balance sheet, floating capital is touched (whereas the following chapters provide a wide range of energy-related equipment qualified as fixed capital). Typical examples are maintenance, repair, and operations (MRO) materials; for example fittings, screws, tubes, and so on for maintenance and repair, or raw material for operations. Desktop purchasing by catalogs on the internal websites is an efficient, quick, and environmentally advantageous tool of procurement. Retailers of such goods are confronted by similar decisions.
A first important impact of procurement on energy for such goods is sourcing and logistics, the distance covered, and the transportation method chosen (see next chapter on logistics). Furthermore, procurement has considerable influence on the supply chain in all sustainability affairs. It should be visible to the vendor that, for example, employee standards, clean environmental production, and energy efficiency serve as criteria to get an order. Procurement should not choose the cheapest provider but the best one. Companies relying on a credible sustainability and energy policy will consider rewarding good sustainability standards of providers with a slightly higher price. It is important to communicate this in the value network to providers, customers, and other stakeholders.
The informational basis of all those decisions are life-cycle assessments (LCAs) introduced in Chapter 13. Part of procuring may be a make-or-buy decision. With this comprehensive perspective of LCA, outsourcing will relieve the (energy) balance of one company and burden the one of the provider. A positive overall effect will be reached if outsourcing to specialists leads to economies of scale and increases in efficiency, so that they achieve better energy performance indicators.
In other branches like food or clothing, value-based procurement decisions hiking down the supply chain are a decisive leverage for sustainable development. Local sourcing of organically grown food, substituting meat by plant products, or labor standards in the textile industry are examples. Here, the responsibility of every end-consumer has to be pointed out in influencing value networks by daily buying decisions.
Logistics and Supply Chain Management (Design—ISO 4.5.6 and Procurement—ISO 4.5.7)
Overview
Logistics is defined by the six Rs; the
- Right material has to be at the
- Right time at the
- Right place in the
- Right quantity in the
- Right quality to the
- Right costs
To cover this field, the whole procedures of material requirement planning, purchasing, incoming transports and storage, inward material handling and transportation, and distribution logistic have to be covered including all the technology used. Supply chain management (SCM) optimizes the cross-company transport and information processes. Following the trend of the modern world, logistics and SCM are growing more complex, and energy contributes to this development considerably. That is the reason why this broad and complex understanding is followed here. What are the tasks that the logistics function in an industrial company has to fulfill? Table 23.1 provides an overview of material logistics with typical departments and external partners as players. The rules of the game, the denomination of departments, and the assignment of roles can be quite different.
Table 23.1 Overview of the tasks of energy-oriented logistics focusing on an industry company
|
Fields of action |
Procedures |
Equipment and vehicles |
|
Inbound material management, storage, and transport |
Warehouse management, storage, goods received and dispatched, in-plant transport, material handling and commissioning, quality control, maintenance, good housekeeping |
Conveyers, forklifts, commissioning equipment, stores and warehouses, receipt and dispatch halls with all infrastructure as heating, cooling, compressed air, pumps, and so forth (Chapter 24 about facility management) |
|
Procurement, purchasing, sourcing |
Purchase of goods other than energy (Chapter 22) Purchase of logistics services (following sections on evaluation of transportation means and networks) |
IT equipment of offices (Chapter 26 about green IT) |
|
Outbound material management or SCM: own vehicle fleet management or logistics provider |
Selection of transportation means, route planning, recycling, and reverse logistics (following sections on evaluation of transportation means and networks) |
Means of transportation (truck, ships, railway—see the following section) |
The upcoming sections will enhance the discussion of energy and logistics by covering the following fields:
- In contrast to this broad overview, the everyday use of the word logistics means to bring goods from A to B; the logistics branch is just transportation. The next section about “Evaluating Means of Material Transportation” will concentrate on this.
- Afterwards “Green Transportation Technology” will be discussed.
- To increase energy efficiency, “Logistics Planning in Networks” (as the following section details) provides an overview of options and chances.
- The intuitive and traditional way to tackle energy and logistics aims to integrate energy aspects into logistics planning and SCM; it can be called energy for logistics. The energy turnaround proposes to turn around this term as well: logistics of energy evolves as its separate field because of the rising complexity of energy procurement, demand-side management, energy storage, and so forth (see the last section of this chapter).
The transportation of persons is excluded here. It would be crucial for transportation companies, private or public, and the tourism branch, but for industrial companies, the problems of material logistics prevail. The logistics of persons is touched only by business travels and commuting. Nevertheless, we’ll examine some opportunities for energy efficiency, such as through video conferencing, extending the allowance for home offices, carpooling or car sharing, and developing companies as an element of smart cities, for example, by fostering public transport.
Evaluating Means of Material Transportation
Optimization software for logistics supports tour planning and the choice of transport options. Such software packages could be part of the encompassing enterprise resource planning systems; they may stand alone or appear in the form of specialized programs for logistics providers. In any case, the dispatcher (customer of logistics provider) has to define some planning points:
- Technical requirements (it does not make sense to send a bulky load like coal in an airplane) have to be defined;
- The urgency and arrival time have to be fixed; and
- Ecological aspects could be objectives for the transport, exceeding the cost view.
Generally, energy and cost objectives are in harmony because energy is a cost factor with increasing importance; short transport distances are the most important subobjective. As this is widely covered in established logistics, we are facing here a conflict of objectives arising with global warming: Low carbon emissions appear as a new ecological aim to follow, possibly conflicting with the aims of cost reduction, energy conservation, and short duration of transport as other important element of the system of logistics objectives. In order to demonstrate the evaluations necessary, the Internet-based freeware EcotransIT (www.ecotransit.org) is introduced. It allows mapping, in an experimental way, different transportation alternatives with their ecological impact. Just give it a try, registration is not needed. The system was established and is maintained by public authorities, research institutions, and large logistics firms. A considerable number of languages are at hand.
To give an example of the functionalities, a load of 100 tons should be transported from New York to Los Angeles. Figure 23.1 compares the primary energy consumption in kilowatt-hours and the carbon emissions in tons (please mind the different scales).

Figure 23.1 Evaluation of sample means of transport
Source: EcoTransIT.org
The bars in the diagram have two shades: The lower part represents the gray energy or carbon (cumulated energy expenses, well-to-tank), the upper part shows the consumption of the transport itself (tank-to-wheel). Looking at the bar for carbon of the train, no upper part can be found because applying electricity goes without direct emissions of carbon or any other substance.
Some inquiries will show that there is a clear sequence evaluating means of transportation according to their carbon emissions: Trains (with preference for electro instead of diesel) and ships (if applicable) are better than trucks. In addition, airplanes are worst with a large gap, even if calculated one-to-one. Hence, carbon contributes more to climate change if the emissions are effected at great height. Scientists, airlines, and environmentalists dispute the factor that has to be applied to emissions, but the range covers 1.0 to 2.7.
Green Transportation Technology
To advance green transportation technology, either the supply with energy carriers or the drive itself can be changed. Here are some important examples and trends according to different sorts of traffic.
Road traffic can rely on gasoline, diesel, electricity, hybrid (combining combustion and electric drive), or hydrogen. The criteria and methodology to assess the different options become quickly apparent reading this page of the book: notably, energy performance indicators for energy efficiency, integration of gray energy, and carbon factors and their discussion. Therefore, the tools to drill deeper into internal inquiries are available, and first observations will be outlined here. The transport of persons may be revolutionized by one-liter cars (per 100 km) or electro-mobility (15 kWh equaling 1.5 L fuel per 100 km or 157 mpg). Hybrid technology supports efficiency of conventional car drives, but it is noteworthy that a wide range is covered. “Mild hybrid cars” have as a main technical feature a start-and-stop automation; plug-in hybrids (can be connected to the electric grid with a plug) mark the threshold of e-mobility.
Transportation and a whole economy based on hydrogen will probably not lead to sustainability, because hydrogen is an energy carrier and no primary energy source. To rely on it in a greater scale means to accept energy losses during the generation process and massive investments into infrastructure. It seems to be more practicable to follow all the other available options of green energy generation and efficiency. Hydrogen will claim its niches, for example, in power-to-gas: If wind power stations generate electricity that is not needed in this phase of the day, hydrogen can be generated feeding it into the grid for natural gas.
Material transports by trucks confront us with a weak side of an energy turnaround. The efficiency cannot be augmented to the same degree as in cars: Batteries are so heavy that they reduce the useful load, and biofuels conflict with food supply. If possible, it is advisable to choose trains or ships for transportation or, furthermore, to avoid transportation at all, for example through regional sourcing.
Bioethanol in Brazil
Brazil and the United States are the leading bioethanol producers and exporters in the world, with Brazil relying on sugarcane and the United States on corn. The impact on the economy as a whole in Brazil is much higher, notably most of the cars are endowed with flex motors. That means, they can use any blend of conventional fuel and bioethanol (a sort of alcohol). Any fuel sold has to contain at least 25 percent of bioethanol (E25) going up to a 100 percent (E100). This model brings about the danger of monocultures in agriculture and deforestation of rainforests.
Railway trains can be driven by diesel or electricity. Electricity is the better option, with the disadvantage of initial investments into electrification of the lines. The energy efficiency is much higher compared to cars, and the carbon emission can be cut to near zero using green sources (see Figure 23.1).
Shipping traffic makes use of economies of scale looking at efficiency. In many countries, a truck can carry one or two standard containers
(20-foot equivalent unit, TEU) with a maximum weight of approximately 25 tons. A train may transport dozens of containers depending on the technical and legal conditions of a country. Since 2006, container ships of the seventh generation have a useful load of more than 14,000 containers. In analogy to the degression of fixed costs: A single container has to cover only a little part of the energy consumed. A specific ecological problem is caused by sea ships because they burn fat oil (heavy fuel). This is a relatively cheap residue of the refining process of crude oil, emitting many hazardous substances. To reduce fuel consumption, sailing could experience a renaissance even for large ships.
Air traffic is surging and presents an increasing problem of global warming. The efficiency of new airplanes becomes better, but the old ones are in service for decades already. As a rule of thumb, covering a kilometer in the air depends on as much kerosene as a modern car requires for the same distance. Most airlines publish the numbers for their jets hidden somewhere on their pages. In comparison to car travelling, airplanes go longer distances, but the effect of carbon emission in great height is higher and car-pooling is not possible (the calculation for planes assume already good capacity utilization).
In a thesis, a student calculated the land use if Lufthansa would rely on biofuel from the Jatropha plant, which can grow with little water demand on poor soil. The result was that more than half of the current German agricultural surface would have to be dedicated to this energy plant to cover the demand for this single airline. Consequently, energy plants cannot be a main solution to sustainability. In countries that do not have problems in nourishing the population and have enough space and water, bioenergy can find its role: a niche from an overall perspective.
Sustainability and Airplanes
To attain sustainability, we will have to find ways of doing global business with considerably less air traffic—the current trend is the opposite. On the international level, an adequate price for carbon emissions (taxing kerosene) should be a key instrument; companies should develop regional networks. Without an overall profound change of consciousness, international politics, business, and consumers will not move as necessary. Wouldn’t it be a greater quality of life if people did not go for a two-week trip from New York to Paris (and the other way round), but take a sabbatical leave of three months (e.g., by sailboat) and really experience the other continent? This is just a glimpse of a sustainable way of life, but mighty habits and lobbies are opposing.
Logistic Planning in Networks
New networks represent a major trend in energy; logistics linking companies presents an intrinsic field of networking since its beginnings. Here, we elaborate some examples of how networking takes place and how they overlap. These are selected tools, methods, and trends.
Demand-side management (load management) can rely on facilities operated by logistics; for example, cooling warehouses, or batteries in vehicles like cars, forklifts, or small trucks. Multiple cooperating procedures have to be established in-house (energy purchasing and demand –planning) and externally (utilities).
Fourth-party logistics providers (4PLs) as a buzz word mark a trend of increasing importance. The first-party logistics provider means that a company conducts its transports by its own fleet. A second-party logistics provider is a forwarding company commissioned to bring goods from one place to another. A third-party logistics provider is a prime contractor responsible for a great part or the whole outbound transportation demands; he can subcontract. A 4PL allows for his client to concentrate fully on the core business by executing nearly every logistics operation, even internally. It means that a 4PL takes care of warehouses, commissioning, packaging, goods received, and dispatching of products. Even critical administrational procedures like order-taking or accounts receivable accounting can be included. From the side of energy this means that a 4PL takes over the responsibility from his customer. The 4PL has better conditions for tour planning and capacity utilization since his core know-how is efficiency. Taking over internal logistics, the interactions with client’s departments have to be designed carefully; for example, involving the 4PL into own load management or letting him establish contracts with utilities.
Electronic commerce means in some way that electronic data interchange (EDI), e-mails, or other interconnected IT-tools are involved in procuring or selling. This broad definition touches most administrative and physical transactions in logistics, helping them to be more energy efficient. Electronic commerce helps optimizing tour planning, attaining better capacity utilization, reducing the need to store goods by better timing, avoiding returns, organizing handling aids and transport equipment, and much more. Corresponding methods are just-in-time (JiT) or just-in-sequence (JiS), lot one, tracking and tracing, electronic logistics, or desktop purchasing (DTP—which is on the rise; every company should check whether this tool should be deployed). Freight exchanges via the Internet and other market places support the equilibrium of demand and supply smoothly and effectively, in the logistics services market, and beyond. Thus, the overall efficiency of a market system is strengthened including resources as energy. Reverse logistics plays a bearing role in closed-loop networks (Souza 2012; Sroufe and Melnyk 2013).
Globalization and localization (glocalization) are reflected in conflicting strategies of global and local sourcing. In fact, it will not be possible to find one answer on which strategy should be preferred or how they could be combined. A close look at every single purchasing good in the respective industries is necessary. Glocalization means to do corporate shopping in the global village, being aware and developing the local roots and value networks.
A little-known critical issue is the taxation of global players in comparison to small and medium enterprises (SMEs). Many international companies make use of tax havens, reducing their taxes to near zero, whereas SMEs (which are in most countries the backbone of the economy) doing local business cannot avoid the royalties. A massive, dysfunctional distortion of competitive conditions causes environmental damage by excessive international transport.
Energy for Logistics and Logistics of Energy
In this chapter, we have discussed up to now energy for (or in) logistics. The emphasis of logistics of energy has always been relevant for utility companies, which have to manage energy grids, storage facilities for energy carriers, and so on. As a recent development, logistics of energy is growing as a distinct field of activity for nonutility companies. New, complex, cross-functional and cross-company tasks are presenting themselves, especially with respect to electricity:
- Procurement needs a much more detailed approach to demand planning to allow for portfolio management.
- Load management can be interpreted as a task of logistics, allowing companies to act as parts of smart grids.
- The conversion of energy in different forms (electricity to cold and compressed air, etc.) has to be planned and managed.
- The sell-side is involved as well through microgeneration in an industrial company. The traditional make-or-buy decision has to be enhanced to energy.
Who takes on the responsibility? The logistics department sometimes just handles the transports in a company driving the forklifts; this is far from the comprehensive understanding previously outlined. It is the art of management to put into place every procedure needed. A whole bundle of departments is involved, notably the materials-requirement-planning department, procurement, transport and warehouses, production planning, and operations. The preceding outlined tasks have operative and strategic dimensions. Thus, strategic planning and investment appraisal enter the game with the aim of strengthening renewables in the long run.
Facility Management (Design—ISO 4.5.6 and Procurement—ISO 4.5.7)
Overview
Facility (or facilities) management (FM) is a difficult term in transition. On the one side, it could be the caretaker surveying heating and air conditioning. On the other side, the International Facility Management Association (IFMA 2014) presents a demanding definition: “FM is a profession that encompasses multiple disciplines to ensure functionality of the built environment by integrating people, place, process, and technology.” In 2009, a global job task analysis (GJTA) defined 11 core competencies. The GJTA included responses from facility managers in 62 countries. It is the most comprehensive up to date and the first truly global survey and analysis. The core competencies are:
- Communication
- Emergency preparedness and business continuity
- Environmental stewardship and sustainability
- Finance and business
- Human factors
- Leadership and strategy
- Operations and maintenance
- Project management
- Quality
- Real estate and property management
- Technology
Energy is one of the important areas in which FM is taking steps to establish itself as a profession, discipline, or business domain. According to this and other definitions a national reach, the whole building cycle containing buildings for planning, use, maintenance, retrofit, and deconstruction is the task of FM. Every supply with media (water, compressed air, etc.) is included in this building process and in the operations of daily corporate life.
How to link FM with structural organization in a concrete company? Few firms have established an FM department covering the whole field. Thus, the contents presented here have to be assigned to the departments that are responsible in a company; for example, the technical department, the operating units like production or logistics themselves, and importantly, the caretaker who has increasing influence on energy. Frequently, tasks (which do not count as core operations of a company) are outsourced to external service companies.
What are the challenges of FM with respect to energy? The following sections will deal with this question:
- The first, relatively easy task consists of building technology for office buildings and living houses. The energy demand can be cut down to less than zero. Inventions are available but did not make their breakthrough as innovations.
- The options for industrial production buildings to cut energy consumption and expenses are considerable as well, but not as striking as for offices.
- Supply of resources like gas, compressed air, water, and so forth for operations.
- Good housekeeping.
Lighting offers some additional perspectives for energy in every sector and industry. Investments in technology can only harvest the intended results if organizational procedures are established. The importance of green building to reduce energy consumption worldwide can be considered looking at the overall part of energy use for buildings in an economy. According to the total energy use of an economy, the energy use for buildings covers typically 25 percent. This part of total consumption could be spared without restrictions to convenience.
Offices and Residential Buildings
Heating and cooling represent by far the greatest part of energy consumption in offices and residential buildings. In northern countries, the emphasis is on heating; in southern climatic regions, cooling prevails. Insulation has to be considered as a basic measure everywhere. To introduce the most important technological and economic option for energy conservation in this field, we will start with passive houses or plus-energy houses (see Figure 24.1).
The term passive building implies that no active heating like a gas or oil burner is needed. The walls and windows with double or triple glazing of a passive house are very well insulated. The effectiveness of such a measure is illustrated by the fact that the houses are heated by the body warmth of the inhabitants and their activities, like cooking or using electronic devices. If a room should be a bit warmer, the inhabitants are advised to light a candle or to toast a slice of bread to reach a comfortable temperature.
Nevertheless, every inhabited building needs the change of air to avoid mold and accumulation of carbon monoxide in the air. A ventilation system pushes fresh air into the rooms while using the warm air stream out to warm it up making use of a heat exchanger. In this way, it uses the thermal energy generated inside. As a result, near to no energy is wasted. An additional feature is to preheat the cold air from outside with the help of a ground heat exchanger. Digging one or two meters into the ground, a constant temperature of about 8°C (46.4°F) prevails. So, even in the deepest Canadian winter, the inbound air is preheated when it meets the warm air coming from inside the house. Plus-energy houses are endowed with solar cells; their contribution lifts the energy bottom line of a building into positive. Consequently, buildings could play a role as positive contributors in energy grids.

Figure 24.1 Passive house
Source:Passive House Institute, www.phius.org
The most important energy performance indicator for FM is the energy demand in kilowatt-hours per floor area. It is astonishing and encouraging to observe a sharp decline in the past few decades: Traditional houses in industrialized countries in moderate climate zones consume 300 to 400 kWh/m2. That explains the great importance for overall energy use in economies and highlights the thrilling option to cut it down to zero or less. The primary energy use for the heating of a passive house has to be less than 15 kWh/m2.
Price of a Passive House
A neighbor who rented an apartment moved into his own passive house last year. He confirmed the numbers from literature. The investment exceeds that of a house with a conventional heating system by 10 to 15 percent. He told me, “We did it for our kids. They will never get annoyed by rising energy prices and this decision is future-proof.”
Passive house or plus-energy-house technology is hard to apply to existing buildings. But there are some additional technologies applicable there:
- Heat pump systems (already explained in Chapter 6, “Green Energy Technology and New Markets”).
- Solar thermal collectors for warm water or even the support of a conventional heating.
- Block heat and power plants are highly efficient because they produce power (electricity) and heat at the same time. Utilities seem to offer this technology increasingly, as contractors, to embed the facility into virtual power plants and smart grids. First, only large companies or quarters of a city were effective targets for this technology. Eventually, the application scope has widened to smaller companies, apartment buildings, and even smaller houses.
- If conventional heating cannot be avoided, the energy carrier defines the carbon emissions (see table in Chapter 2). Coal is worst, followed by oil and then gas. The best use is achieved through biomass like wood or wood pellets (with the objections of fine dust emissions and possible deforestation).
For buildings in hot countries, a building style with thick, well-insulated walls and jalousies from the outside of the windows are important. The ventilation of passive houses and the large thermal units (floor heating, for example) of heat pump systems can be used for cooling purposes as well. Conventional air conditioning with high-energy demand would be replaced with the negligible energy consumption of a small pump operating the system.
Several certification systems for sustainable buildings are developing with energy as one important criterion. For example:
- BREEAM in Great Britain since 1990
- LEED in the United States since 1998
- CASBEE in Japan since 2001
- Green Star in Australia since 2003
- DGNB in Germany since 2007
Factory Buildings
Production buildings and dispatch facilities confront us with additional challenges in comparison to offices or residential housing. Even without looking at the supply of resources like gas, compressed air, or water (see next section), the facilities are much larger, higher, and sometimes a lot of traffic keeps the gates open. What can be done? A glimpse on technological options: Infrared heating systems should replace the warm air heating proliferated since decades. The radiation heating system on a factory work floor is much more efficient in comparison to a warm air heating. The infrared radiation warms people and machinery, not the air. Additionally, the warm air is not rising to the ceiling (see Figure 24.2).

Figure 24.2 Warm air heating system in comparison to infrared heating
A warm air heating system warms the air, and this is a detour with a lot of energy loss, because people and assets are warmed indirectly. That sounds a bit abstract, but it may be made descriptive through the example of a cool but sunny day in spring. People are walking around in T-shirts at 15°C air temperature because the infrared radiation of the sun warms their bodies immediately—it is just the same on the work floor with radiation heating.
Company Example: Kuebler Incorporated
Some years ago, a student wrote his thesis advised on the company side by Thomas Kbler who founded the group in 1989 (see kuebler-gmbh.com). The company’s products are infrared radiation heating systems. Over 100 employees and 20 locations support the success. In comparison to traditional heating:
- 30 to 70 percent cost and CO2 reduction can be reached;
- The payback period spans between two and seven years in retrofit projects; and
- The energy efficiency of burning natural gas is more than 110 percent through waste heat recovery and by supporting solar thermal panels—I was present when Thomas Kbler presented this solution at a congress. Technical experts questioned him and accepted the explanations.
The company is winning more and more sustainability awards, supporting the importance of this technology.
Receipt and dispatch facilities in logistics present special challenges because the gates have to open many times, allowing trucks to dock and forklifts or conveyors to pass. Some tricks help to reduce energy consumption:
- Inflatable sealings for loading hatches;
- Simple fans to avoid layers of warm air under the ceiling and the workers’ feet from getting cold;
- Temperature regulation by employees at this workplace who are trained and feel responsible;
- Eventually involving energy conservation into a bonus system as incentive, be it heating or cooling;
- Switch control of system in a way that it operates only when gates are closed;
- Making use of free cooling (which means to open the windows instead of switching on air conditioning, if possible);
- Making use of waste heat from other machinery if feasible, or possibly from another company as small district heating;
- Latent heat accumulator;
- Infrared radiation heating is applicable; and
- Block heat and power plants and other forms of microgeneration, for example, solar cells on large, flat rooftops.
Business Persons and Technology
Having a degree in business, my professional background was evolved through work in interdisciplinary teams implementing environmental management systems. I had to be familiar with terms, methods, and ways of thinking of engineers, otherwise it would not be possible to convince them to make use of my know-how in organization and accounting willingly. Most technicians are very helpful and instructive if they feel a genuine interest in their conversation partner. Thus, as a business person involved in energy projects, just have your keywords (partly provided by this book) at hand and just ask about the application in a given situation. An abundant source of information are vendors of technical equipment; they often present their offers with supplementary investment appraisals.

Figure 24.3 Exemplary production facility at an industrial company
Source: Siemens AG
Furthermore, factory buildings have to be supplied with different sort of media. As an introductory feature, in my classes about energy and FM, I show my students some pictures of production sites (Figure 24.3). Then we brainstorm which sort of media supply, disposal needs, and different sort of networks can be involved to allow for the smooth operation of such workshops.
The result regularly puzzles the students:
- Energy in many different forms (electricity, heat, steam, compressed air, gas, cooling, etc.)
- Lighting
- Cold and hot water supply
- Water drain: drinking water, water for clarification plant, and rain water
- IT networks bound to cable and wireless
- Central lubrication and greasing
- Disposal of garbage with different fractions
The multitude and the combination present a challenge for cost-place accounting.
Procedures of Good Housekeeping
To establish, operate, and improve facilities, three levels serve as a structure:
- The focus of the preceding chapters covers the first level, technical innovations requiring investments. They can only achieve benefits if they are operated well on the following levels.
- The second level is good housekeeping depending on organizational procedures involving different workplaces, departments, or even going beyond borders of companies. Maintenance, the often overseen hydraulic adjustment, would be assigned to this level.
- The third level consists of good housekeeping at an individual workplace. A motivated person can influence energy use directly and independently (see Chapter 16). Examples include an employee closing the doors of a dispatch facility, using compressed air sparingly, turning down the temperature in his own office, or switching off his PC after work. The energy manager has to look into every workplace, discuss the possibilities, and motivate staff to do so in daily life. As motivation, tags on the machines could inform operators how much energy, carbon, and money may be spared by switching it off or running below full power.
The second level is quite demanding, and has to be covered here. It is helpful to start from an energy service that has to be rendered: an appropriate temperature in the production site. Who is involved to keep it up?
Company Example: Mitsubishi Semiconductor Europe
An example of the importance of cross-sectional cooperation taken from project management in building activities, production, FM, and maintenance: Mitsubishi Semiconductor Europe had just put into operation a newly built plant with a clean room to produce computer chips. Everything was all right, every standard met. Then a smart maintenance manager found out that the construction company had preadjusted the air conditioning so that the heating was operating at all times and even in summer. Moreover, when the company’s machinery was working, the cooling device fought against the heat generated by the operation. A few minutes of work to reprogram the device resulted in a 50,000 euros of cost savings per year.
To demonstrate the problem, I’ll share a short visit I had at the warehouse of a large company. It was a cold day in winter with temperatures of -10°C or 14°F. The stored technical textiles and other goods were not sensitive to cold or heat, but a water sprinkler installation had to be kept over the freezing point, otherwise tubes would crack, the sprinkler system would be destroyed, and the stored goods destroyed—a heavy loss. When we entered the warehouse in our thick winter clothes, we immediately started to sweat because the temperature was about 18°C or 64°F. According to the logistics manager, 5°C or 41°F would have been desirable. Monitoring the temperature closely, the distance to freezing point provides enough time to take action in case of a defect in the heating.
Unfortunately, the logistics manager responsible for the operation of the warehouse was not the owner of the building. That was the role of the facility manager of a service company within the concern taking care of all buildings. The facility manager did not want to get into trouble and cause a horrendous loss, so he turned the heating high. He was not interested in keeping costs low because they were payments in transition for him, charged to the logistics company as his customer. Following this thread in order to find someone whose task it is to turn the temperature down, it became obvious that the FM company commissioned an external service company to take care of the heating. Furthermore, not one heating system was installed but two systems with different controlling procedures were operating more or less independently.
What are the lessons learned from this typical and complex example, summing up our know-how?
- Contracts between companies in a company group have to be concluded in a way to assign costs and revenues follow the principle of causation. The IT systems should be integrated, at least by defining data handover.
- Organizational interfaces have to be defined across departments or even involved companies. According to the example of supply chain management, energy has to be interpreted as its own field of action. Companies should develop an understanding as part of value networks; looking at energy contracting reinforces the development.
- Define service levels and tasks, responsibilities, and competencies depending on the levels introduced in this section.
- Buildings and their equipment have to be interpreted as products with the cradle-to-cradle view. The planner should think ahead to facilitate operations. In another practical example, a clean room had perfect conditions when a handover from construction to occupant took place. But it was designed with so little forethought that the cooling device was at full power fighting against the heating, which had to lift the temperature to the desired level.
- Maintenance is often in the hands of the construction company or another external provider. Such service providers should understand themselves not only as the ones who are readjusting the equipment, but as an integral part of the value network.
- The whole organizational-technical system must be able to learn and adjust itself. The starting points are the needs of the users of whatever energy service has to be delivered: A new product with lower vulnerability to heat in the food industry? Then a higher temperature is possible. Plant closure? Turn off the pressure of compressed air.
Production Planning and Production (Design—ISO 4.5.6 and Procurement—ISO 4.5.7)
Overview
Production and its planning system are a challenge for this book: On the one hand, many industries mentioned in this book contain the fields of the greatest energy use (chemical, food, metal, etc.). On the other hand, the technology is so diverse that an introductory publication is at a loss to cover this field. Challenges of energy demand planning are of relevance for many industries, so they will be outlined in the next section. The reference industry is mechanical engineering, because it offers some complex energy-related problems transferrable to other industries, and demanding links to accountancy. Based on these background assumptions, some general energy-related challenges of production planning will be discussed in another section.
Energy Demand Planning
The pivot between production and procurement is the requirements planning department (materials disposition department), establishing the amount and time of demand of an input material. Materials requirements planning (MRP) is part of overall enterprise resource planning (ERP). The main methods managers use to meet procurement requirements have to be adapted for new energy (especially electricity) challenges:
- Program-dependent requirements planning (emanates from the production program, number of products intended to be built)
- Consumption-related (statistical or stochastic) requirements planning (forecasting the future demand looking at the consumption of the past)
- Decentralized material management (does not need preliminary planning)
Program-dependent requirements planning starts from the production program and makes use of bills of materials (BOM) explosion, Gozinto-graph method, critical path analysis, and comparable methods to calculate the need of an input material at a given time at a given facility in the flow of production. The basic idea is easy: One car needs four wheels. To adapt this method to energy, the first step is to determine the demand of energy for one unit of product. The multiplication of the intended production number of products for the planning period with the energy demand per unit helps to budget the energy.
In a one-product model, a simple division calculation is enough to identify the range. But reality is seldom as simple as the models: Most plants produce a variety of products with differing operations and energy demand. To get a more reliable forecast, it is necessary to go into the workshops and operations as discussed in “energy reviews” (Chapter 13) according to the model of cost-place accounting. Furthermore, a whole bundle of other variables have to be included, like the weather, assigned machinery, make-or-buy parts, make-or-buy-or-sell own microgenerated energy, varying scrap rate, variability between different sorts of energy carriers, and so on.
The stochastic or statistical method of demand planning (consumption-driven) is much easier. The demand per time unit in the past is forecasted into the future by simple mathematical averages, trend analysis, or complex modeling. This requires a more or less constant production program. The most important influence variables are of rhythmic nature like seasons. For gas or oil this may be sufficient, but for electricity a more detailed analysis will be of increasing profitability (see portfolio and load management). This method could be evolved by looking at separate points of times in the week (or other periods) answering questions like the following:
- What is the effect on electricity demand if machines are started on Monday mornings between 7 and 8 a.m.?
- What was the peak on sunny summer days between 1 and 2 p.m. during the last years?
- What is the effect on selected times of the day on one- or two-shift systems?
The decentralized control of material flow consists of methods like Kanban, just-in-time, or vendor-managed inventories. That is the way to provide electricity today: When needed, energy flows out of the plug socket. This is most simple, reliable, and without planning effort, but foregoes the potential outlined.
Production Planning
In a lot-oriented production environment, the requirement planning department (disposition) informs purchasing about material and energy demand, procurement provides everything needed for production, which is planned by production scheduling. Production planning helps to improve energy efficiency a lot by measures as demonstrated in the following:
- Production planning plays the key role to put demand-side (load) management into effect. Not only is the total amount of energy predicted of importance, but also the distribution over time is important. All the options of demand-side management (explained in Chapter 6) have to be planned here and executed mostly by production.
- Assign jobs to workshops and machines with the least energy consumption possible (For instance, if a suitcase has to be transported, a car is sufficient and a truck is not needed).
- Avoid energy-intense start-up and shutdown and set-up processes. Heating up an oven for just one part would assign all the energy used to this part; from this point of view, it is better to wait until a series may be processed. (This may be a contradiction to overall efficiency and lot one.)
- The “theory of operational adoption” helps to model the effect of different modes of operation and combination of machines depending on intensity. This is the meaning of working units per time. A simple example is a car: The faster it goes, the more energy per distance is consumed. The modeling of production processes in Chapter 13 goes beyond that, involving more specific technical variables.
- Manage peak loads (peak shaving) to navigate according to contracts with energy suppliers. Exceeding the peak limit once a year could lead to higher prices for the whole period.
- Production planning has to integrate measures exceeding usual operations. This includes extended projects of maintenance, repairs of large machines, tests of newly installed equipment, external supervision sometimes requiring a maximum load for test reasons, and so on.
Green IT (Design—ISO 4.5.6 and Procurement—ISO 4.5.7)
Green IT aims to optimize all ecological aspects of IT throughout the whole life cycle:
- Production of hardware;
- Use and application of hardware and software; and
- The recycling or disposal of hardware.
In many publications, green IT only covers computers, servers, computing centers, and their operation. In the context of this book, it also covers another subject: energy efficiency. This chapter is dedicated to this subject. However, another aspect of green IT is of greater importance: the role as enabler. This theme runs through the book, particularly with regard to smart metering, energy-oriented accounting, or business intelligence. To cover the optimization of the energy demand of hardware, we follow the structure of production, use, and recycling.
Productionof hardware appears as a procurement decision in all companies not producing computers. For instance, a microchip of 2 g needs 32 L of water, 72 g of chemical substances, and 1,600 g of fossil energy. Half of the life-cycle energy of a personal computer comes from production; only a good quarter is caused by the use (given four years lifetime and two hours daily operation). Consequently, increasing the useful life of hardware makes it possible to amortize the energy used for production over more years. Selecting hardware with certifications such as Energy Star can be helpful, but it’s also worth considering outsourcing IT services via cloud computing.
Theuseof servers in companies seems to be inefficient in many cases because the degree of capacity utilization is quite low, in some cases only 10 to 30 percent.
Potentials to Cut Costs
The federal German Energy Agency (Dena) summarizes Germany’s experience with data centers:
- Reduction of useless data and software programs with a potential of 5 percent conservation of total energy cost.
- Optimization of air conditioning, 20 percent.
- Purchase of energy efficient hardware, 25 percent.
- Improvement of server utilization, 35 percent.
The overall effect of these measures combined could reduce the cost of energy usage 25 percent.
The data cloud brings about a solution; companies and users no longer need to work with data and software applications physically on the personal computer or in-house server. The data is transferred via Internet in large data centers operated by providers. They are the specialists for capacity use and operation of data centers with all the economies of scale. Consequently, cloud computing and “software as a service” (SaS) helps to improve energy efficiency and assign the responsibility to the providers who could for example feed the waste heat of their servers into a small district heating system. Nevertheless, lean applications by deleting all unnecessary software are still the task of every user. Cloud computing brings an incentive because nonutilized capacities do not have to be paid. Furthermore, the local devices should be operated with care, switching off what is currently not needed.
Company Example: University of Ludwigshafen
The facility manager of our university had a nice surprise: The electricity costs of one building went down by 10 percent—because of rising prices, a surge was pending. This was because the computer center had decided to shut down three computer pools instead of leaving them on stand-by overnight.
During thedisposal or recyclingstage of the life cycle, disused computer devices have to be looked upon as a recyclable resource containing precious metal including gold. Most precious materials are rare earths or metals. China possesses a lot of the world’s reserves of these limited substances indispensable for high-tech electronic equipment and some renewable power technology. Unfortunately, rare metals are not being recycled because of the technological and economic barriers associated with such small quantities per unit.
Industrialized countries are working on regulations to mandate recycling or to institute aggressive environmental and safety standards. One tactic is to encourage vendors to take back the scrapped hardware. The legislation and its enforcement are still at their beginnings; many devices are going through dark channels into developing countries. There they are recycled with simple tools and on open fireplaces, providing a living for families but threatening their health.
Control and Audits (Checking—ISO 4.6)
For those who have been following the quality, environment, and energy management discussion for decades, this chapter focuses on the original intention of quality: to check, measure, and test products and procedures. In the energy field, the great options of smart metering and modeling of operations brings increased capacity to collect and analyze information. Let us separate into two classes of how often operational data is measured and processed: the old world, offline more than a quarter of an hour (e.g., contents of an oil tank is measured every three month) and the developing possibilities online, less than 15 min (smart meter for electricity). That means, nonconformities can be detected immediately to trigger “... Correction, Corrective Action and Preventive Action” (Section 4.6.4 of ISO 50001). To give an idea of what this means for different business domains and which applications become possible, the following will present some examples where it is useful to process a constant stream of data:
- Accounting can turn keyed, artificial overhead costs into measured costs—achieving more accurate planning.
- Consequently, all relevant cost centers get motivated to use energy sparingly, because they benefit from the reductions.
- If costs are not assigned to assets correctly (e.g., energy costs to electric drives), the calculation of life-cycle cost (LCC) and total cost of ownership (TCO) are not correct and opportunities to cut costs are missed.
- When deviations from baselines occur, modeled processes will be detected, and the cause can be removed. For example, maintenance could replace a clogged filter, a leaking gasket, or a broken ventilator.
- The opportunities of demand-side management and peak shaving open up involving many departments, namely purchasing with quick cost reductions.
- Logistics need and use online monitoring of transportation and energy data to work on a modern standard. Some keywords are just-in-time, tracking and tracing, radio-frequency identification device (RFID), and global positioning system (GPS).
- Predictive maintenance—sensors on machines report vibration, temperature, and respective resource consumption to serve as early indicators for malfunctions.
- If there are legal obligations, deviations are closely monitored and detected immediately. This point has more relevance for environmental protection not transgressing critical thresholds for emissions.
Business administration has to reflect the physical procedures in the accounting system. As the possibilities for technical monitoring and control are growing, the accounting side should take steps to integrate them. That means to show the effect of technical processes in costs, cost savings, and revenues and advice in the whole range.
In Chapter 4.6 “Checking,” ISO 50001 establishes the need for internal audits of the energy management systems. The daily operation and procedures are not checked, but the system as a whole. This audit has to be conducted by persons in an impartial and objective position; they may be members of the organization or hired from outside. Consequently, it is critical that the energy manager plays a leading role; the intended four-eyes principle would be damaged. To keep it lean, the standard advises to endow someone inside the company with technical competencies but no personal responsibility for the subjects audited.
Furthermore, checking includes documentation to demonstrate conformity with the elements of the standard. IT offers a considerable help to record and make traceable all the energy-related procedures carried out every day. The energy manager should adopt checklists from the Internet, literature, or the company’s certifier to be sure that no detail is forgotten. This way, the certifier and the internal auditing team can tick the list and get through the process quickly. Moreover, the organization members not directly involved can do their work with minimum inconvenience.
Internal Revision (Management Reviews—ISO 4.7)
In a way this chapter “management reviews” does not go notably beyond Section 4.2 (ISO 50001) “management responsibility.” The standard again stresses that energy is a top management issue, and top management must look into the system regularly to verify personally that the energy management systems (EnMS) operates as it should. A little checklist of minimum input to the management review is prescribed by the standard on a very general level. It seems to be self-evident that such a review looks into the report of the preceding one, as well as into the policy, baseline, energy performance indicators (EnPIs), legal requirements, objectives and targets, results of internal audits, and corrective actions. Furthermore, management must project the energy performance for the next period and establish recommendations for improvement. The output should encompass changes of the energy performance, policy, EnPIs, targets and objectives, and new allocations of resources (for the EnMS itself). The classical job of the internal revision department is to inform top management that every procedure in the company corresponds to internal and external rules. The focus is on the accounting system bringing about a considerable overlap to energy accounting as an important part of an EnMS. Consequently, the activities have to be coordinated between the departments of
- Internal revision
- Energy manager (conducting the internal audit going in the technical dimension as well)
- Compliance management (as relatively new function with the focus on the prevention of corruption and less on energy)
After all, a whole list of reviews, checks, and audits are mandatory:
- Energy reviews (Section 4.4.3, ISO 50001)
- Checking (Section 4.6, ISO 50001) with the constant monitoring of all relevant data and internal audits of EnMS
- The management reviews (Section 4.7, ISO 50001) addressed in this chapter
- External certification audits
All of this has to be recorded, made traceable, and auditable. The good news is that the standard does not specify how the details of an element have to be covered. For example, it would be satisfactory to state that top management revisited the policy, the development of EnPIs in comparison to the baseline, and so on. This could be simply a point on the agenda of a board meeting with the documents needed. The energy manager has the duty to provide an overview where the overall and integrated documentation system of the company and the requirements of ISO 50001 are met. It is the art of the management to expose these aspects to third parties and to improve company’s management without bothering with paperwork of doubtable benefit.
Implementing ISO 50001 as a Project of Change Management
Management Style of the Future Conflicting with ISO 50001
How can a company be successful in an economy heading for a postindustrial era? The knowledge society, individualization of products, and quicker innovation cycles are keywords to characterize this development. It is clear that many of the companies this book is intended for will not find themselves meeting this description. Nevertheless, the vision outlined here could help them to take their first steps; for example, trying to systematically assign employees more responsibility to organize their work wherever feasible.
It depends very much on the culture in which a firm is doing business, but the main ideas of change management and a learning organization may be summarized as follows: Persons are the main asset of a company, and shared values for how to do business are the corporate culture gluing the organization together and making it successful. Information and communication on the basis of respect lead to participation; the organization can benefit fully from the abilities and creativity of its members.
Consulting Company Example: CSC
Some year ago, I had the opportunity for an extensive discussion with Jrgen Fuchs, a member of the board of the consulting company CSC (in Germany). He pushed forward some ideas illustrating what network-organization, flexibility, and participative leadership really mean if applied comprehensively:
- On the one hand, there are no established job descriptions or limited departments; every consultant may choose which projects he is assigned or may acquire projects he likes by himself. On the other hand, there will be pressure on consultants if they are not asked to join projects.
- Superiors (the term is widely avoided, “to report to someone” is replacing it) are not assigned by top management and are not maintaining power until they retire. Their job is to deliver service to their staff. If they do a bad job, staff may complain and another solution is found.
- To talk about salaries is not welcome in every company. However, here the colleagues are invited to exchange information about their income. If someone is not satisfied, it should be discussed, in order to find the right balance of giving and taking within the framework given in the firm.
Introducing ISO 50001 should be conducted like a change management project; it touches responsibilities, procedures, and workloads in wide parts of the company. A critical point is always the increased workload for key personnel, which we have to admit happens frequently with ISO 50001. In contrast, there are costs savings and other benefits the organization and its members can benefit from.
Let us imagine the effect of an ISO management certification within a company trying to proceed as described in the previous chapter: parts of the company’s flexibility will be lost. The whole management style seems to be different, the emerging leadership style thrives on fun in experimentation, confidence in one’s own abilities and those of others, and a culture in which failed efforts meet generosity and grace. In contrast, getting a certification requires that a lot of documentation be established and kept current.
Pathways to Solve the Conflict
So what can be done in order to use certified management systems as a tool and not to see them as obstacles and hindrances?
Understand ISO 50001 as a Project of Change Management
Implementing ISO 50001 should be understood as a project of change management in the outlined way involving people. When setting up checklists, agendas for meeting, and so forth, the underlying intention to change corporate culture should never be forgotten.
Choose a Certifier Fitting to Your Company’s Management Style
Some certification companies conduct their audits more like a legal check going into every clause of the standard. It would be better to get an insight into whether it is a real living system supported by ideas and engagement. If you really mean ISO 50001 to be a step toward the outlined management style, look for a certifier with the same style of thinking (or at least an acceptance for the approach of your company).
Balance of Conceptual Top-down Approach and Bottom-up Participation
A good project management in the introduction of an energy management systems (EnMS) finds a mixture of Western and Eastern management style: Western managers charge ahead in mapping the solution, overcoming obstacles, and reaching or overachieving the objectives. The disadvantage of this type of top-down management (especially for change management project) is that opposition is not addressed, and under the surface there may be issues hindering progress of the organization. Eastern style management evolves the concept by discussion involving the group. That seems to be slow, but if everybody touched by a problem contributes with his insights and ideas, the jointly developed concept can be installed quickly and successfully without friction.
Going into such a project, ideas have to be generated for how to get a pool of ideas for preparing an action plan. Literature analysis, advice of agencies, associations, and consulting can be used externally. Furthermore, creative techniques and a system for generating competing ideas are internal methods created to involve people, win their support, and make use of their creativity.
Looking for Win-WinSituations
The ideal goal is to find a win-winsituation for everyone. It is normal that an organization member will ask himself what will be the effect on his own work and position in the event of change. Fortunately, energy projects will bring about cost-cutting effects. In many cases, additional work can be compensated, finding measures that do not increase the workload of the position.
EnMS as a Lean Management Project—Hidden Agenda of Top Management?
Projects of this kind (quality management, Six Sigma, lean management, etc.) are often intended and perceived to have the hidden agenda of squeezing the full potential from employees. It depends on the culture of a company as to how an EnMS introduction process may be interpreted from this perspective. In the long run, more and more companies rely on a skilled and dedicated work- and brain-force. Consequently, hidden agendas should be laid open so that untold intentions of top management become official or vanished.
Quick Wins
Quick wins help to convince the internal stakeholders of a change-management process of the advantages of innovations. Many of the measures do have an immediate effect and cost near to no money, for example, better control of air conditioning, change of electricity provider, or reduction of pressure of compressed air. If a company has energy costs of 3 percent and it is possible to cut a third of it with payback between zero and three years, this 1 percent overall cost reduction is an important contribution to profits. A company struggling for a green zero would get 1 percent return on investment for the total capital invested.
“Helicoptering” of the Energy Management Team
To achieve all this, helicoptering of the project managers of an ISO 50001 introductory team has to be planned at critical milestones. This means that the team looks not only at the factual level, but also maps and interprets interpersonal issues. The winners and losers (or those who may feel this way) have to be identified, and their concerns must be taken seriously. This sort of project management supports a smooth and harmonious proceeding. Moreover, changes are understood, accepted, and supported by all those who have to put them into practice in daily corporate life.
Avoid New Entailed Estates or Fiefdoms
The energy manager and the team around him are not only in the helicopter, but also part, party, and stakeholder of the process. Especially, the energy manager defines his importance, professional success, and lastly his salary on the impact the EnMS has for the company. The visibility is increased through his own personnel documentation, dedicated meeting routines, and so on. Top management as the reviewing authority needs to have an eye on integration, integrating this aspect of business harmoniously and efficiently into the existing structures and procedures.
Tips, Tricks, and Traps in Working with ISO 50001
Especially for SMEs it may be hard to get into the field trying to develop a long-lasting vision for an organization, and at the same time having an eye on the judicial details of certification. A first step is to read an application-oriented book (like this one) getting the main structures. To prepare a concrete project for a company or an exam at college, it is wise to view the original source. This may be somewhat confusing, because there are a variety of interlinking standards for different audiences, and an internal structure may not be obvious at first sight. To find one’s path in this jungle, the following suggestions will be helpful:
- Look at the selection of standards about quality, environment, energy, and greenhouse gases at the end of this book.
- Go one layer deeper by visiting the ISO.org homepage; view the table of contents cost-free.
- To hit the next layer of drilling down requires browsing and reading the whole text of the standard. A quick and costly way is to purchase the standard of your core interest; alternatively, you may find it in the library of a university. It will be easy to access if you are a student; additionally, many libraries are open at least to view the reference collection for external visitors, like company managers. Or just hire a student for an internship or a thesis; she or he will even do the work for a competitive price. A special feature of ISO is that the institutions that display all standards for public viewing, frequently in cooperation with university libraries, can be found on the ISO homepage.
Even with complete access to all ISO standards and other sources, some complications could hinder one’s understanding of the whole systems:
- Due to the editing process, a standard appears first as Draft International Standard (DIS). To follow the review every five years leading to a new edition, the year is indicated behind the series number (ISO 50001:2011). As the changes are mostly of minor impact, to guarantee continuity, it is an evaluation process if it is enough to get insight into the changes only by other sources or if the new version of the standard has to be analyzed in full text.
- National standards sometimes precede the global ISO scope, sometimes they lag it, and sometimes they exist in parallel with variations.
- Adding to complexity, intermediate levels between the worldwide ISO and national issuing bodies have to be taken into account (e.g.. European Norm, EN).
- Standards culminating in ISO can have considerable overlap with other standards institutions that are relevant for industries, associations of professions, other nongovernmental organizations (NGOs), guidelines, or legislation of public authorities.
Please note that the contents of the standards may be a bit disappointing. Sometimes the reader may wonder about the banalities that are included to fill pages, for example, the definition of energy consumption as “quantity of energy applied” (ISO 50001:2011, 2). Furthermore, the structure of the standard 50001, which we focus here, contributes to confusion: First, the terms are introduced by a bulky sequence of definitions in Chapter 3, listed alphabetically. The main content of the standard is contained in Chapter 4 to be consistent with ISO 9001 and 14001. Appendix A goes through the content a third time for clarification, partly giving useful advice and partly repeating what has already been said before. Taking into account other standards, the repetitions are even harder to trace. The language of the standards is sometimes legalese and not really helpful for managers or engineers. As an example here the definition of energy objective: “specified outcome or achievement set to meet the organization’s energy policy related to improved energy performance” (ISO 50001: 2011, 3). To be honest, sometimes the standards remind me of students trying to submit bulky theses.
Summing up, the idea of certified management systems is of great help serving companies as a structure to tackle energy and other management systems. The legislator can refer to the system, for example, as a condition for receiving tax breaks or being exempt from certain regulation. In the present system of ISO, the price of the standards is an obstacle to proliferation of the contents and—consequently—to the public benefit attained. The incentives for the issuing associations are not to keep the standards lean, but the number of standards. Moreover, the language and structure could be much more user-friendly. Countries are making their legislation available and cost-free on the Internet. The British Standard Association is following this way through PAS, publically available specifications. Important goals for standards systems, at least in the sustainability-related fields of environment and energy, should include being accessible for small businesses and the educational system free of charge, while trying to keep rules and language clear, lean, and concise.
Another Approach to Energy-Oriented Business Administration
A Comprehensive Model
Energy and carbon management is growing to such importance that energy-oriented business administration, energy as a function of business or an energy management interpreted as a corporate function, could be required. The most promising view is an energy-oriented business administration analogous to the environmental approach (since the 80s) and the sustainability approach (roughly since the 90s). Energy is a subaspect of both.
In this book, ISO 50001 serves as a structure for energy-oriented business administration. This way pays respect to the practical importance of this standard, which is determined by the corresponding forerunning quality and environmental management systems. But to be frank, business administration does not fit in elegantly. Figure 30.1 offers another structure arranging the functions of business with their energy relationship.
The starting points for energy management are balance sheets and reviews to get a technical information basis for all forthcoming decision making. They have to be taken on by managerial accounting evaluating the technical reviews. A crucial role is played by IT in its function as enabler. Management accounting serves as counselor for the business functions; some are named in the figure and discussed in the book. The operational doing has to be founded on basic values written down in an energy policy. The next step to effectiveness and impact has to be the organizational implementation of energy management. An energy management system according to ISO 50001 will be bound into a thoroughly designed system with quality, environment, carbon, and comparable aspects and certifications. To fully understand energy-oriented management and business administration, one must listen to and understand interdisciplinary background stories from outside the company. Energy markets, scarcity of resources, and global warming do have to be taken into account. Technological advances in energy efficiency, generation, and smart grids must be observed and interpreted according to threats and opportunities. Political legislation could trigger progress, bringing into reality the core ideas of the great economists, curing the flaws of our current market system.

Figure 30.1 A comprising model of business administration and energy management
A Tip for Teachers
If you are not a manager in a company tackling ISO 50001, but in academia, you will probably benefit more from this approach. Especially those teaching and doing research in business administration should think of adopting this concept; it is easy to assign the chapters and sort them anew. As mentioned in the introduction chapter “How to Use this Book,” consider structuring a course upside down. The two approaches (ISO and this chapter) seem to be very different, but the content is nearly the same. The form of looking at them is different.
What Would Happen If ?
Let us come back to the question of whether a global society could attain and maintain a Western style of living without destroying our climate equilibrium. Here are just some summarizing suggestions to support a positive vision, since we have at hand everything we need. Plus-energy buildings cut energy consumption by a fourth (depending on region and country). E-mobility needs only a fifth of fuel vehicles, and may contribute to balance electrical grids. Pumps, drives, and other energy-consuming devices and production technologies offer great potential for efficiency. Consciousness and organizational procedures help to avoid waste. The rest, which we certainly need, can be generated by green energy technology, for example, the sun is generous, renewables are unlimited, available, and make use of our intelligence and the existing technology.
If we take the widely accepted basic values of democracy and market system seriously, the necessary changes could be boosted. What would happen if we make markets really work by internalizing external costs? The next industrial revolution would spread its wings, bringing sustainable wealth into our global village. If people worldwide would understand these economic ideas, the political principles of democracy would trigger it. According to communicative ethics, the ones suffering from the consequences of climate change have to be introduced into the process of building a collective will. In conclusion, if we would endow all the coming generations carrying the burden of our way of life with a vote, a turnaround would become paramount. It is our responsibility to make it happen.
Capehart, B.L., W.C. Turner, and W.J. Kennedy. 2012. Guide to Energy Management. 7th ed. Lilburn, GA.
Darby, M. 2015. “China Carbon Trading to Almost Double in 2015.” RTCC. http://www.rtcc.org/2015/01/06/china-carbon-trading-to-almost-double-in-2015/
Eccleston, C.H., F. March, and T. Cohen. 2012. Inside Energy: Developing and Managing an ISO 50001 Energy Management System. Boca Raton, FL: CRC Press.
Howell, M.T. 2014. Effective Implementation of an ISO 50001 Energy Management System (EnMS). Wilwaukee, WI: ASQ Quality Press.
IFAC (International Federation of Accountants). 1998. Environmental Management in: Organizations: The Role of Management Accounting. New York: Financial and Management Accounting Committee, IFAC, Study 6.
IFMA (International Facility Management Association). 2014. “What is Facility Management?” www.ifma.org/about/what-is-facility-management
IMA (Institute of Management Accountants). 2008. Definition of Management Accounting. www.imanet.org/PDFs/Public/Research/SMA/Definition%20of%20Mangement%20Accounting.pdf
Jeffs, E. 2012. Greener Energy Systems: Energy Production Technologies with Minimum Environmental Impact. Boca Raton, FL: CRC Press.
Kals, J. 2010. Betriebliches Energiemanagement. Stuttgart, Germany.
Laszlo, C., and N. Zhexembayeva. 2011. Embedded Sustainability: The Next Big Competitive Advantage. Stanford, CA: Stanford Business Books.
Li, Xianguo, ed. 2011. Green Energy: Basic Concepts and Fundamentals. London: Springer.
Nutreon Engineering. March 21, 2014. “Energy Demand Modeling: Central Element of Energy Management. Presentation of Tesch, Ralf, at the University of Applied Sciences, Ludwigshafen.
Parkinson, G. 2014. “UBS: Time To Join the Solar, Electric Vehicles (EV), Storage Revolution. Renew Economy. www.reneweconomy.com.au/2014/ubs-time-to-join-the-solar-ev-storage-revolution-27742.
Rifkin, J. 2011. The Third Industrial Revolution: How Lateral Power is Transforming Energy, The Economy, And The World. New York, Palgrave MacMillan.
Sachs, J.D. September 22, 2014. “Sustainable Development Goals for a New Era.” Horizons, pp. 106–19. http://www.earth.columbia.edu/sitefiles/file/Sachs%20Writing/2014/HORIZONS_Sustainable%20Development%20Goals%20for%20a%20New%20Era_2014.pdf
Simon, A., M. Bernardo, S. Karapetrovic, and M. Casadesus. 2011. “Integration of Standardized Environmental and Quality Management System Audits.” Journal of Cleaner Production 19, pp. 2057–65.
Souza, G.C. 2012. Sustainable Operations and Closed-Loop Supply Chains. New York: Business Expert Press.
Sroufe, R., and S. Melnyk. 2013. Developing a Sustainable Supply Chain: Management Issues, Insights, Concepts, and Tools. New York.
Stern Review. 2006. The Economics of Climate Change. http://webarchive.nationalarchives.gov.uk/20100407172811/
Thaler, R.H., and W. Tucker. January-February 2013. “Smarter Information, Smarter Consumers.” Harvard Business Review.
Welch, T.E. 2011. Implementing ISO 50001: While Integrating With Your Environmental Management System. Deerfield Beach, FL: TriMark Press.
Wicks, A.C., R.E. Freeman, P.H. Werhane, and K.E. Martin. 2010. Business Ethics: A Managerial Approach. Upper Saddle River, NJ: Prentice Hall.
Energy Management
50001:2011 Energy management systems—Requirements with guidance for use
50002:2014 Energy audits—Requirements with guidance for use
50003:2014 Requirements for bodies providing audit and certification of energy management systems
50004:2014 Guidance for the implementation, maintenance and improvement of an energy management system
Environmental Management and LCA
14001:2004 (Corrigenda/Amendments in 2009) Environmental management systems—Requirements with guidance for use
14020 to 14025 Environmental labeling
14040, 14044, 14047, 14049, 1471, 1472 Life-cycle assessment
Greenhouse Gas and Carbon Management
14064:2006 Greenhouse gases, three parts, Part 1: Specification with guidance at the organization level for quantification and reporting of greenhouse gas emissions and removals
14065:2013 Greenhouse gases—Requirements for greenhouse gas validation and verification bodies for use in accreditation or other forms of recognition
14066:2011 Greenhouse gases—Competence requirements for greenhouse gas validation teams and verification team
14067:2013 Greenhouse gases—Carbon footprint of products—Requirements and guidelines for quantification and communication
14069:2013 Greenhouse gases—Quantification and reporting of greenhouse gas emissions for organizations—Guidance for the application of ISO 14064-1
Further Standards
9001:2015 Quality management systems—Requirement
26000:2010 Guidance on social responsibility