
CHAPTER 15
Embedding ERM into Strategic Planning at the City of Edmonton
KEN BAKER
ERM Program Manager at the City of Edmonton, Alberta, Canada
To me, the only good reason to take a risk is that there's a decent possibility of a reward that outweighs the hazard. Exploring the edge of the universe and pushing the boundaries of human knowledge and capability strike me as pretty significant rewards, so I accept the risks of being an astronaut, but with an abundance of caution: I want to understand them, manage them, and reduce them as much as possible.
—Commander Chris Hadfield1
The Administration of the City of Edmonton in 2012–2013 explored ways to implement enterprise risk management (ERM), with a focus on strategic risk.
Previous attempts at ERM were not fully implemented, but a new opportunity arose when Edmonton created a new strategic plan, The Way Ahead, in 2008. With the strategic plan and goals well established, they required risk analysis to determine what could prevent the city from achieving its goals and objectives, and how to allocate scarce resources most effectively to mitigate risks to achieving those goals and objectives.
The City Administration hired an Enterprise Risk Management Program Manager in 2012 to address the need to implement ERM at a strategic level.
After studying several models and frameworks for addressing risk, and conducting pilot workshops for two of the six directional plans that supported the strategic plan, The Way Ahead, the ERM Program Manager worked with the Administration to determine a course of action going forward based on these workshops.
CONTEXT—CITY OF EDMONTON
The City of Edmonton, capital of the western Canadian province of Alberta, has been a meeting place since the end of the last Ice Age. First settled by Europeans as a fur-trading post in 1795, Edmonton has grown incrementally, driven by prairie settlement in the 1880s, rail connections in 1891 and 1905, and the Klondike Gold Rush of 1897. Already an agricultural center, its reputation as “Oil Capital of Canada” was cemented in 1947 with the discovery of major oil deposits nearby. Growth since that time was largely based on resource development, and further accelerated as Edmonton served as hub for new oil sands development in northern Alberta starting in the 1970s.
Edmonton has grown significantly. In 2013, it was a city of over 800,000, anchoring an Alberta capital region of over 1.1 million. The city is experiencing nation-leading economic and population growth2 and is expected to reach 900,000 by 2018.3 It is home for world-leading research in several fields, including medicine, energy, nanotechnology, and winter city design. Its commercial and cultural life has earned it the nicknames “Gateway to the North,” “Canada's Festival City,” and “City of Champions.”
City Government
Constitutionally, municipalities in Canada are the responsibility of their respective provincial governments. As such, the City of Edmonton is subject to provincial legislation, mainly the Alberta Municipal Government Act. In 2013 the elected City Council consisted of the mayor as well as a councillor for each of Edmonton's 12 geographic divisions (wards). Reporting to Council is the City Manager, and through him the City's 11,000 employees,4 divided into five departments.
The Edmonton City Council operates the two-employee model, the second employee being the City Auditor.
ERM DEVELOPMENT IN THE PAST
In 2003 the Office of the City Auditor (OCA) and Administration jointly created an ERM framework, the Corporate Business Risk Planning (CBRP) model. Using input from several city departments as well as external subject matter experts, the CBRP model was based on the Committee of Sponsoring Organizations (COSO) risk management framework, with modifications to allow for weighting of risks at multiple levels of management. The Conference Board of Canada requested permission to use parts of the framework, in particular the Risk Management Assessment Framework tool. CBRP was presented to senior leadership in 2005 and piloted but not fully implemented; it is believed that Edmonton was not yet ready to undertake the discipline at that time.
City Auditor's Report
In a 2005 audit report,5 the city auditor reported to the City Council's Audit Committee that:
- Known risks were being managed reasonably well.
- Risks that are strategic in nature were not clearly identified.
- ERM results were not consistently incorporated into business plans.
Administration Response to City Auditor's Report
Following the 2005 city auditor's report, several steps were undertaken to address the issues raised in the report:
- The chief financial officer was appointed sponsor for the ERM program.
- ERM governance was added to the responsibilities of the City Council's Audit Committee, which consists of the mayor, four city councillors, and two members of the public.
- In 2011 a Program Manager and an ERM Working Committee, made up of subject matter experts from throughout the Administration, were appointed to advise on a framework for strategic risk. At this point the 2005 city auditor's report was closed.6
- An ERM Program Manager was hired in 2012 to assist the Program Manager. In addition, oversight of the ERM framework selection process was passed to the Transforming Edmonton Committee (TEC), comprised of senior leaders responsible for the goals within the strategic plan (The Way Ahead), and from the ERM Working Committee, although the entire ERM Working Committee was kept abreast of developments.
CURRENT OVERALL ERM DEVELOPMENT
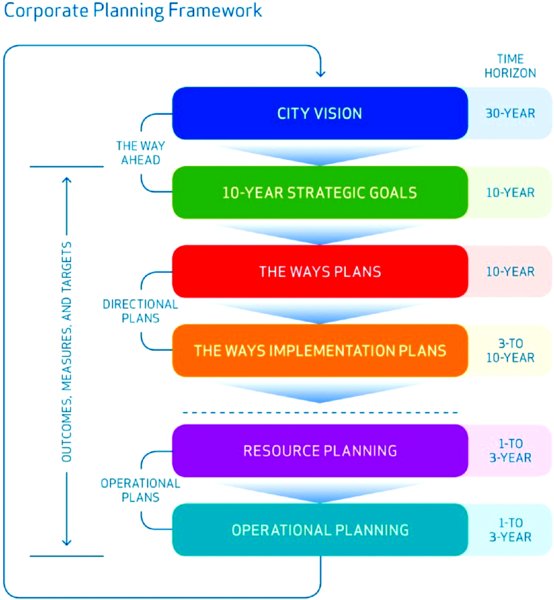
After the city auditor's report in 2005, Edmonton adopted a 30-year vision and six 10-year goals, forming the City of Edmonton Strategic Plan, The Way Ahead. From it were derived six “Ways” plans (directional goals, objectives, performance measures, and targets) in support of The Way Ahead:
| Transform Edmonton's Urban Form | The Way We Grow |
| Shift Edmonton's Transportation Mode | The Way We Move |
| Improve Edmonton's Livability | The Way We Live |
| Preserve and Sustain Edmonton's Environment | The Way We Green |
| Ensure Edmonton's Financial Sustainability | The Way We Finance |
| Diversify Edmonton's Economy | The Way We Prosper |
At the time of writing, all the directional plans have been approved by City Council, except for The Way We Finance.
A summary of The Way Ahead and the six “Ways” plans derived from it can be found in the Appendix at the end of this chapter.
LINKS TO STRATEGIC PLAN AND TO OTHER STRATEGIC TOOLS
When developing ERM strategy, the following five questions are asked:
- What are our long-term vision and goals?
- What strategy will help achieve the vision?
- What objectives will achieve the strategy?
- What performance measures will show whether the objectives are achieved?
- What risks will interfere with achievement of the objectives?
Both performance measurement (PM) and ERM need to be considered when advancing the strategic objectives. Recognizing this, the Office of the Chief Financial Officer realigned its Corporate Strategy and Performance section so that the ERM Program Manager, strategy, and PM staff work together in the same section. This provides possible opportunities to combine the processes of ERM, strategy, and PM to gather information for each more efficiently.
Results-Based Budgeting
ERM assists in resource allocation decisions (as shown in Exhibit 15.1) and so was seen to possibly conflict with budgeting models, including a results-based budgeting (RBB) model concurrently piloted by the Administration. The two models can be reconciled, however. For instance, one of the criteria in the RBB model for evaluating city programs was the amount and likelihood of risk relative to the amount of benefit the program was deemed to provide. Conversely, a program's quartile rating in RBB could be used as an indicator in the ERM model to determine a program's effectiveness in achieving its desired outcome. In this way, both models could inform each other.
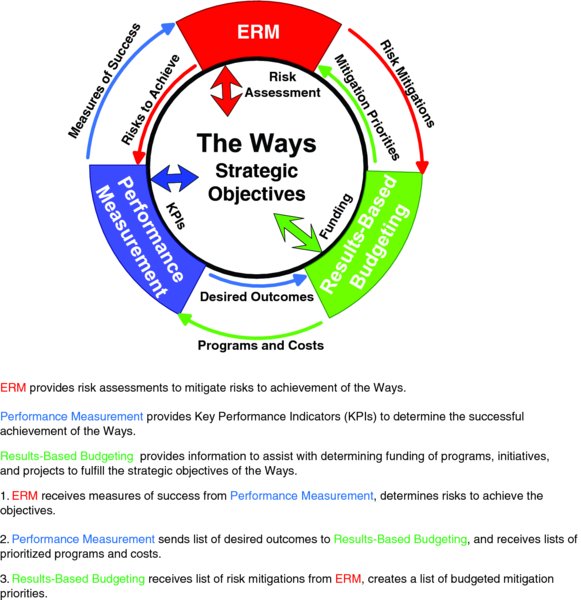
Exhibit 15.1 Relationship between ERM, Performance Measurement, and Results-Based Budgeting
Capital Budgeting Models
Edmonton's infrastructure branches use sophisticated risk management models for maintaining and replacing current capital assets, and are introducing risk assessment into business cases for new capital projects. The strategic ERM model needs to incorporate these projects at the strategic level.
A graphic showing the linkages between ERM, Performance Measurement, and Results-Based Budgeting is shown in Exhibit 15.1.
SELECTING AND TESTING A STRATEGIC RISK MANAGEMENT MODEL
After a review of several ERM frameworks (CBRP, ISO 31000, COSO, etc.), the Administration decided on a strategy-focused approach. The relationship of strategic ERM as part of the risk universe is shown in Exhibit 15.2.

Exhibit 15.2 Relationship between Strategic, Project, and Operational Risks
Such a method was provided in the Risk Scorecard model devised by pm2 Consulting (www.pm2consulting.com). The Financial Services and Utilities department (facilitated by the ERM Program Manager) conducted two pilot Risk Scorecards using the pm2 model, for The Way We Move and The Way We Live. Following is a description of the pm2 Risk Scorecard methodology.
Pilot pm2 Risk Scorecard Methodology
The Risk Scorecard consisted of six steps, each dependent on the previous one:
- Weighting of goals in the plan based on what is the highest priority in the organization to advance
- Linking of strategic objectives to goals—determine how the strategic objectives contribute to goals, and to what degree (relationship expressed as low/medium/high)
- Identification of risks to each strategic objective, scored 1 to 5 in likelihood and 1 to 5 in impact
- Identification of how current programs (processes) contribute to achieving strategic objectives; currently performed—scored 1 to 5 in relationship to strategic objective and in effectiveness in meeting expectations
- Identification of planned future initiatives—scored 1 to 5 in relationship to strategic objectives
- Identification of possible future mitigations and risk indicators
Deliverables from this process include a risk register, a heat map, and charts showing each strategic objective's cumulative levels of risk, program contribution, and initiative contribution, to show relative effort toward areas of relative risk. In addition, a list of possible future mitigations and a list of risk indicators (measures to show as early as possible that a risk may be occurring) can be derived. The methodology is shown in Exhibit 15.3.
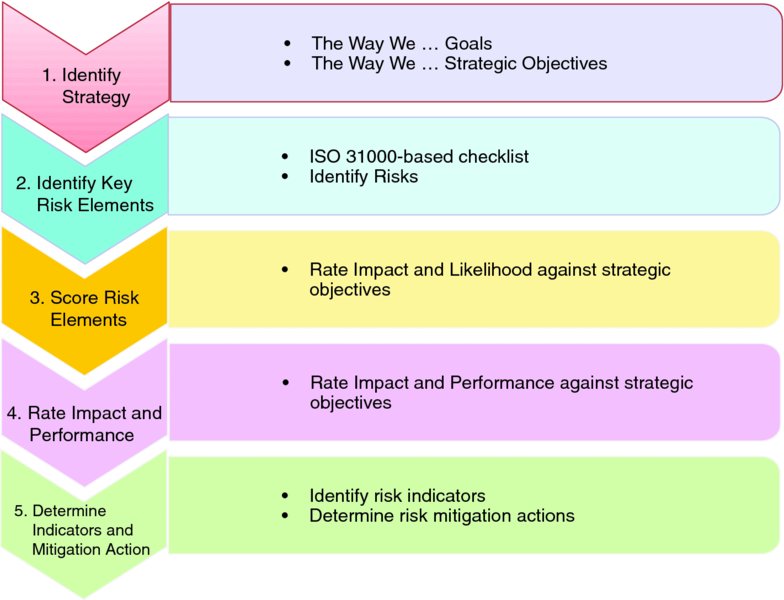
Exhibit 15.3 pm2 Risk Scorecard Process Diagram.
Source: pm2 Consulting, 2012
Ideally, risk assessment would have taken place during the creation of strategic planning documents to help determine the most risk-appropriate actions to achieve the vision and goals. However, the “Ways” documents were created before ERM was conceptualized in Edmonton. Therefore, pilots were conducted to catch up to each Ways document by conducting a Risk Scorecard workshop for each one. Because of the resource commitment of this exercise, workshops could realistically only be done one at a time. By the summer of 2013, pilot Risk Scorecards for two Ways documents had been completed or nearly completed: The Way We Move and The Way We Live.
Initial Planning
After agreeing to the plan between Administration and pm2 Consulting, a facilitator conducted workshops. For the first pilot, three staff members from pm2 Consulting facilitated the workshop; for the second, the ERM Program Manager was the facilitator. For both pilots, permission for the participation of lead department staff was sought and received from the general manager of the lead department: for The Way We Move, Transportation Services; for The Way We Live, Community Services. Branch managers for strategic planning for both departments were tasked to provide subject matter experts from their staff for the entire workshop; each provided three to five staff members to bring department expertise. In addition, for steps 2 and 3 (risk Identification and Scoring), senior department staff, mainly branch managers, were asked to participate in scoring the likelihood and impact of risk events, and to add to or amend the list of risk events.
Each of the workshops took approximately 60 to 70 hours to complete. To keep time commitments, some portions of steps that were deemed to be less critical were omitted.
Step 1: Identify Strategy
The first step in the process is to identify strategic direction. Edmonton had a 30-year strategic plan, The Way Ahead. Using input from the public as well as subject matter experts, The Way Ahead was approved by the City Council and is the key planning document for the city going forward. To assist in its implementation are the six Ways plans noted previously. These documents made strategy identification straightforward. For the first pilot, The Way We Move (transportation plan) was selected. It was considered the best place to start because it was the most homogeneous of the plans; responsibility for its implementation was overwhelmingly with one department, Transportation Services. As well, its format made it essentially a capital plan, with easily understood objectives and goals.
At this point the ERM team had to decide at what level the strategic weightings were to occur. Options included the six 10-year goals or the 19 strategic objectives, among others. It was decided that the strategic objectives would be the appropriate level of analysis for the risk register. The goals would be at too high a level to be meaningful, and other criteria would not serve the city's purpose in addressing the risk needs of the Ways.
At this point a weighting of the goals was attempted. Subject matter experts, including the department general manager, allocated a percentage of support to each of the six goals. (It should be noted that, for political reasons, this weighting of the goals may be skipped as management may not want to prioritize these at this time.) The goals were then placed on the vertical axis of a table, with the strategic objectives across the top. An example of this table can be found in Exhibit 15.4.
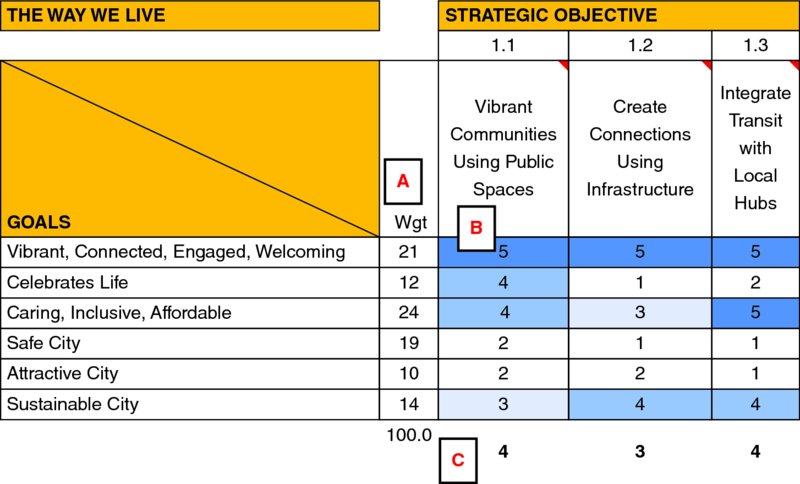
Exhibit 15.4 Relationship between Strategic Goals and Objectives.
Source: Adapted from pm2 Consultants Risk Score Card Model, 2012
For each strategic objective, the subject matter experts (in this case, four people from the Community Services department) indicated the link to each goal on a scale of 1 to 5. The larger an objective, the more goals it would relate to, and the higher weighting it would receive. When this was completed, each strategic objective had a weighting (C), expressed as a percentage, calculated as:
where:
- A = Goal weighting (expressed as a percentage)
- B = Relationship to objective (1 to 5)
The sums for each column are added together to get a total weighting; the sum for each column is divided into this total to derive its relative weighting (in this example, 4 percent).
This gave each strategic objective a weighting. This weighting was then compared to that of every other strategic objective to arrive at a percentage of the total weighting. This kept the weightings constant in relative terms.
The objectives were then transposed to another table where they formed the vertical axis, then sorted by their percentage of the total objective weighting, with the highest weightings at the top. This allowed the group to select high, medium, or low weightings for each strategic objective. This categorization would be carried on to the next step, risk identification.
Step 2: Identify Key Risk Elements
Using a risk category checklist (a list of categories of potential risks covering all possible types of risk—e.g., financial, political, partner), the workshop group, with assistance from a number of subject matter experts, including branch managers, created a list of risks that could impact the achievement of the strategic objectives.
Step 3: Score Risk Elements
The risks agreed on by the group were then placed across the top of a table with the strategic objectives listed vertically along the left side. Directly below each risk was a measure of likelihood of the risk occurring (again on a 1 to 5 scale). The likelihood score was agreed on by the subject matter experts. The team then scored each risk to each strategic objective, again on a 1 to 5 scale. This provided two outputs: the scoring of risks and the risk weighting of each strategic objective. A sample of this table is shown in Exhibit 15.5.
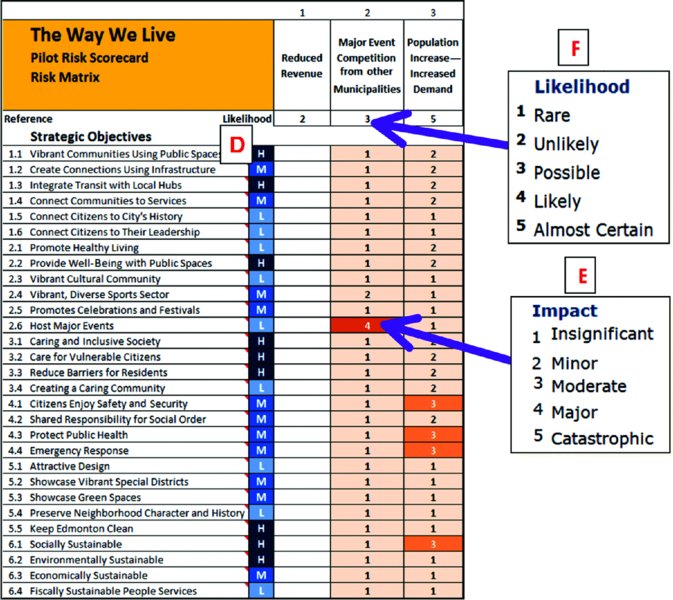
Exhibit 15.5 Relationship between Risks and Strategic Objectives.
Source: Adapted from pm2 Consulting Risk Scorecard model, 2012
The risk scores were calculated as:
where:
- D = Strategic objective weighting (1 for low, 3 for medium, 5 for high)
- E = Risk impact on objective (1 to 5)
- F = Risk likelihood (from top of column) (1 to 5)
These were summed vertically for each risk.
The risk weighting of each strategic objective was calculated using the same formula but summed horizontally for each strategic objective.
The risks were then transposed onto a data table with their likelihood and their weighted impact score (the sum of each D × E calculation for each cell in the column). This provided the basis for the risk register and the heat map.
At this point, several graphs can be created to show the relative nature of the risks and the strategic objectives. From a risk-based perspective, a heat map can be created showing the risks with the highest likelihood and weighted impact score. The more strategic objectives a risk can affect, the greater is the weighted impact score for that risk. For strategic objectives, a graph can be produced to show the strategic objectives most impacted by risk. The more risks affecting a strategic objective, and with greater impacts, the greater that objective's weighted risk score.
Step 4: Link Programs, Initiatives, and Risks
The next list required was that of the existing programs currently in place to fulfill the strategic objectives. For the ease of the workshop, it was decided to use the list of programs shown in the annual operating budget. Other program levels could have been used, such as that used in the city's results-based budgeting (RBB) initiative. This initiative divided budget-level programs into smaller components, which would be easier to change but increased the number of programs tenfold. It was for this reason the RBB-level program list was rejected; the number of programs in that initiative was exceedingly high.
Once a program level was agreed on, a new table was created, with the programs across the top and the strategic objectives down the left side. On this table, the subject matter experts scored the impact of the relationship between each program and each strategic objective (on a 1 to 5 scale). In addition, the participants estimated the effectiveness of each program (i.e., whether it fulfilled the requirements of the program), again on a 1 to 5 scale, with 5 meaning the program was performing as required and 1 meaning the program's performance was well below what was required. The difference between what was required of the program and its actual performance (i.e., 5 minus the effectiveness score) was known as the strategic gap. An excerpt from this table can be found in Exhibit 15.6.
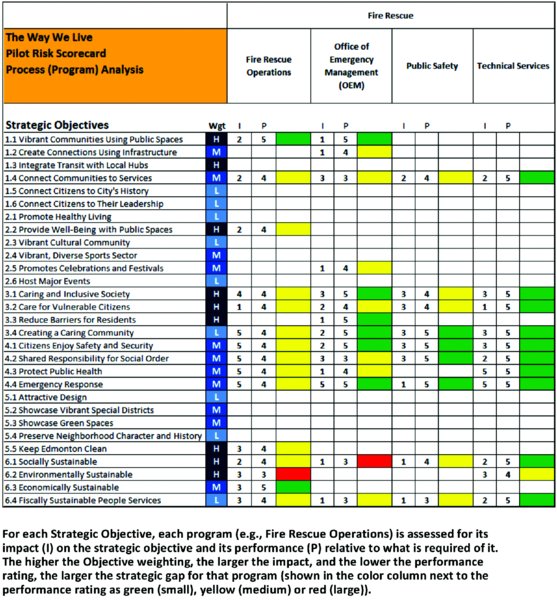
Exhibit 15.6 Linkages between Strategy and Programs.
Source: Adapted from pm2 Consulting Risk Scorecard model, 2012
At this point a new graph could be created, with a vertical bar for each strategic objective and its cumulative program requirements. Adding the cumulative effectiveness and cumulative strategic gap gave a stacked bar graph whose height was its cumulative program requirement. The bigger the objective, the more programs it had and therefore the higher cumulative program requirements (and likely a proportionally large strategic gap).
The last dimension in step 4 was to list new initiatives the City planned to implement, and rate their importance to each strategic objective. For the purposes of the workshop, it was decided to limit the list to those in the Implementation Plan for each Ways document. Within this set of possibilities, only the initiatives coded as “will do” (not “already done,” “already doing,” “could do,” or “aspire to do”) were used for the initiatives list, to keep it to a manageable size. With this list scored by each strategic objective on a 1 to 5 scale, a graph could be produced showing the cumulative impact of future initiatives on each strategic objective. A table linking initiatives to strategy is found in Exhibit 15.7.
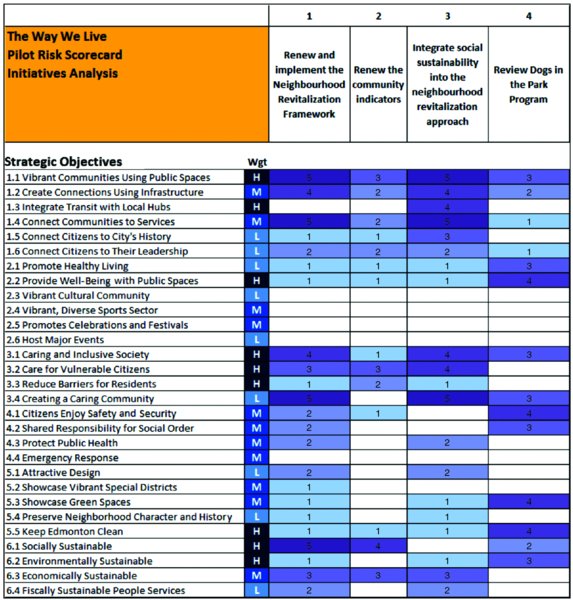
Exhibit 15.7 Linkages between Strategy and Initiatives.
Source: Adapted from pm2 Consulting Risk Scorecard model, 2012
With the strategic gap and initiatives impact established, the two graphs for each objective could be combined on one graph to show the cumulative strategic gap and cumulative initiative impact for each strategic objective. If resources were properly allocated, one would expect to see a correlation between the height of the strategic gap bar and the height of the cumulative initiative impact point for each objective. For viewing purposes, it was necessary to use different scales for each data series, to best show the correlation. Finally, the risk weighting for each strategic objective could be added to the graph. This showed the relative risks associated with each strategic objective in relation to its required programs and initiatives. Overall, a correlation between risk, strategic gap, and initiatives may be observed. For objectives whose risks do not correlate with strategic gap and initiatives, this forms the basis of discussion for the objective; in-depth analysis shows the types of risks, whether they are caused by or independent of the programs comprising the strategic gap, and whether future initiatives address the risks, either directly or indirectly. The graph showing risk, strategic gap, and impact of initiatives on strategic objectives is found in Exhibit 15.8.
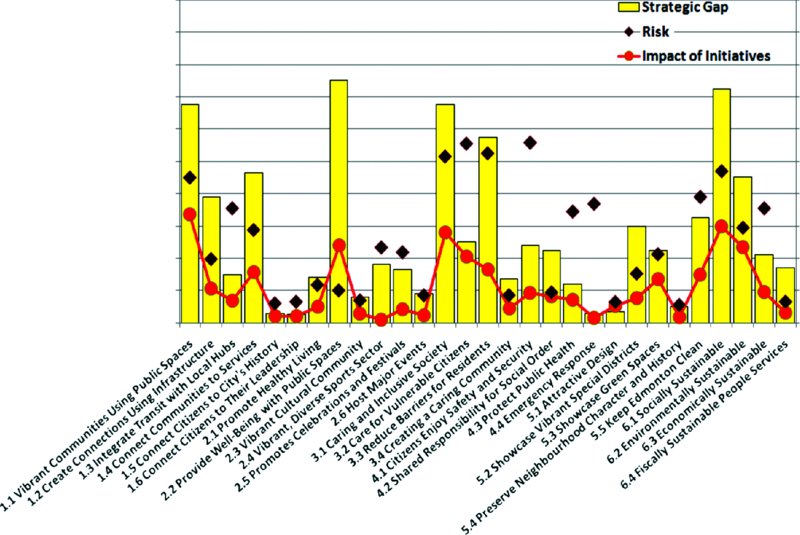
Exhibit 15.8 Strategic Objectives—Risk, Strategic Gap, and Impact of Initiatives.
Source: Adapted from pm2 Consulting Risk Scorecard model, 2012
Step 5: Determine Indicators and Mitigation Actions
The final step involved completion of a risk indicator worksheet for each risk/strategic objective combination. This sheet required the user to list potential mitigation strategies, including required lead time, as well as indicators of inputs, actions, or outputs that would signal the potential onset of a risk event. The worksheet data were then summarized in a database indicating strategic objective, risk, mitigation, lead time, and whether the organization is already undertaking the mitigation. The database could then be grouped by objective, risk, or mitigation as needed.
On completion of the mitigation database, the final risk scorecard could be completed. This was a table showing strategic objectives on the left and risks across the top. For each data point, the impact of the risk on that objective was indicated, as was its performance (good, fair, or poor shown as medium gray, light gray, dark gray), and showed the risk level for each objective (the level of potential risk of the risk element impacting this strategic objective).
This provided a basis of discussion to identify key risks affecting strategic objectives.
SELECTING AN ERM FRAMEWORK
At the end of the second pilot, each department involved (Transportation Services for The Way We Move and Community Services for The Way We Live) was consulted to provide feedback on the process. As a result of the consultations it was decided to componentize the pm2 model, as some aspects were seen to add more value than others. In addition, the model as a whole was found to provide levels of complexity that, while useful, might preclude its successful implementation. Each individual component could then be compared with other frameworks.
During this time, staff from the Edmonton Police Service (EPS) met with the Financial Services staff and presented its ERM process, based on the ISO 31000 framework. By provincial law, EPS maintains a separate command structure, reporting to the City Council through the Edmonton Police Commission. Independently, the EPS had, over a span of five years, evolved a mature ERM process based on in-depth performance measurement tools and impetus from the Police Commission to proactively identify and treat its risks. The EPS felt at this time that it could offer to share its ERM model with other city departments on an operational level. This provided an incentive for the Financial Services department to compare the pm2 model with the ISO 31000 framework to determine a best solution going forward. A diagram of the ISO 31000 ERM process is found in Exhibit 15.9.
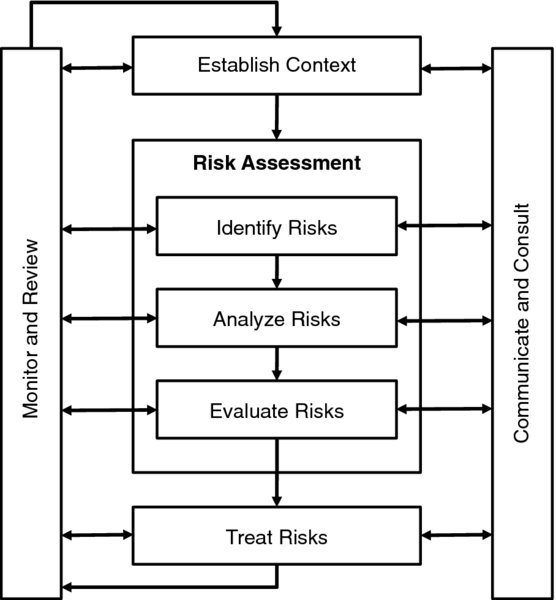
Exhibit 15.9 ISO 31000 Enterprise Risk Management Process Chart.
Source: Based on CAN/CSA-ISO 31000-10, Risk Management—Principles and Guidelines, International Standards Organization/Canadian Standards Association, 2009
Comparison of pm2 and ISO 31000 Frameworks
After two pilots of the pm2 framework (with The Way We Move and The Way We Live), the ERM team evaluated the pilots to provide recommendations for strategic ERM going forward. Elements were taken from ISO 31000 and the pilot project. A comparison of the two frameworks is found in Exhibit 15.10.
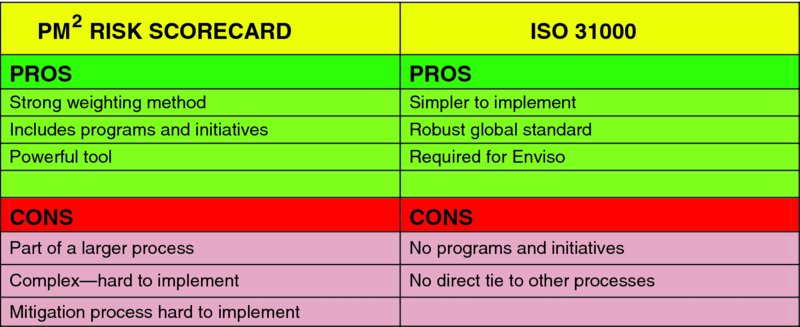
Exhibit 15.10 Comparison—pm2 Risk Scorecard versus ISO 31000 Model
RECOMMENDED STRATEGIC ERM MODEL
After reviewing the results from the two pm2 pilots, the ERM team consulted with the subject matter experts from both operating departments involved in the Risk Scorecard workshops. The participants saw the logic in the model and had a good understanding of what was required in the workshop. They also provided valuable feedback on the usefulness of each section of the model.
All participants regarded step 1, the linking of goals and strategic objectives, as a strength; in fact, it was believed that this methodology would add value to other processes as well, such as results-based budgeting. Steps 2 and 3, identifying and scoring risks, would be core processes for any risk model. Step 4, linking programs, initiatives, and risks, was regarded as powerful but potentially confusing to branch managers and, as a result, might not add the expected value to the process. Moreover, linking programs and initiatives may have also been done with other processes, making this a duplication of effort. Finally, step 5, while necessary to the ERM process, was considered to be excessively complex and time-consuming. A simpler process for determining mitigations and following up was needed. From discussions with EPS and other research regarding ISO 31000, it was determined that the ISO 31000 framework held the key to a simpler risk mitigation and review process. It was also superior to the Risk Scorecard model in that it focused on mitigation at the risk level, rather than the strategic objective level, and did not require a separate worksheet for each risk/objective combination. Finally, because several city branches were certified to the ISO 14001 (Environmental Management) standard under Edmonton's Enviso program, it was noted that upcoming recertifications would require risk assessment conforming to the ISO 31000 standard.
The final recommended strategic ERM model for the City of Edmonton consisted of four steps, and is shown in Exhibit 15.11.
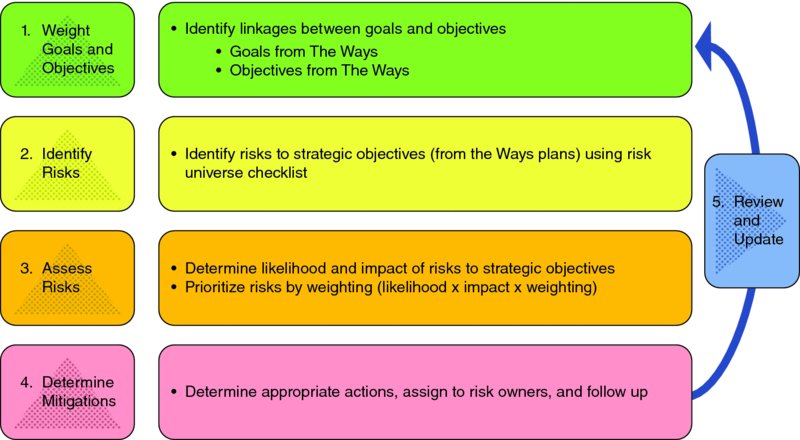
Exhibit 15.11 The City of Edmonton's Proposed ISO 31000–Based Strategic Risk Management Framework
Step 1 (Weight Goals and Objectives), step 2 (Identify Risks), and step 3 (Assess Risks) are the same as steps 1 to 3 in the pm2 Risk Scorecard model. Step 4, however, is based on the “Evaluate Risks” and “Treat Risks” sections of the ISO 31000 RM (risk management) standard. In Step 4, the risks are transposed onto a risk register, where each row contains the necessary information for that risk: category, description, likelihood score, weighted impact score, weighted risk score, risk rating, risk acceptance, summary comments, current mitigations, future mitigations, risk owner, status update, and update interval.
An example of the proposed risk register is found in Exhibit 15.12.
| Risk Category | Risk Element | Current Risk Rating | Risk Accepted? (Y/N) | Summary Comments | Current Mitigation Actions | Future Mitigation Actions | Risk Owner | Status Update | Update Required |
| Economic | Economic slowdown results in increased demands on Social Supports | Medium | No | Strategic Outcomes: Higher demands are placed on existing programs, resulting in reduced overall service levels
Risk Not Acceptable: Economic slowdown will require the City to prioritize programs and reallocate resources to provide social services in the most effective manner |
Devise scalable plan for program prioritization | CLT | Economic conditions are monitored constantly no downturn detected to date (4 Oct. 13) | 6 Months |
Exhibit 15.12 Sample Proposed Risk Register
LESSONS LEARNED
Several lessons were learned in terms of (1) key success factors and (2) the process of selecting and implementing a framework. The findings from these two categories are shown next.
Key Success Factors
Buy-In by Senior Management
Edmonton's Corporate Leadership Team (CLT, comprised of the city manager and the general manager of each department) has supported the concept of ERM. At a senior management level, staff must be able to perceive the value added by ERM. This makes design of an appropriate ERM process, which can show value to management, critical to its success. An example of the value proposition is found in Exhibit 15.13.

Exhibit 15.13 The ERM Value Proposition.
Source: Integrated Risk Management “Building Bridges: City of Winipeg, Audit Department”, February 2009
In general, the process must have two properties: it must be simple and it must show the value of doing it.
A critical balance must be struck between model power (i.e., how much information it provides) and user-friendliness. A model can provide large amounts of information but will not be helpful if it is too complex to be understood or too time-consuming to be considered worthwhile by the users. Conversely, a model that is too simple will not be helpful, as it will lack the relevance to achieve buy-in.
The pm2 model consists of a number of simple steps performed in sequence to produce powerful results. These results include comparisons of risk, effectiveness of current programs, and the impact of future initiatives on achievement of strategic objectives. The challenge for the ERM team is to show the simplicity of the steps in the model to leaders, to ensure their understanding of the concept and buy-in to the model. Concerns have been voiced by department staff that the model, as followed in the pilot Risk Scorecard workshop, may include steps deemed too complex by branch managers. If necessary, some steps can be removed, and the model stripped to its risk analysis component if other levels of analysis are deemed not to add value to management, without losing the robustness of the model.
Whatever model is used, it must be customizable to the city's circumstances. For example, if branch managers believe a process to be too time-consuming or too difficult, it must be shortened and simplified to overcome this concern. Conversely, if the model is considered too simplistic to add value, rigor must be added to the model to show the value added and to show the time spent to be worthwhile.
Culture of Innovation (Risk-Smart)
In addition to buy-in from senior leadership, ERM also requires a culture of innovation, where new ideas are embraced and failure is tolerated. At a senior management level, the Transforming Edmonton Committee (TEC) is responsible for overseeing strategic planning and successful achievement of the city's strategic goals under The Way Ahead. Ensuring that the TEC understands the relationship between strategy, ERM, and performance measurement (PM) is key to successful ERM implementation.
Governments have traditionally been regarded as risk-averse, as political opponents would pounce on any perceived error by the government. To enable a culture of innovation, however, the organization must move from a risk-averse view to a risk-aware view, in which it openly recognizes the risks it faces. Finally, as the organization fully embraces its culture of innovation, it must move from a risk-aware view to a risk-smart view, where risks are embraced, well-managed, and mined for opportunities.
Consistency of Model across the Ways
The ERM Program Manager, as facilitator of the workshops, must ensure that consistent standards are maintained in weighting objectives, defining risks, and determining mitigations and feedback.
A strength of the pm2 model is its robustness. This robustness stems from the model's system of weighting of strategic goals and objectives. Even if a future City Council drastically changed the prioritization of the goals, the model would automatically adjust for this change and update the risk register and other outputs accordingly. Other models would require an in-depth review of each risk in light of such a change.
This weighting system for goals and objectives can potentially be carried over to other management processes as well. For example, the results-based budgeting (RBB) model currently being tested by the City also has a weighting system for city programs to prioritize them. In addition, performance measures can be similarly prioritized to determine which ones carry the highest priority and therefore warrant the most scrutiny.
Another strength of the pm2 model is that it does not differentiate between operating and capital items. Often a strategic objective has both a capital and an operating component (e.g., construction of a new recreation center and staffing and maintaining it afterward), which are dealt with in separate operating and capital budget cycles.
Resource Requirements on Department Subject Matter Experts
Each step in the ERM framework requires input at a senior management level in each operating department. Cumulatively these time requirements can be material for senior management already dealing with the resource constraints of their regular duties. The challenge for the ERM and other models is to minimize the time required of city staff to avoid push-back from project fatigue, which would impact the success of the ERM program.
Department Accountability for Key Risks
When key risks are identified, the department in question must take ownership of the model and assign key risks to designated risk owners. These individuals will be responsible for devising and implementing mitigation strategies and reporting results at appropriate intervals.
Findings on the Process of Selecting and Implementing a Framework
Implementing an ERM framework typically takes longer than expected. More time seems to be spent getting buy-in for the concept from the C-suite and devising an appropriate model than one could ever predict. Rarely do off-the-shelf frameworks exist that can be employed in short order; plans usually have to be tailored to fit the organization's unique circumstances. Some of Edmonton's learnings from this ERM implementation include the following.
There is no perfect system. What works for one organization may not work for another. What is necessary is flexibility. Any system must be simple enough to understand, robust enough to be usable in any area of the organization, and powerful enough to add value in decision making. In addition, it may be preferable to create a hybrid approach, taking the best parts of two or more competing systems to create one that best meets the organization's needs.
No matter how good an ERM framework is, if senior leadership does not buy in to the framework, it cannot succeed, as management will need to see the usefulness and cost justification. Three frameworks were presented to senior leadership between 2005 and 2013; all were sound and based on extensive research and knowledge of risk management principles. All were found by senior leadership to be either too complex or not a fit to Edmonton's needs.
It may be problematic to try to roll out an entire system at once. In the initial ERM planning phases there seems to be a tendency to try to hit a home run; that is, to roll out a perfect ERM system at strategic, project, and operating levels all at once. It may be the most efficient in theory, but in practice it requires a prohibitive amount of up-front resources. It ignores the learning curve managers have in learning about ERM, how it applies to them, and how to do it. This leads to the next point.
It may be preferable to introduce one phase of ERM at a time. In Edmonton's case, previous attempts at an ERM framework were unsuccessful because they went against the stated wishes of the Corporate Leadership Team (CLT). One of the CLT's main drivers for action on ERM was the 2005 city auditor's report, which identified issues mainly with strategic risk. With this in mind, the CLT wanted primarily to focus just on strategic risk, not on an overall framework. In terms of a corporate rollout, then, phase 1 was to be strategic risk; project risk and operational risk could be dealt with later, as these were lower priorities for the CLT and the city auditor.
When working with operating departments on a framework (even a pilot), it is important to define clearly what you want to accomplish with the operating departments in question. In this case, it was clearly defined that the department owned the risk register and was responsible for its content; the ERM team's role was to maintain it. Going forward, the ERM team's role was also that of facilitator, coach, and mentor to the department staff.
CONCLUSION
At time of writing, the recommended strategic ERM model was being fine-tuned for the remaining Ways documents, pending feedback from the teams involved in the two pilot Risk Scorecards.
In the longer term, the ERM Program Manager recommended further consolidation of the ERM model by ensuring links to project risk management, and by harmonizing operations' risk management practices with the ISO 31000 risk management standard, to provide consistent risk management methods to all areas, many of which are already practicing ERM, but using different formats.
Finally, the process of ERM needs to be tied to the process of performance measurement going forward. As strategic performance measures are created or amended, the risks to achieving them need to be identified at the same time, to provide the most efficient and effective means of ensuring that the measures of success can be achieved.
Appendix: Summary of THE WAY AHEAD, EDMONTON'S STRATEGIC PLAN
The City of Edmonton developed a strategic plan in 2008 called The Way Ahead. It contains:
- A 30-year citizen-built City vision, describing Edmonton's future
- Six 10-year strategic goals: Transform Edmonton's Urban Form; Shift Edmonton's Transportation Mode; Improve Edmonton's Livability; Preserve and Sustain Edmonton's Environment; Ensure Edmonton's Financial Sustainability; and Diversify Edmonton's Economy
- Corporate outcomes, performance measures, and targets
The Way Ahead was developed using the principles of integration, sustainability, livability, and innovation. It was built on a strong base of programs and services that already exist.
The Way Ahead has provided a foundation for prioritization and decision making. Since 2008, continual improvement has been made to the plan.
To better understand and measure how Edmonton is advancing the vision and 10-year goals, corporate outcomes for all six 10-year goals and performance measures for five of the six goals were developed in 2010. Performance measure targets for three of the six goals were approved in 2011. The Way Ahead was updated in 2011 to reflect this progress.
Over the past five years, the city has developed several directional plans to help achieve The Way Ahead.
Directional plans, referred to as the Ways plans, have been established to focus the city's work in both the achievement of the 10-year strategic goals and in delivering existing services to citizens. Accompanying Ways implementation plans were also developed to outline specific initiatives and actions that contribute significantly to the achievement of the Ways plans. The following chart shows each of the plans and when they were created.
| Directional Plans | Implementation Plans |
|
|
In addition, the city is taking a results-based approach to aligning resources with the vision and 10-year strategic goals. Results-based budgeting is about emphasizing performance and accountability.
The following chart shows the alignment between The Way Ahead, Ways plans, and operational planning.
QUESTIONS
- What other strategic processes are closely tied to ERM?
- What three kinds of risks are identified within the City of Edmonton?
- What two criteria must be balanced in a successful ERM model?
- Who is responsible for dealing with and mitigating risks?
- To what body must the City's strategic risks be reported?
NOTES
ABOUT THE CONTRIBUTOR
Ken Baker is ERM Program Manager for the City of Edmonton. He is responsible for developing and implementing a strategic ERM model for the city. In addition to strategic risk, he also liaises with other areas of risk management within Edmonton to find areas of commonality, to assist with project risk management, and to investigate standardization of operational risk management among city departments. Finally, he acts as mentor and subject matter expert for areas requesting ERM expertise, as well as implementation of risk management into other business planning models such as operating budgets, operating business plans, and capital plans.
Ken is a Certified Management Accountant (Alberta) and serves on the Finance Committee of the Risk and Insurance Management Society (RIMS). Prior to his work with the City of Edmonton, he was Controller at the Alberta Urban Municipalities Association, where ERM development was included in his mandate. He also held a number of accounting positions in Canada and Sweden. Ken has a bachelor of commerce degree from the University of Alberta School of Business.