
CHAPTER 18
Blue Wood Chocolates
STEPHEN MCPHIE, CA
Partner, RSD Solutions Inc.
RICK NASON, PHD, CFA
Partner, RSD Solutions Inc., and Associate Professor of Finance, Dalhousie University
This case highlights many issues around enterprise risk management (ERM). It concerns a company that has turned in a satisfactory performance in the past, although this has been a result, at least in part, of luck rather than design. There is a variety of risk and governance issues that can be discussed. They include prioritization of actions and implementation of an ERM framework when considering how to deal with a diversity of personalities and opinions.
BACKGROUND
Sally Holton, the newly appointed chief financial officer (CFO) of Blue Wood Chocolates, gazed from her office window at the sunny scene outside. Her mood was far from sunny, however, as she pondered what seemed like a mountain of urgent issues facing her. It seemed that there were no easy solutions to any of them.
Blue Wood Chocolates makes chocolate products at its plants in the Midwestern United States for sale domestically and internationally. The company has delivered a mixed financial performance over the past couple of years with volatility that management has not been able to explain, and that the board of directors and owners consider unsatisfactory. There has been an ongoing debate among board members as to whether the lackluster results are due to operations or the vagaries of the commodities markets.
When the long-serving CFO recently retired, Sally Holton was brought in as an outsider to replace him. Her appointment was controversial among some finance and treasury people in the company who expected an internal appointment. Several senior, long-serving, and experienced employees were thought to be well qualified for the role. However, the CEO, John Ferguson Junior, determined that it was an appropriate time to bring in an outsider with new ideas to shake up the finance and treasury functions. Quarterly results had been variable and unpredictable. Ferguson felt that the company needed a better planning process and had to improve its ability to explain its performance to shareholders, the board, and the banks. He considered the main problems the company faced to be due to poor reporting and presentation. Sally wondered whether the problems were more significant and fundamental. In any case, she knew that she needed to make an impression and make an impression fast.
Originally trained as an accountant and auditor working for one of the major accounting firms, Sally left accounting to work for a small mining company. That led to a job with an international mining conglomerate where she was promoted through various treasury and finance roles. Most recently, she had been responsible for managing commodity price and foreign currency risks. This was thought to position her well for dealing with Blue Wood's exposures to cocoa and sugar prices and foreign currencies. However, her new role was much broader than anything she had experienced before, and she soon realized that she had walked into a job that was going to be far more challenging than she had anticipated.
One of the first major projects Sally was tasked with was to present the latest quarterly results to the board at the end of her first month in the job. From brief conversations with some board members, she knew that they were concerned about the company's situation, and she had learned enough to know that she would have difficulty explaining the underlying reasons for the company's unsatisfactory financial position and recent performance shortfalls.
In the middle of her first week at the office, Sally received a call from Robert Klein, who was relationship manager at Blue Wood's lead bank. He introduced himself and they exchanged a few pleasantries, discovering that their kids attended the same high school, although in different grades. The conversation quickly turned to business. Robert said he was looking forward to working with Sally and seemed sympathetic about the wide-ranging tasks that he knew Sally faced. Unexpectedly, though, he jolted her by expressing his concern about Blue Wood's risk management practices and how this might be contributing to the company's unpredictable financial results. It wasn't just the weak financial results that were troubling; it was the volatility. He mentioned Blue Wood's inability to explain fluctuations adequately to the banks, and noted that the company had been very close to breaching its interest coverage covenant twice in the prior two years and looked like it would actually breach it in the current quarter. Robert was under pressure at his bank to take some form of action, including limiting or reducing exposure to Blue Wood and increasing margins and fees. He told Sally that he needed a report and plan addressing how Blue Wood was going to control and improve the volatility and unpredictability of its financial performance to present internally at his own bank, as well as to the other banks in the lending syndicate. He needed this very soon to determine what mitigating factors could be taken into account in this process.
Sally realized that her brief honeymoon in the new job was over and she needed to get to grips with the company's problems that appeared much more complex than she had been led to believe at the interview stage. She needed to formulate a comprehensive and detailed plan of action before being forced by the banks into taking certain measures that might not be in Blue Wood's best interests. She could certainly blame her predecessor for increased margins and fees on the bank financing, but she was determined to limit the extent of this by demonstrating how the company planned to improve controls, reporting, and, she hoped, financial performance.
Over the next few days, Sally spoke to as many executives in different areas of the company as possible. It became clear that there was little ongoing communication between major functions within the company. Areas like purchasing, operations, and sales did not coordinate or discuss current difficulties, future trends, and plans. They each made quarterly contributions to the business plan and got on with their business as they saw it. These contributions appeared manipulated to allow for adjustment when they were told to improve their targets. When plans were not met, which was most of the time, each area blamed the others and reporting was not adequate to identify reasons for shortcomings.
Worse still, the two cocoa purchasers did not get along and bad-mouthed each other to Sally. They were each pursuing their own purchasing strategies in isolation. The cocoa and sugar purchasing managers had discretion to use futures and options contracts as well as supply agreements to hedge quantities and prices of commodities, and they were doing this according to their views of the market and information about requirements from the production managers. The only restriction was that all contracts had to have a maximum maturity of one year.
Sally also spoke to two of the board members. Irene Dawson had been nominated to the board by one of the private equity funds that had a significant ownership stake in Blue Wood. She was not one for small talk, and appeared comfortable only when she had an Excel spreadsheet in front of her and a ruler in hand. She laid out a long list of detailed analysis and information she wanted Sally to provide to the board. Her fund wanted out of Blue Wood, but not at current values. Irene's mandate was to push Blue Wood to maximize value in the short term.
David Rennie represented a pension fund that had invested in Blue Wood. The fund saw its position as a long-term investment in a sector that promised steady growth, with Blue Wood well positioned to participate in this growth over time. The fund did see some current issues, but David considered these to be little more than a blip. In his view, management had a good grasp of the business and would soon be on top of things again. Each time Sally tried to discuss the business and the company's strategy, David was quick to steer the conversation in a different direction. He liked to be photographed with the board and attend publicity functions. He also appeared to have a weakness for chocolate, constantly feeding his not inconsiderable frame with the stuff. He bemoaned the fact that being a board member did not entitle him to a constant free supply of the company's product, although he offered the opinion that it was not nearly as good as some of the competitors' products.
Sally learned that discussions about the business plan and results at recent board meetings had degenerated into long and often heated discussions and disagreements about Blue Wood's business strategy and objectives. It seemed the arguments always circled back to the latest financial results.
In her two weeks between jobs, Sally had been reading a book about ERM frameworks and implementation guidance. The sections about the ISO 31000 framework seemed particularly interesting, but there was a variety of other risk management and financial approaches with differing levels of detail. As Sally pondered the results of her inquiries, it seemed to her that Blue Wood was sorely and urgently in need of such a framework. But which type of framework would be best for Blue Wood? And how should she go about applying this in practice? She even wondered if this would be a good time to try to implement such a system, with her being so new in her role. It would be a lot to explain to many people in a very short period of time in which she had to demonstrate competence.
She worried that if not done properly, implementing ERM would be seen as a bureaucratic exercise and resisted, or at least not applied usefully. How could it be more than a compilation of a list of risks, most of which were already known? Such a list would certainly be useful, as major risks were currently dealt with in different ways by different people and nobody had a big picture view of the company's risk profile. However, such a list would also be a static snapshot that would soon be out of date.
Upon further reflection, Sally wondered if she should set her sights lower and start by considering implementing a narrower form of financial risk management for the areas directly within her purview. She was certainly more confident of her abilities to understand what would be needed and how to do it. Perhaps a comprehensive ERM framework encompassing financial risk management would be too much to achieve and could even conflict with the financial risk management part.
THE COMPANY
Blue Wood is a midsize producer of bulk chocolate for use in other final products (e.g., candy bars, cereals, cookies, cakes, and desserts) and also has a small business supplying specialty private-label products to a variety of companies. The company has grown steadily from being a small local producer serving local retailers in its home state when it was founded 50 years ago to a midsized international company. However, growth has been unsteady, with many peaks and troughs along the way.
The company was founded by John Ferguson Senior, now in his mid-eighties. He named the company after a distinctive blue-painted barn that was on his family property and where he used to play as a child. Ferguson retains the role of chairman, but after a heart attack scare five years ago, he reluctantly passed the day-to-day running of the business to his son, John Ferguson Junior. Ferguson Senior is still a dominant and feared figure around the company. Much to the irritation of his son, he is frequently seen around the office questioning people about what they are doing and often berating them for one thing or another. At board meetings his approach is to steamroller any opposition. Woe betide the board member who has not got all his or her facts straight. He believes that the company should stick to its knitting, which brought success when he ran things, and is suspicious of what he considers “newfangled theories like ERM coming from schoolkids just out of diapers.”
Customers are retail businesses, distributors, and food processors that include chocolate in their final products. Around 75 percent of sales are to the domestic U.S. market. The main international customers are located in Canada (8 percent of sales), Mexico (3 percent), the United Kingdom (4 percent), and Eurozone countries (10 percent). Almost all of these sales are denominated in local currencies.
All production is carried out at the company's two plants in Illinois and Indiana. There are local subsidiaries with sales and accounting offices in Canada, Mexico, the United Kingdom, and Ireland that each have a small sales force, deal with distribution, and collect sales revenues. These offices retain amounts sufficient to cover local expenses, and the remainder is converted to U.S. dollars with local banks and remitted to the head office monthly. Any shortfall for local expenses, including expansion of distribution networks and promotional costs, is financed by short-term borrowings from local banks. These borrowings are guaranteed by the parent company.
Blue Wood sources cocoa beans from large producers in Brazil, Ecuador, Costa Rica, and the Dominican Republic, as well as U.S.-based importers. Other main ingredients used in manufacturing the company's products are sugar and milk, which are sourced from U.S. producers. More minor ingredients include nuts, raisins, lecithin (an emulsifier processed from cellular organisms, including soybean and sunflower oils), vanilla, and other flavorings. These are all sourced domestically. Purchases are denominated in U.S. dollars.
The company's facilities are considered to be in a good state of repair, although they are not up to the standards of the best state-of-the-art facilities used by some of the largest producers. In recent years, there has been no agreement at the board level about investing in new equipment, so excess cash has been paid out in dividends, which was in keeping with the short-term focus of most of the company's investors.
The workforce is unionized and had a history of good industrial relations until two years ago when there was a strike over a change in shift patterns imposed without consultation. The strike was settled after three days by awarding increased shift allowances to affected workers. By chance, inventories were at a high level due to overproduction, resulting from errors in the budgeting and planning processes. This resulted in the strike having no significant effect on customers. However, the unions have since been adopting a noticeably tougher stance in negotiations with management.
Blue Wood is privately owned by the founder, John Ferguson Senior, and family (20 percent), other senior employees (5 percent), a pension fund (20 percent), three private equity funds (15 percent each), and certain private investors (10 percent). The outside investors were brought in as the company needed cash to expand. The pension fund made its investment around 15 years ago. The private equity funds came in seven years ago as a group with the expectation that they would be able to exit through either sale of the company or an initial public offering (IPO) and bond issue within a maximum of five years. Projections were favorable and there was a plan to prepare the company for this outcome, including a focus on improving corporate governance and risk management as well as reinvesting funds in improved sales and production. However, implementation of the plan was halfhearted at best. Funds continued to be paid out in dividends rather than reinvested internally. Little was done on the governance and risk management side, and fairly weak financial performance precluded marketability of an IPO/bond issue as well as making any possible sale price highly unattractive for the fund managers. Additionally, the rating agencies had indicated that they would not be able to give Blue Wood a favorable rating under the current circumstances.
The private equity funds would like to exit their investment but consider that they would not receive full value. They are of the view that value could be substantially improved and are pushing for a strategy to maximize profitability in the short term. This could make the company a takeover target for a larger producer. However, the private equity funds are concerned about succession. They consider Ferguson Junior to be a weak CEO who is dominated by his father and unable to make major decisions without his father's approval.
The pension fund sees its investment as a long-term growth prospect and would like to see a stabilization and steady improvement in performance. It considers the steady and significant dividends paid by Blue Wood as a stable and important flow of cash, reflective of a good investment. The pension fund favors a conservative strategy with possible retrenchment in the domestic market and withdrawal from European markets that have not been profitable in the recent past.
Ferguson Junior is in his early sixties and would like to monetize the family holdings and retire. However, given Blue Wood's recent results, he does not believe the family would obtain full value for its holdings. He would face the additional difficulty of having to dispose of the family holdings “over his father's dead body.” Proud of his role in developing the company, he is frustrated that profitability has not been better and blames operating and financial staff for forays into new foreign markets and what he sees as fads like fair trade1 and organic products.
MARKET OVERVIEW
The chocolate market has experienced steady growth in recent years. North America and Western Europe still dominate, but growth has been very strong in the BRIC countries (Brazil, Russia, India, and China). Significant growth in the latter markets has the potential to cause supply shortages of cocoa and hence increasing prices. Brand loyalty, reinforced by advertising by major producers, is strong. Consumers often stick to their favorite brands, and chocolate has proven to be relatively recession proof.
In the traditional areas, where markets are saturated, emphasis has switched to differentiating products, with new flavor combinations and bolder health claims, as well as vegetarian, organic, and premium offerings. In the developing world, market growth is expected to mirror growth in personal disposable incomes.
There is a big seasonal boost in demand at Easter, in particular, and also at Christmas. Chocolate's popularity as a gift has increased. With more premium products available, it is a relatively cheap luxury item. This helps keep demand up in times of recession when people tend to forgo more expensive luxuries. As chocolate has a relatively long shelf life, online sales have been an avenue of growth. Unlike perishable food products, delivery times for online sales of chocolate are not a problem.
Major Competitive Factors
The market is dominated by a few large producers (e.g., Kraft, Hershey, Mars, and Nestlé) with advertising being a major driver. Barriers to entry are quite high, as new operations require major capital investment. Competition is strong in the premium segment, with less domination by large producers and better opportunities to set premium prices with brand recognition. However, the large producers are increasingly entering the premium segment and are also expected to acquire many of the small producers.
Brand recognition and reputation are important at the premium end of the market where chocolate is increasingly seen as having health benefits, and many craft producers have sprung up in recent years. This portion of the market is relatively small but growing.
Conversely, nonpremium products and desserts with higher sugar content are under attack from health professionals and governments concerned about health and obesity. Quality control is important—a brand can be ruined if an inferior batch enters the supply chain and causes mass sickness. As a food producer, Blue Wood is regulated by the U.S. Food and Drug Administration (FDA).
A further factor that is increasing in importance is a greater focus on the plight of cocoa farmers who receive only a tiny fraction of the retail price, as well as on the use of child labor in developing countries. In fact, few cocoa farmers are thought to have ever actually tasted the end product of their labors. Fair trade products have sprung up in recent years to salve consumers' consciences in this regard.
Selling prices are a factor for mainstream products. Not only can people switch to other chocolate brands, but there are many other candy, dessert, and snack food products around that they can select. At the premium end of the market, price competition is less of a factor than perception of quality and luxury based on product branding.
Cocoa prices depend on demand and supply and can be heavily affected by factors such as weather and politics. U.S. sugar prices are inflated compared to world prices due to market manipulation through price support for U.S. producers, domestic market controls that limit production by individual producers, and tariff rate quotas applied to sugar imports.2 This puts domestic chocolate manufacturers at a competitive disadvantage to foreign competitors. Prices have also been affected on occasion by speculators buying large positions of physical product or futures. Much of the world's supply comes from countries with a history of political instability, and this can cause (and has caused) supply disruptions.
Cocoa Markets Overview
Cocoa (or cacao) trees grow in a limited region approximately 20 degrees north and south of the equator. Around 70 percent of world production is grown in West Africa, with Ivory Coast and Ghana accounting for around 40 percent and 20 percent, respectively. Next is Indonesia with around 14 percent of world production. Cameroon, Nigeria, Brazil, and Ecuador are the next largest producers but with much smaller volumes.
Most cocoa is grown on small family farms. The farmers receive only a very small proportion of the international price of cocoa, and this has been falling in both absolute and real terms. Chocolate demand has been increasing steadily, helped by belief in its added health benefits. However, increasing attention is being paid in consuming countries to the poor conditions of the farmers and the use of child labor in cocoa farming. This has led to increasing sales of fair trade products.
Cocoa pods, which each contain 20 to 50 cocoa beans on average, are harvested from cocoa trees throughout the year and split open by hand (usually using a machete), and the beans are extracted along with the pulp. They are laid out for several days undergoing “sweating” when the pulp flows away. The beans are then taken to a facility where they are fermented and dried for four to seven days on trays or grates under the sun or artificial heat, after which the beans are trodden on and shuffled about (often with bare feet). Once dry, the beans can be shipped.
Beans are roasted and processed in factories to make final chocolate products. Once roasted, the beans are winnowed to remove their shells, leaving cocoa nibs. These are alkalized before, during, or after roasting to determine the color and taste of the cocoa. The nibs are then milled to create cocoa liquor consisting of cocoa particles suspended in cocoa butter in about equal quantities. The liquor is pressed to extract the cocoa butter, leaving cocoa press cake, which is processed into cocoa powder. Cocoa butter is used to make chocolate. Cocoa powder is used in making numerous dessert and confection products.
Although cocoa beans are perishable, they can be held in storage for several years. Consequently, cocoa can be traded as a commodity for profit and change ownership many times over its life.
Cocoa production is currently around 3.5 million metric tons annually and has been steadily increasing. Demand is expected to continue to grow and reach 4.5 million metric tons by 2020. Cocoa prices have been volatile. They reached a 27-year low of $714 per ton in November 2001 mainly due to favorable weather conditions in the Ivory Coast, and a 32-year high of $3,775 per ton in March 2011. High prices from 2006 to 2011 resulted from production deficits and disruption caused by the disputed presidential election in the Ivory Coast in November 2010.
Cocoa beans, cocoa butter, and cocoa powder spot and futures contracts are traded on the NYSE Euronext Exchange in London and the Intercontinental Exchange (ICE) in New York. Cocoa futures and options on futures are traded on the NYSE Euronext Exchange (pounds sterling) and New York ICE (U.S. dollars). Cocoa futures trading volume on the ICE was 4.95 million metric tons in 2011, 750,000 metric tons more than production. Trading volumes on the NYSE Euronext market have traditionally been higher than on ICE, but the gap has been closing. ICE has been known as the market for speculative trading. It is unusual for a commodity to be traded in two major currencies.
NYSE Euronext3 and ICE4 contracts are standardized in 10-ton sizes. Standard contracts specify that future delivery can be made in any of the months of March, May, July, September, and December with 10 future delivery months (i.e., two years) available for trading. However, liquidity falls off sharply beyond delivery months within the first year. Contracts representing product from all country origins can be traded, some at a discount or a premium. Delivery for ICE contracts is at certain U.S. East Coast ports. Delivery for London International Financial Futures and Options Exchange (LIFFE) contracts is at certain specified northern European ports in the Netherlands, the United Kingdom, Germany, Belgium, and northern France. Options on futures are also available for months between the futures delivery months.
Prices are affected by various factors, including weather, crop disease, political instability, availability and cost of fertilizers and pesticides, or withholding of stocks by producers and speculation.
An illustration of the latter point came in August 2002 when London-based Armajaro Holdings, a hedge fund run and cofounded by Anthony Ward, bought three quarters of the 204,380 metric tons of cocoa delivered through the Euronext.liffe exchange under futures contracts. Cocoa prices soared to a 15-year high. In mid-2010, Armajaro purchased 241,000 tons of cocoa beans representing 7 percent of annual global cocoa production (enough to manufacture 5.3 billion quarter-pound chocolate bars). This was the largest single cocoa trade in 14 years and caused prices to rise to a 33-year high. Armajaro had closed its position by the end of the year. Anthony Ward is based in London and started out as a motorcycle dispatch rider before becoming a commodities trader at a series of well-known trading companies specializing in cocoa and coffee. City of London traders are rumored to have nicknamed him “Chocfinger.” He has amassed a considerable personal fortune and lives in a highly expensive area of London.
Exhibit 18.1 shows world cocoa prices from January 1990 to July 2013.
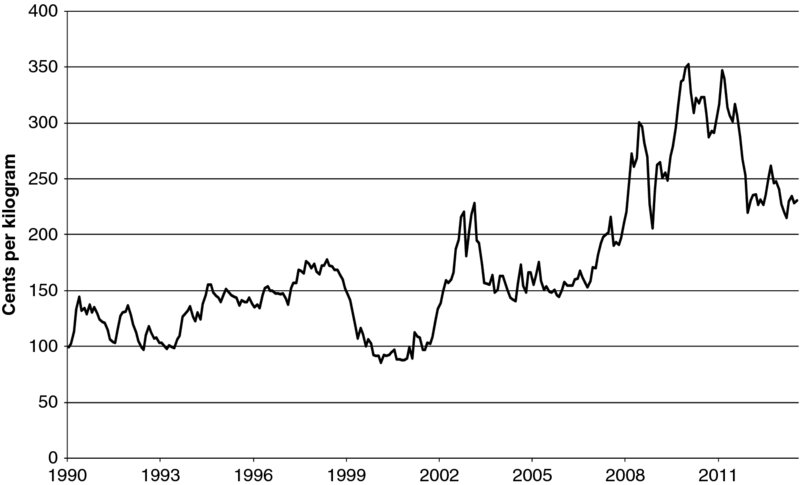
Exhibit 18.1 Cocoa Prices, 1990–2013 (Daily Average)
Source: International Cocoa Organization Secretariat; World Bank.
Sugar Markets Overview
Global sugar production for 2013/2014 is forecast at 175 million metric tons,5 very slightly up from the previous year, of which the United States accounts for around eight million metric tons, about 5 percent down from the previous year. Supply has grown steadily from 144 million metric tons produced in 2008/2009. The United States is both the fifth-largest producer and the fifth-largest consumer of sugar. Over the same period, demand grew from 153 million metric tons in 2008/2009 to 167 million metric tons forecast in 2013/2014 (i.e., from a supply shortfall to a surplus).
Exhibit 18.2 shows world and U.S. monthly sugar prices from January 1990 to July 2013. U.S. consumers pay substantially more than world prices for sugar, as the U.S. market is manipulated through price support, domestic market controls, and tariff rate quotas. Better growing conditions and hence cheaper costs of sugar in other producing countries would make U.S. producers struggle to survive without such support. Opposition to support, especially among beverage makers, has been increasing in recent years, and both producers and consumers have substantially increased their political contributions and lobbying efforts.
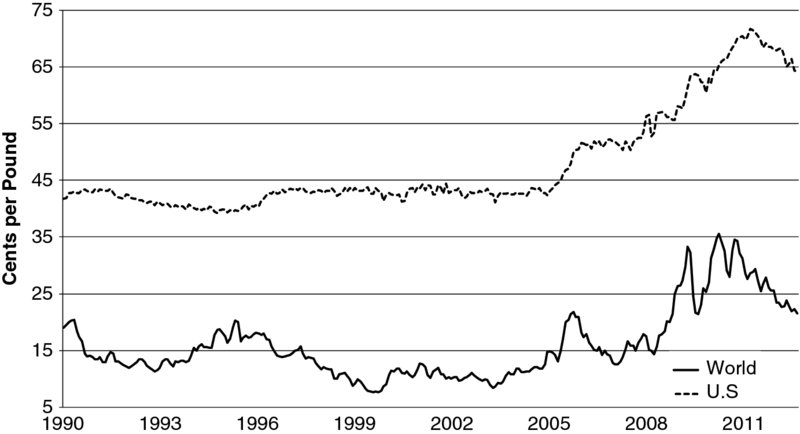
Exhibit 18.2 Sugar Prices, 1990–2013 (World and U.S. Monthly)
World source: London International Financial Futures and Options Exchange (LIFFE); U.S. source: Bureau of Labor Statistics.
Price Support
The U.S. Department of Agriculture (USDA) makes loans to producers who can either sell their product to the USDA at the minimum price to repay their loans or to the market if prices are higher. In attempting to avoid anticipated minimum price purchases, the USDA is often an active participant in sugar markets. It recently purchased 15.5 million metric tons of sugar from U.S. producers to bolster low market prices. In 2013, around $1.1 billion of loans were made to 17 producers representing about half of the country's producers.
Domestic Market Controls
Producers are each allotted maximum sales volumes each year. Excess production must be stored until permission is given to sell it in the future. Aggregate allotments must amount to at least 85 percent of anticipated demand.
Tariff Rate Quotas
Tariff rate quotas are used as a strict control on sugar imports. The USDA establishes quota volumes annually for sugar that can enter at low or zero duty. There is a minimum quota of around 1.1 million tons to satisfy U.S. obligations to the World Trade Organization. This can be increased if shortfalls of domestic production versus demand are expected.
Milk Markets Overview
Milk has suffered a long-term decline in consumption since its peak in World War II and has fallen by over 30 percent since 1975. Much of the decline has been offset by increased sales of yogurt, cheese, and other dairy products. The industry has endeavored to combat the decline in milk consumption with measures such as convenient packaging and healthy brands with protein additives. The decline can be attributed, partly at least, to factors such as a lower proportion of children in the population, price increases due to increasing costs of grains fed to cows, and milk no longer being seen as healthy as it once was.
The milk industry is around the size of corn production and second only to beef in the livestock industry. Milk is produced in all 50 states, mostly on family farms that are generally members of cooperatives. The cooperatives collect the milk and deliver it to processors and manufacturers. Dairy farms have been reducing in number and increasing in size, with higher output per cow more than offsetting fewer cows.
As with sugar, the U.S. milk market is heavily regulated and manipulated. There have been federal and state dairy programs since the 1930s, with subsequent programs added and discontinued over the years with changing market conditions. There are a number of reasons for the existence of such programs. These include the fact that milk is a highly perishable product that must be harvested daily, while quantities produced can vary daily according to the weather and feeding conditions. At the same time, consumption can also vary daily due to consumer shopping patterns.
The two main federal programs are the price support program and the system of milk marketing orders. Under the former, the Commodity Credit Corporation purchases manufactured products like butter and cheese, but not milk, at specified support prices and can sell at prices at least 10 percent above the purchase prices. The marketing orders are intended to establish orderly market conditions by setting the relationship between fluid and manufactured dairy products and a geographic price structure. There is also a program to provide income stabilization payments to producers.
Exhibit 18.3 shows U.S. milk prices from January 1995 to August 2013.

Exhibit 18.3 U.S. Milk Prices, 1995–2013
Source: U.S. Department of Agriculture.
BLUE WOOD FINANCIAL PERFORMANCE
Sally Holton examined Blue Wood's recent results and these are summarized in Appendix I. She could not find many comparable U.S. companies with published financial results. The only ones she could find that were vaguely comparable were The Hershey Company and Rocky Mountain Chocolate Factory, Inc., although these companies were of significantly different scale and scope of operations. Their results are summarized in Appendixes II and III, respectively.
The first things Sally noted were that almost all of Blue Wood's profitability measures were significantly worse than those of Hershey and Rocky Mountain. Sales growth had been sluggish compared with the others, and Blue Wood's gross margin was substantially lower. Moreover, Blue Wood's gross margin was quite volatile. Sally determined that the largest factor causing this volatility was gains, losses, and changes in the fair value of commodity derivatives. The one favorable comparison was selling, general, and administrative (SG&A) expenses.
Discussions with the sales department convinced Sally that the main problem was on the production side, although a drop in sales in the first half of 2013 was worrying. She had been shown correspondence from customers complaining about unreliability of delivery schedules and returns of substandard product due to poor quality control. The sales and marketing department had also provided market research showing that Blue Wood's published selling prices were broadly in line with those of competitors, although she suspected that discounts might shine a slightly less favorable light on the situation.
Blue Wood's cash position had been deteriorating over the periods Sally examined. A healthy cash balance had disappeared and the company was now borrowing under the bank revolver line. Retained earnings had also been falling. Part of this was due to the high dividend payments, particularly in 2012.
Sally noted that Blue Wood's long-term debt, both the senior notes and the bank term loan, were to mature in two years' time. Scheduled reductions of the bank loan had started in 2012. No consideration had been given as to how these may be repaid or refinanced, nor did anyone seem particularly concerned. The CEO, John Ferguson Junior, was confident that the bank would support the company. It had always done so in the past, and he and the bank's chairman were members of the same golf club. He did refer to the bank's chairman in rather colorful language that was not particularly respectful of the latter's intelligence.
On the plus side, Blue Wood had built up a significant balance of investments amounting to around $56 million at the end of June 2013. Sally was informed that this was to enable future payments of dividends in case cash flow was insufficient. These investments were not available to be used in the business. The investments consisted of stocks, bonds, exchange-traded funds, and some investments in private companies. Sally could find little information on the last of these. There was no company policy regarding management monitoring of investments. Funds were managed and invested upon the recommendation of the chairman's personal broker. His recommendations had always been followed without exception.
Sally had also learned from speaking to internal counsel that Blue Wood faced a possible $10 million lawsuit from parents of a child who had suffered from severe poisoning after eating one of the company's products. The parents claimed that the child has had difficulty concentrating and learning and has also become incontinent since eating the chocolate. Counsel considered the lawsuit frivolous and recommended resisting it or, at most, offering a small settlement to make it go away without accepting liability and while insisting upon confidentiality. He did agree with Sally that, regardless of the merits of the case, there could be significant adverse publicity if it went to a jury trial, and the result could be a bit of a lottery. When Sally mentioned the potential lawsuit to the CEO, he said he had not heard of it, but was happy to concentrate on running the business while counsel took care of such legal things.
Sally also found that certain foreign exchange futures had been transacted by the previous CFO to hedge his estimate of 50 percent of exposure to Canadian dollars (CAD), euros (EUR), and pounds sterling (GBP) over a one-year horizon. His estimates were essentially back-of-the-envelope approximations and appeared to have little relation to reality. Moreover, some of the local offices had also entered forward contracts with local banks that duplicated what the previous CFO had done. Exhibit 18.4 shows historical exchange rates for CAD, EUR, GBP, and MXN (Mexican peso) against the U.S. dollar. Note: MXN is divided by 10 for scaling to fit the graph.
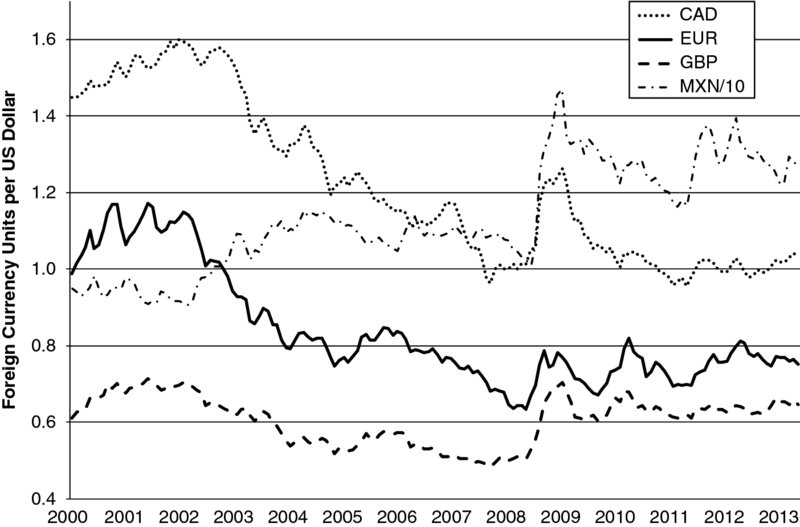
Exhibit 18.4 Exchange Rates
Source: www.oanda.com.
CONCLUSION
Sally Holton felt she had walked into a hornet's nest in her new position as CFO of Blue Wood Chocolates. The business was underperforming, and urgent action was required to respond to pressure from the banks and provide an action plan to the board of directors. There was disagreement among senior executives and board members about the strategy and overall objectives the company should pursue, and nobody had a grasp of all major risk factors. There was no oversight of the hedging practices and little effective internal communication among various functions, or even within some of the functions.
Sally needed to have an overall view of the corporate objectives before developing and implementing specific operating procedures. She needed to get a grasp on the major risks facing the company so that she could develop appropriate responses to these risks. An ERM framework seemed appropriate. However, this would need buy-in from the top, specifically the CEO, chairman, and the board. She needed to develop an overarching proposal incorporating objectives, strategy, and an ERM outline framework for presentation to the board. She would first need to get the CEO on board, not an easy task given his disinterest in what he considers bureaucratic matters that he hires people like Sally to deal with. The CEO's domination by his father, the chairman, would also likely be an obstacle.
Operational procedures, including commodity and currency hedging, would be important but would need to be developed within an overall ERM framework. It was time for Sally to get to work. She also needed to determine how financial performance could be improved. Profitability seemed lackluster, with a high expense base and no real control on major purchasing inputs. Revenues had held up fairly well but could be under competitive threat if margins continued to fall below the industry average.
Overhanging all other issues was the debt maturity profile. Both the senior notes and the bank term loan had maturity dates falling in mid-2014. No planning or discussion had taken place about how to repay and/or refinance these facilities, and the banks were already indicating dissatisfaction with Blue Wood.
APPENDIX I: BLUE WOOD CHOCOLATES
| STATEMENTS OF INCOME AND RETAINED EARNINGS | ||||||
| 6 Mos to June 30 | Year to December 31 | |||||
| ($000's) | 2013 | 2012 | 2012 | 2011 | 2010 | 2009 |
| Sales | 95,188 | 97,760 | 244,387 | 236,669 | 231,755 | 221,925 |
| Cost of sales | 62,421 | 66,109 | 163,169 | 166,307 | 153,671 | 142,294 |
| Gross profit | 32,767 | 31,651 | 81,218 | 70,362 | 78,084 | 79,631 |
| Selling, general, and administrative expenses | 29,202 | 28,227 | 60,596 | 58,123 | 57,252 | 56,113 |
| Income before interest and income taxes | 3,565 | 3,424 | 20,622 | 12,239 | 20,832 | 23,518 |
| Impairment charge | 0 | 0 | 0 | 0 | 0 | (6,222) |
| Interest & other income | 1,409 | 1,035 | 1,582 | 1,059 | 3,715 | 933 |
| Interest expense | (6,000) | (6,000) | (12,000) | (12,000) | (12,000) | (12,000) |
| Income before income taxes | (1,026) | (1,541) | 10,204 | 1,298 | 12,547 | 6,229 |
| Provision for income taxes | (308) | (462) | 3,061 | 390 | 3,764 | 1,869 |
| Net income | (718) | (1,079) | 7,143 | 908 | 8,783 | 4,360 |
| Retained earnings start of period | 40,401 | 54,471 | 54,471 | 61,723 | 60,975 | 64,522 |
| Dividends | (4,187) | (4,128) | (21,213) | (8,160) | (8,035) | (7,907) |
| Retained earnings end of period | 35,496 | 49,264 | 40,401 | 54,471 | 61,723 | 60,975 |
| Gains/(losses) on derivatives included in income statement | (370) | (211) | (259) | (3,523) | 2,072 | 207 |
| FINANCIAL RATIOS | ||||||
| 6 Mos to June 30 | Year to December 31 | |||||
| 2013 | 2012 | 2012 | 2011 | 2010 | 2009 | |
| Sales growth | −2.6% | 3.3% | 2.1% | 4.4% | ||
| Gross margin | 34.4% | 32.4% | 33.2% | 29.7% | 33.7% | 35.9% |
| SG&A expense growth | 3.5% | 4.3% | 1.5% | 2.0% | ||
| SG&A/Sales | 30.7% | 28.9% | 24.8% | 24.6% | 24.7% | 25.3% |
| Operating margin | 3.7% | 3.5% | 8.4% | 5.2% | 9.0% | 10.6% |
| EBITDA/Interest coverage | 1.3 | 1.3 | 2.5 | 1.7 | 2.4 | 2.8 |
| Debt/Equity | 2.0 | 1.7 | 1.9 | 1.7 | 1.5 | 1.5 |
| Current ratio | 1.8 | 2.0 | 1.8 | 2.4 | 3.3 | 3.3 |
| STATEMENTS OF CASH FLOWS | ||||||
| 6 Mos to June 30 | Year to December 31 | |||||
| ($000's) | 2013 | 2012 | 2012 | 2011 | 2010 | 2009 |
| Operating Activities | ||||||
| Net Income | (718) | (1,079) | 7,143 | 908 | 8,783 | 4,360 |
| Adjustments for noncash items | 5,212 | 4,977 | 10,474 | 9,195 | 8,508 | 10,141 |
| Changes in operating assets and liabilities | (1,276) | 736 | 9,547 | (4,469) | 2,705 | 1,049 |
| Cash from operations | 3,218 | 4,634 | 27,164 | 5,634 | 19,996 | 15,550 |
| Investing Activities | ||||||
| Additions to property, plant, and equipment | (2,649) | (2,388) | (3,949) | (7,267) | (5,695) | (9,258) |
| Net purchases of trading securities | (1,008) | (963) | (1,331) | (1,437) | (1,290) | (761) |
| Purchase of available for sale securities | (8,441) | (8,920) | (17,340) | (7,445) | (4,134) | (5,036) |
| Sale and maturity of available for sale securities | 8,236 | 1,375 | 4,649 | 3,413 | 3,648 | 7,783 |
| Net cash used in investing activities | (3,862) | (10,896) | (17,971) | (12,736) | (7,471) | (7,272) |
| Financing Activities | ||||||
| Bank term loan repayments | (5,000) | (5,000) | (5,000) | 0 | 0 | 0 |
| Dividends paid | (2,111) | (4,123) | (23,303) | (8,181) | (8,058) | (7,922) |
| Net cash use in financing activities | (7,111) | (9,123) | (28,303) | (8,181) | (8,058) | (7,922) |
| Net increase/(decrease) in cash | (7,755) | (15,385) | (19,110) | (15,283) | 4,467 | 356 |
| Opening (bank revolver)/Cash | (2,278) | 16,832 | 16,832 | 32,115 | 27,648 | 27,292 |
| Closing (bank revolver)/Cash | (10,033) | 1,447 | (2,278) | 16,832 | 32,115 | 27,648 |
| BALANCE SHEETS | ||||||
| 6 Mos to June 30 | Year to December 31 | |||||
| ($000's) | 2013 | 2012 | 2012 | 2011 | 2010 | 2009 |
| ASSETS | ||||||
| Current Assets | ||||||
| Cash and cash equivalents | 0 | 1,447 | 0 | 16,832 | 32,115 | 27,648 |
| Investments | 11,052 | 5,698 | 8,332 | 4,842 | 3,554 | 3,850 |
| Receivables | 17,905 | 10,358 | 20,513 | 17,375 | 15,320 | 15,318 |
| Prepaid expenses and other receivables | 2,352 | 2,319 | 2,457 | 2,935 | 7,396 | 3,732 |
| Inventory Finished goods and WIP | 30,984 | 27,941 | 16,465 | 18,967 | 15,740 | 15,809 |
| Raw materials | 13,263 | 14,716 | 11,261 | 12,926 | 9,438 | 8,854 |
| Deferred income tax | 2,193 | 257 | 207 | 257 | 306 | 608 |
| Prepayments and other | 987 | 2,568 | 1,844 | 2,253 | 2,888 | 7,391 |
| Total Current Assets | 78,736 | 65,304 | 61,079 | 76,387 | 86,757 | 83,210 |
| Property, plant, and equipment at cost | 208,144 | 204,680 | 206,101 | 202,265 | 195,988 | 190,043 |
| Less accumulated depreciation | (120,368) | (112,348) | (116,639) | (107,971) | (100,214) | (91,945) |
| Net property, plant, and equipment | 87,776 | 92,332 | 89,462 | 94,294 | 95,774 | 98,098 |
| Goodwill and trademarks | 80,338 | 80,338 | 80,338 | 80,338 | 80,338 | 80,338 |
| Investments | 45,000 | 41,062 | 45,416 | 32,739 | 28,650 | 25,838 |
| Split dollar life insurance | 18,400 | 31,357 | 29,737 | 32,982 | 33,085 | 33,174 |
| Equity method investments | 721 | 1,453 | 945 | 1,749 | 1,891 | 2,205 |
| Deferred income tax | 2,634 | 3,432 | 2,765 | 3,429 | 4,090 | 5,147 |
| Total Assets | 313,605 | 315,278 | 309,742 | 321,918 | 330,585 | 328,010 |
| LIABILITIES AND STOCKHOLDERS' EQUITY | ||||||
| Current Liabilities | ||||||
| Bank revolver | 10,033 | 0 | 2,278 | 0 | 0 | 0 |
| Payables and accruals | 25,512 | 25,450 | 24,041 | 23,890 | 23,989 | 22,937 |
| Dividend payable | 2,121 | 2,095 | 0 | 2,046 | 2,013 | 1,981 |
| Current portion of bank term loan | 5,000 | 5,000 | 5,000 | 5,000 | 0 | 0 |
| Postretirement health care and life insurance | 247 | 255 | 247 | 255 | 0 | 0 |
| Accrued income taxes | 111 | 0 | 2,719 | 0 | 0 | 0 |
| Total Current Liabilities | 43,024 | 32,800 | 34,285 | 31,191 | 26,002 | 24,918 |
| Long-term debt—senior note 8% due 2014 | 100,000 | 100,000 | 100,000 | 100,000 | 100,000 | 100,000 |
| Bank term loan due 2014 | 35,000 | 40,000 | 40,000 | 45,000 | 50,000 | 50,000 |
| Postretirement health care and life insurance | 12,528 | 12,023 | 11,923 | 11,348 | 9,195 | 7,411 |
| Liability for uncertain tax positions | 3,672 | 3,369 | 3,496 | 3,709 | 4,371 | 8,199 |
| Deferred income taxes | 19,050 | 19,249 | 17,221 | 19,343 | 21,273 | 19,814 |
| Deferred compensation and other liabilities | 27,085 | 22,953 | 24,541 | 21,374 | 20,514 | 17,706 |
| Total Liabilities | 240,359 | 230,394 | 231,466 | 231,965 | 231,355 | 228,048 |
| Stockholders' Equity | ||||||
| Common stock and additional paid in capital | 44,000 | 44,000 | 44,000 | 44,000 | 44,000 | 44,000 |
| Retained earnings | 35,496 | 49,264 | 40,401 | 54,471 | 61,723 | 60,975 |
| Other comprehensive income/(loss) | (6,250) | (8,380) | (6,125) | (8,518) | (6,493) | (5,013) |
| Total Stockholders' Equity | 73,246 | 84,884 | 78,276 | 89,953 | 99,230 | 99,962 |
| Total Liabilities and Stockholders' Equity | 313,605 | 315,278 | 309,742 | 321,918 | 330,585 | 328,010 |
| STATEMENTS OF OTHER COMPREHENSIVE INCOME | ||||||
| 6 Mos to June 30 | Year to December 31 | |||||
| ($000's) | 2013 | 2012 | 2012 | 2011 | 2010 | 2009 |
| Other Comprehensive Income/(Loss) Net of Tax | ||||||
| Foreign currency translation | (45) | 152 | 579 | (1,109) | 380 | (487) |
| Pension and postretirement plans | ||||||
| Gains/(losses) | 0 | 0 | 474 | (1,597) | (1,393) | 811 |
| Reclassification to earnings | 0 | 0 | 460 | 223 | 57 | 328 |
| Unrealized gains/(losses) on investments | (80) | (14) | 880 | 458 | (524) | 1,207 |
| Total other comprehensive income net of tax | (125) | 138 | 2,393 | (2,025) | (1,480) | 1,859 |
| Opening other comprehensive income | (6,125) | (8,518) | (8,518) | (6,493) | (5,013) | (6,872) |
| Closing other comprehensive income | (6,250) | (8,380) | (6,125) | (8,518) | (6,493) | (5,013) |
| Derivatives included in OCI | ||||||
| Opening balance | (49) | 115 | 115 | 2,334 | 1,028 | 98 |
| Unrealized gain/(loss) | (770) | (86) | (151) | (176) | 3,250 | 1,929 |
| Reclassified to earnings | 400 | (125) | (108) | (3,347) | (1,178) | (451) |
| Net | (370) | (211) | (259) | (3,523) | 2,072 | 1,478 |
| Tax effect | 134 | 78 | 95 | 1,304 | (766) | (548) |
| Closing balance | (285) | (18) | (49) | 115 | 2,334 | 1,028 |
APPENDIX II: THE HERSHEY COMPANY
| CONSOLIDATED STATEMENTS OF INCOME AND RETAINED EARNINGS | ||||||
| 6 Months to | Year to December 31 | |||||
| June 30 | July 1 | |||||
| ($000's) | 2013 | 2012 | 2012 | 2011 | 2010 | 2009 |
| Sales | 3,335,940 | 3,146,508 | 6,644,252 | 6,080,788 | 5,671,009 | 5,298,668 |
| Cost of sales | 1,768,029 | 1,784,591 | 3,784,370 | 3,548,896 | 3,255,801 | 3,245,531 |
| Selling, general, and administrative expenses | 896,739 | 796,967 | 1,703,796 | 1,477,750 | 1,426,477 | 1,208,672 |
| Business realignment and impairment charges | 10,438 | 8,149 | 44,938 | (886) | 83,433 | 82,875 |
| Total costs and expenses | 2,675,206 | 2,589,707 | 5,533,104 | 5,025,760 | 4,765,711 | 4,537,078 |
| Income before interest and income taxes | 660,734 | 556,801 | 1,111,148 | 1,055,028 | 905,298 | 761,590 |
| Interest and other income | 1,413 | 1,350 | 2,940 | 2,597 | 1,270 | 877 |
| Interest expense | (46,140) | (49,718) | (98,509) | (94,780) | (97,704) | (91,336) |
| Income before income taxes | 616,007 | 508,433 | 1,015,579 | 962,845 | 808,864 | 671,131 |
| Provision for income taxes | 214,597 | 174,097 | 354,648 | 333,883 | 299,065 | 235,137 |
| Net income | 401,410 | 334,336 | 660,931 | 628,962 | 509,799 | 435,994 |
| Retained earnings start of period | 5,027,617 | 4,699,597 | 4,707,892 | 4,383,013 | 4,156,648 | 3,984,057 |
| Dividends | (182,895) | (167,094) | (341,206) | (304,083) | (283,434) | (263,403) |
| Retained earnings end of period | 5,246,132 | 4,866,839 | 5,027,617 | 4,707,892 | 4,383,013 | 4,156,648 |
| FINANCIAL RATIOS | ||||||
| 6 Months to | Year to December 31 | |||||
| June 30 | July 1 | |||||
| 2013 | 2012 | 2012 | 2011 | 2010 | 2009 | |
| Sales growth | 6% | 9% | 7% | 7% | ||
| Gross margin | 47% | 43% | 43% | 42% | 43% | 39% |
| SG&A expense growth | 13% | 15% | 4% | 18% | ||
| SG&A/Sales | 27% | 25% | 26% | 24% | 25% | 23% |
| Operating margin (excluding realign. & impair.) | 20% | 18% | 17% | 17% | 17% | 16% |
| EBITDA/Interest (excluding realign. & impair./including
capitalized interest) |
16.9 | 13.7 | 14.7 | 14.6 | 12.4 | 11.6 |
| Debt/Equity | 1.7 | 1.8 | 1.8 | 2.1 | 1.9 | 2.0 |
| Current ratio | 1.8 | 1.4 | 1.4 | 1.7 | 1.5 | 1.5 |
| Source: www.thehersheycompany.com/investors/financial-reports.aspx. | ||||||
| CONSOLIDATED STATEMENTS OF CASH FLOWS | ||||||
| 6 Months to | Year to December 31 | |||||
| ($000's) | June 30 2013 | July 1 2012 | 2012 | 2011 | 2010 | 2009 |
| Operating Activities | ||||||
| Net Income | 401,410 | 334,336 | 660,931 | 628,962 | 509,799 | 435,994 |
| Adjustments for noncash items | 60,127 | 114,940 | 234,364 | 270,762 | 260,926 | 178,671 |
| Changes in operating assets and liabilities | (112,091) | (135,118) | 199,532 | (311,857) | 130,698 | 451,084 |
| Net cash provided from operating activities | 349,446 | 314,158 | 1,094,827 | 587,867 | 901,423 | 1,065,749 |
| Investing Activities | ||||||
| Capital additions | (151,735) | (139,488) | (258,727) | (323,961) | (179,538) | (126,324) |
| Capitalized software additions | (6,854) | (8,319) | (19,239) | (23,606) | (21,949) | (19,146) |
| Proceeds from sale of property, plant and equipment | 15,107 | 76 | 453 | 312 | 2,201 | 10,364 |
| Proceeds from sale of trademark licensing rights | 0 | 0 | 0 | 20,000 | 0 | 0 |
| Loan to affiliate | (16,000) | (16,000) | (23,000) | (7,000) | 0 | 0 |
| Business acquisitions | 0 | (172,856) | (172,856) | (5,750) | 0 | (15,220) |
| Net Cash Used by Investing Activities | (159,482) | (336,587) | (473,369) | (340,005) | (199,286) | (150,326) |
| Financing Activities | ||||||
| Net (decrease)/increase in short-term debt | (13,624) | 95,130 | 77,698 | 10,834 | 1,156 | (458,047) |
| Long-term borrowings | 249,785 | 49 | 4,025 | 249,126 | 348,208 | 0 |
| Repayment of long-term debt | (250,143) | (2,134) | (99,381) | (256,189) | (71,548) | (8,252) |
| Proceeds from lease financing agreement | 0 | 0 | 0 | 47,601 | 0 | 0 |
| Cash dividends paid | (182,895) | (167,094) | (341,206) | (304,083) | (283,434) | (263,403) |
| Exercise of stock options | 114,157 | 185,600 | 261,597 | 184,411 | 92,033 | 28,318 |
| Excess tax benefits from stock-based compensation | 36,938 | 23,849 | 33,876 | 13,997 | 1,385 | 4,455 |
| Payments from/(to) noncontrolling interests | 1,470 | 1,470 | (12,851) | 0 | 10,199 | 7,322 |
| Repurchase of common stock | (305,564) | (218,345) | (510,630) | (384,515) | (169,099) | (9,314) |
| Net cash used by financing activities | (349,876) | (81,475) | (586,872) | (438,818) | (71,100) | (698,921) |
| Increase/(Decrease) in Cash and Equivalents | (159,912) | (103,904) | 34,586 | (190,956) | 631,037 | 216,502 |
| Opening cash and equivalents | 728,272 | 693,686 | 693,686 | 884,642 | 253,605 | 37,103 |
| Closing Cash & Equivalents | 568,360 | 589,782 | 728,272 | 693,686 | 884,642 | 253,605 |
| CONSOLIDATED BALANCE SHEETS | ||||||
| 6 Mos to | Year to December 31 | |||||
| June 30 | July 1 | |||||
| ($000's) | 2013 | 2012 | 2012 | 2011 | 2010 | 2009 |
| ASSETS | ||||||
| Current Assets | ||||||
| Cash and cash equivalents | 568,360 | 589,782 | 728,272 | 693,686 | 884,642 | 253,605 |
| Receivables—trade | 366,288 | 353,337 | 461,383 | 399,499 | 390,061 | 410,390 |
| Inventories | 778,988 | 791,805 | 633,262 | 648,953 | 533,622 | 519,712 |
| Deferred income taxes | 102,762 | 121,192 | 122,224 | 136,861 | 50,655 | 34,763 |
| Prepaid expenses | 182,489 | 237,457 | 168,344 | 167,559 | 141,132 | 161,859 |
| Total Current Assets | 1,998,887 | 2,093,573 | 2,113,485 | 2,046,558 | 2,000,112 | 1,380,329 |
| Property, plant, and equipment at cost | 3,650,777 | 3,564,028 | 3,560,626 | 3,588,558 | 3,324,763 | 3,242,868 |
| Less accumulated depreciation | (1,941,431) | (1,980,724) | (1,886,555) | (2,028,841) | (1,887,061) | (1,838,101) |
| Net property, plant, and equipment | 1,709,346 | 1,583,304 | 1,674,071 | 1,559,717 | 1,437,702 | 1,404,767 |
| Goodwill | 578,906 | 589,464 | 588,003 | 516,745 | 524,134 | 571,580 |
| Other intangibles | 202,495 | 219,028 | 214,713 | 111,913 | 123,080 | 125,520 |
| Deferred income taxes | 30,925 | 28,072 | 12,448 | 33,439 | 21,387 | 4,353 |
| Other assets | 176,309 | 154,531 | 152,119 | 138,722 | 161,212 | 183,377 |
| Total Assets | 4,696,868 | 4,667,972 | 4,754,839 | 4,407,094 | 4,267,627 | 3,669,926 |
| LIABILITIES AND STOCKHOLDERS' EQUITY | ||||||
| Current Liabilities | ||||||
| Accounts payable | 413,144 | 388,472 | 441,977 | 420,017 | 410,655 | 287,935 |
| Accrued liabilities | 564,080 | 569,902 | 650,906 | 612,186 | 593,308 | 546,462 |
| Accrued income taxes | 4,585 | 1,930 | 2,329 | 1,899 | 9,402 | 36,918 |
| Short-term debt | 99,081 | 139,356 | 118,164 | 42,080 | 24,088 | 24,066 |
| Current portion of long-term debt | 3,316 | 347,312 | 257,734 | 97,593 | 261,392 | 15,247 |
| Total Current Liabilities | 1,084,206 | 1,446,972 | 1,471,110 | 1,173,775 | 1,298,845 | 910,628 |
| Long-term debt | 1,794,493 | 1,498,669 | 1,530,967 | 1,748,500 | 1,541,825 | 1,502,730 |
| Other long-term liabilities | 663,519 | 608,664 | 668,732 | 603,876 | 481,061 | 487,934 |
| Deferred income taxes | 32,923 | 27,696 | 35,657 | 0 | 0 | 0 |
| Total Liabilities | 3,575,141 | 3,582,001 | 3,706,466 | 3,526,151 | 3,321,731 | 2,901,292 |
| Stockholders' Equity | ||||||
| Common stock and additional paid-in capital | 987,292 | 917,293 | 952,876 | 850,718 | 794,766 | 754,579 |
| Retained earnings | 5,246,132 | 4,866,839 | 5,027,617 | 4,707,892 | 4,383,013 | 4,156,648 |
| Treasury common stock at cost | (4,740,944) | (4,324,278) | (4,558,668) | (4,258,962) | (4,052,101) | (3,979,629) |
| Accumulated other comprehensive loss | (380,658) | (395,527) | (385,076) | (442,331) | (215,067) | (202,844) |
| Noncontrolling interests in subsidiaries | 9,905 | 21,644 | 11,624 | 23,626 | 35,285 | 39,880 |
| Total Stockholders' Equity | 1,121,727 | 1,085,971 | 1,048,373 | 880,943 | 945,896 | 768,634 |
| Total Liabilities and Stockholders' Equity | 4,696,868 | 4,667,972 | 4,754,839 | 4,407,094 | 4,267,627 | 3,669,926 |
| Note: 2009 and 2010 as restated. | ||||||
| CONSOLIDATED STATEMENTS OF OTHER COMPREHENSIVE INCOME | ||||||
| 6 Months to | Year to December 31 | |||||
| June 30 | July 1 | |||||
| ($000's) | 2013 | 2012 | 2012 | 2011 | 2010 | 2009 |
| Other Comprehensive Income/(Loss) Net of Tax | ||||||
| Foreign currency translation | (18,981) | 1,662 | 7,714 | (21,213) | 14,123 | 38,302 |
| Pension and postretirement plans | 13,621 | 12,608 | (9,634) | (85,823) | 5,130 | 38,643 |
| Cash flow hedges | ||||||
| Gains/(losses) on derivatives | 4,010 | (769) | (868) | (107,713) | 1,001 | 78,257 |
| Reclassification adjustments | 5,768 | 33,303 | 60,043 | (12,515) | (32,477) | 1,862 |
| Total other comprehensive income net of tax | 4,418 | 46,804 | 57,255 | (227,264) | (12,223) | 157,064 |
| Opening Other Comprehensive Income | (385,076) | (442,331) | (442,331) | (215,067) | (202,844) | (359,908) |
| Closing Other Comprehensive Income | (380,658) | (395,527) | (385,076) | (442,331) | (215,067) | (202,844) |
APPENDIX III: ROCKY MOUNTAIN CHOCOLATE FACTORY, INC.
| CONSOLIDATED STATEMENTS OF INCOME AND RETAINED EARNINGS | |||||||||||
| 3 Months to | |||||||||||
| May 31 | Year to February 28 | ||||||||||
| ($000's) | 2013 | 2012 | 2013 | 2012 | 2011 | 2010 | |||||
| Revenues | 10,178 | 9,658 | 36,315 | 34,627 | 31,128 | 28,437 | |||||
| Cost of sales | 5,027 | 5,022 | 18,955 | 18,309 | 16,228 | 14,911 | |||||
| Other costs and expenses | 3,333 | 3,013 | 12,174 | 10,465 | 8,950 | 7,883 | |||||
| Loss on asset sales and restructuring charges | 0 | 0 | 2,647 | 0 | 0 | 0 | |||||
| Total Costs and expenses | 8,360 | 8,035 | 33,776 | 28,774 | 25,178 | 22,794 | |||||
| Income before interest and income taxes | 1,818 | 1,623 | 2,539 | 5,853 | 5,950 | 5,643 | |||||
| Interest and other income | 12 | 11 | 44 | 59 | 59 | 27 | |||||
| Income before income taxes | 1,830 | 1,634 | 2,583 | 5,912 | 6,009 | 5,670 | |||||
| Income tax expense | 584 | 571 | 1,233 | 2,036 | 2,098 | 2,090 | |||||
| Net income after income taxes | 1,246 | 1,063 | 1,350 | 3,876 | 3,911 | 3,580 | |||||
| Attributable to noncontrolling interest | (67) | 0 | 128 | 0 | 0 | 0 | |||||
| Net income attributable to RMCF | 1,179 | 1,063 | 1,478 | 3,876 | 3,911 | 3,580 | |||||
| Retained earnings start of period | 8,642 | 9,838 | 9,838 | 8,412 | 6,924 | 5,751 | |||||
| Dividends | (668) | (676) | (2,674) | (2,450) | (2,423) | (2,407) | |||||
| Retained earnings end of period | 9,153 | 10,225 | 8,642 | 9,838 | 8,412 | 6,924 | |||||
| Source: www.irdirect.net/RMCF/sec_filings/view. | |||||||||||
| FINANCIAL RATIOS | ||||||||||
| 3 Months to | ||||||||||
| May 31 | Year to February 28 | |||||||||
| 2013 | 2012 | 2013 | 2012 | 2011 | 2010 | |||||
| Sales growth | 5% | 5% | 11% | 9% | ||||||
| Gross margin | 51% | 48% | 48% | 47% | 48% | 48% | ||||
| Other costs and expense growth | 11% | 16% | 17% | 14% | ||||||
| Other costs and expenses/sales | 33% | 31% | 34% | 30% | 29% | 28% | ||||
| Operating margin (excluding loss on asset sales
and restructuring charges) |
18% | 17% | 14% | 17% | 19% | 20% | ||||
| EBITDA/Interest | n/a | n/a | n/a | n/a | n/a | n/a | ||||
| Debt/Equity | n/a | n/a | n/a | n/a | n/a | n/a | ||||
| Current ratio | 3.2 | 4.7 | 2.6 | 4.0 | 3.7 | 3.7 | ||||
| CONSOLIDATED CASH FLOW STATEMENTS | ||||||||||
| 3 Months to | ||||||||||
| May 31 | Year to February 28 | |||||||||
| ($000's) | 2013 | 2012 | 2013 | 2012 | 2011 | 2010 | ||||
| Operating Activities | ||||||||||
| Net Income | 1,179 | 1,062 | 1,478 | 3,876 | 3,911 | 3,580 | ||||
| Adjustments for noncash items | 409 | 406 | 2,767 | 2,409 | 1,569 | 1,187 | ||||
| Changes in operating assets and liabilities | (776) | 663 | 2,126 | (138) | (1,685) | 767 | ||||
| Net cash provided by operating activities | 812 | 2,131 | 6,371 | 6,147 | 3,795 | 5,534 | ||||
| Investing Activities | ||||||||||
| Additions to property, plant, and equipment | (58) | (253) | (743) | (3,261) | (1,298) | (499) | ||||
| Proceeds from sale or distribution of assets | 3 | 0 | 889 | 53 | 19 | 117 | ||||
| Franchising rights | 0 | 0 | (802) | 0 | 0 | 0 | ||||
| Other | (59) | 21 | (320) | 85 | (518) | (260) | ||||
| Net cash used in investing activities | (114) | (232) | (976) | (3,123) | (1,797) | (642) | ||||
| Financing Activities | ||||||||||
| Dividends paid | (668) | (616) | (2,623) | (2,441) | (2,418) | (2,403) | ||||
| Tax benefit of stock option exercise | 20 | 6 | 58 | 25 | 11 | 0 | ||||
| (Repurchase)/Issue of common stock | 0 | (363) | (1,633) | 173 | 10 | 0 | ||||
| Net cash used in financing activities | (648) | (973) | (4,198) | (2,243) | (2,397) | (2,403) | ||||
| Net Increase/(Decrease) in Cash and Equivalents | 50 | 926 | 1,197 | 781 | (399) | 2,489 | ||||
| Opening Cash and Equivalents | 5,322 | 4,125 | 4,125 | 3,344 | 3,743 | 1,254 | ||||
| Closing Cash and Equivalents | 5,372 | 5,051 | 5,322 | 4,125 | 3,344 | 3,743 | ||||
| CONSOLIDATED BALANCE SHEETS | ||||||
| May 31 | February 28 | |||||
| ($000's) | 2013 | 2012 | 2013 | 2012 | 2011 | 2010 |
| ASSETS | ||||||
| Current Assets | ||||||
| Cash and cash equivalents | 5,372 | 5,051 | 5,322 | 4,125 | 3,344 | 3,743 |
| Receivables | 3,413 | 3,488 | 4,113 | 4,362 | 5,194 | 4,519 |
| Inventory | 4,175 | 3,744 | 4,221 | 4,119 | 4,125 | 3,281 |
| Deferred tax | 644 | 677 | 629 | 1,212 | 565 | 461 |
| Prepayments and other | 658 | 741 | 259 | 281 | 279 | 220 |
| Total current assets | 14,262 | 13,701 | 14,544 | 14,099 | 13,507 | 12,224 |
| Property, plant and equipment at cost | 17,571 | 18,004 | 17,490 | 17,835 | 15,254 | 13,797 |
| Less accumulated depreciation | (10,942) | (9,552) | (10,713) | (9,319) | (8,978) | (8,610) |
| Net property, plant, and equipment | 6,629 | 8,452 | 6,777 | 8,516 | 6,276 | 5,187 |
| Goodwill | 1,047 | 1,047 | 1,047 | 1,047 | 1,047 | 1,047 |
| Other intangibles | 800 | 20 | 801 | 22 | 59 | 110 |
| Other assets | 733 | 457 | 665 | 479 | 550 | 352 |
| Total Assets | 23,471 | 23,677 | 23,834 | 24,163 | 21,439 | 18,920 |
| LIABILITIES AND STOCKHOLDERS' EQUITY | ||||||
| Current Liabilities | ||||||
| Payables | 1,246 | 924 | 1,999 | 1,356 | 1,541 | 878 |
| Accruals and deferred income | 2,538 | 1,314 | 2,897 | 1,570 | 1,528 | 1,814 |
| Dividend payable | 669 | 676 | 668 | 616 | 607 | 603 |
| Total Current Liabilities | 4,453 | 2,914 | 5,564 | 3,542 | 3,676 | 3,295 |
| Deferred income taxes | 859 | 1,862 | 882 | 1,885 | 1,109 | 894 |
| Total Liabilities | 5,312 | 4,776 | 6,446 | 5,427 | 4,785 | 4,189 |
| Stockholders' Equity | ||||||
| Common stock and additional paid in capital | 7,905 | 8,676 | 7,741 | 8,898 | 8,242 | 7,807 |
| Retained earnings | 9,153 | 10,225 | 8,642 | 9,838 | 8,412 | 6,924 |
| Noncontrolling interest | 1,101 | 0 | 1,005 | 0 | 0 | 0 |
| Total Stockholders' Equity | 18,159 | 18,901 | 17,388 | 18,736 | 16,654 | 14,731 |
| Total Liabilities and Stockholders' Equity | 23,471 | 23,677 | 23,834 | 24,163 | 21,439 | 18,920 |
QUESTIONS
The following questions are intended to guide discussion about Blue Wood and how such a company can face up to and deal with issues of risk management throughout the enterprise. The questions are not necessarily exhaustive for the case and it is intended that examination and discussion can be developed further if desired.
Discussion can center on the importance of culture within an organization, how to change it, how to set priorities, how much is possible and how fast, as well as the related costs and benefits.
- What are the prospects and consequences for Blue Wood if it carries on the way it has been?
- Are corporate objectives and strategy important and if so, why?
- Discuss why and how either an FRM (financial risk management) or an ERM framework might benefit a company like Blue Wood.
- What are the main challenges in developing and implementing a risk management framework for Blue Wood? How does the ownership structure affect these challenges?
- If the company is to develop a risk management framework, who should lead the process? Should a Chief Risk Officer (CRO) be appointed? If so, to whom should he/she report and have access to? How could smaller companies without the resources for a dedicated CRO deal with ERM? What is the role for the board in such a process?
- Should Blue Wood hedge its exposures to commodities and foreign currencies? If so, how should it go about hedging; for example, in terms of:
- managing, monitoring, and evaluating the hedging program
- amounts hedged
- time horizon of the hedges
- instruments used
- budget for option premiums
- accounting and reporting the hedging program
- Are there other areas where Blue Wood should consider a risk management program?
NOTES
ABOUT THE CONTRIBUTORS
Stephen McPhie, CA, in his current position as partner of RSD Solutions Inc., advises businesses internationally on various aspects of financial strategy and risk mitigation. From 2000 to 2004, Stephen worked in London for Italy's largest bank. In the financial engineering group, he successfully created innovative cross-border financing structures that included private equity instruments with embedded derivatives. Previously he structured and distributed primary market debt and traded distressed and near-par debt in secondary markets. Prior to 2000, Stephen held various positions in the United States, Canada, and the United Kingdom with a “big five” Canadian bank. His experience stretches from structuring and distributing leveraged and investment grade corporate transactions to relationship management, par and distressed secondary market trading, structured credit derivative products, workouts and credit and financial mandates, structuring and negotiating transactions (including leveraged, project finance, and recapitalization of distressed situations), as well as negotiating complex legal documentation.
Stephen holds a BA in economics from Heriot-Watt University in Edinburgh, Scotland, and has qualified as a Chartered Accountant in both the United Kingdom and Canada. In this respect he worked for one of the large accounting firms carrying out assignments in the fields of audit, consultancy (including business valuations), and taxation.
Rick Nason, PhD, CFA, has an extensive background in the capital markets and derivatives industry, having worked in equity derivatives and exotics, credit derivatives, and capital markets training in a senior capacity at several different global financial institutions. Rick is a founding partner of RSD Solutions, a risk management consultancy that specializes in financial risk management consulting and training for corporations, investment funds, and banks. Dr. Nason is also an Associate Professor of Finance at Dalhousie University in Halifax, Nova Scotia, where he teaches graduate classes in corporate finance, investments, enterprise risk management, and derivatives. He has been awarded several teaching awards as well as being selected MBA Professor of the Year several times. His research interests are in financial risk management, enterprise risk management, and complexity.
Rick has an MSc in physics from the University of Pittsburgh and an MBA and a PhD in finance from the Richard Ivey Business School at the University of Western Ontario. Additionally, he is a Chartered Financial Analyst charterholder. In his spare time he enjoys practicing risk management principles as he plays with his collection of pinball machines.