How Do We Define Waste?
According to Dr. Shigeo Shingo, “Waste is any activity which does not contribute to operations.” There are two types of operations: value-added work and non‑value-added work. Some non‑value-added work is necessary but is still non‑value-added work. An example is completing tax returns for the business. The tax forms and submission are required by law, however producing tax forms does not directly add value to the customer. When your organization becomes literally obsessed with the total elimination of waste in everything it does, and is never satisfied with the current state, then your organization will be well on its way down the Lean maturity path. Waste creates workarounds to our processes, creating poor staff and customer satisfaction as we are constantly searching for papers, tools, or materials that delay our products and services. Waste causes variation and imperfection in our processes, leading to a decrease in our ability to compete in the marketplace.
The Seven Wastes of Ohno Plus Two More
The seven wastes originated with Taiichi Ohno. These are:
1. Waste of Overproduction
This is the number one waste in the Toyota production system (TPS), the one Ohno worked on the most, and we find it is the hardest to remove. This waste manifests itself two ways:
– Making more than you need
– Making it before you need it
2. Waste of Time on Hand (Idle)
3. Waste in Transportation
4. Waste of (Too Much) Processing
We define this as doing more to a part or paperwork (electronic or paper) than necessary to meet the customer-defined specifications, and customer-perceived quality needs. Inspection is a waste of too much processing.
5. Waste of Stock on Hand (Inventory)
6. Waste of (Worker) Movement
We define this waste as follows: whenever someone has to reach outside their normal path of motion while sitting or standing, including having to get their own supplies.
7. Waste of Making Defective Products
The Next Two Wastes*
8. Waste of Talent (An Organization’s Most Valuable Asset)
We see this waste when organizations do not tap their employees’ brainpower, ideas, and experience or they have no respect for their people. The engagement of an organization’s talent is critical in making Lean initiatives successful. The talent in your organization will drive innovation and change by identifying and eliminating all waste.
9. Waste of Resources
Whenever we don’t fully utilize or recycle our resources or we dump hazardous or everyday waste into a landfill.
Where Does Waste Come From?1 What Are the Overarching Root Causes of Waste?
Where does waste come from? What are some of the root causes of waste? Consider some of the following:
1. The batching system in general
2. Lack of standardization throughout the company to include work instructions.
3. Waste due to inefficient layouts
4. Complacency—no compelling need to improve, need paradigm shift
5. The organization chart (layout). Centralization is a huge creator of waste and most of it is hidden. Centralizing is paramount to and synonymous with batching
6. Lack of voice of the customer (VOC)
7. Lack of leadership—inflexible—no constancy of purpose—fear-based environments—lack of clear ownership, responsibilities, discipline, and accountability
8. Lack of pride in one’s work or one’s workplace
The Transactional Ten Wastes
Similar to other Lean initiatives, in general, people are not the problem; the system is typically the true culprit. The office personnel are similar to other staff throughout the firm; they are always busy; however, what are they busy doing? We video the office (transactional) process and utilize the same analysis tools for information flow as we do for physical products. We use the tools based on the problems to be solved and their complexity. The transactional wastes are:
1. Waste from overproduction of goods or services—waste of excess reports, both paper and electronic, batch copying, too many brochures printed, information duplicated across forms or not needed. Gathering, sorting, and saving more information than is really needed.
2. Waste from waiting or idle time—either the information itself or the person is waiting for it, time to secure (rubber stamped) approvals for contracts, equipment ordering, repairs in the office, unplanned interruptions, unbalanced workflow, lack of capacity for volume, etc.
3. Waste from transportation (unnecessary)—document flow/movement between offices for processing, routing, and poor office layout placement of adjacencies, travel time, unnecessary copying/approval of information to people who do not use it.
4. Waste from over-processing (inefficiency)—multiple, redundant, and undefined approvals; and multiple reviews and inspections. Elaborate filing systems for documents that have information already contained in the ERP system.
5. Waste of motion and effort—rework of requests, calls for following up on approvals if multiple people are involved, searching for information, centralized printers, etc. Waste driven in computer systems.
6. Waste of inventory; unnecessary stock on hand—too many supplies, duplicative files, multiple file storage, just in case storage, etc.
7. Waste from defects—lack of training documents, completion of company errors in capturing data, errors in transferring data, supplies and equipment ordered incorrectly or in the wrong quantities, missed deadline, rework, clarifications, etc.
8. Waste of talent—frustration of employees, no one listens to their input, right person in wrong position, talented people spending time on rework, lack of empowerment to correct processes, lack of training on process improvement, unclear roles, task interruptions, multitasking, underutilization of talent, etc.
9. Corporate staff waste—creating report-out presentations and ongoing requests for data often known as corporate data calls. Sometimes we receive the same requests from various positions in the corporate staff. Corporate staff members are non‑value-added positions and often add tasks to the value-added team members creating work for people already busy.
10. Waste driven by centralizing processes. Centralizing is another form of batch; many companies will flip between centralizing and decentralizing operations. It is important to note that sometimes centralizing things makes sense, like employee payroll. Many times centralizing drives the same bad behaviors of a batch environment.
Lean and Effective Meeting Techniques
How many meetings, are too many meetings? Despite the cost and lost productivity, most organizations still believe that meetings play a crucial role in disseminating information and providing a venue to discuss topics requiring decisions. Additionally, understanding MBTI® types can help cultivate techniques for effective meetings, as personality types of participants will impact the outcome and perceived value of the meeting. There are different types of meetings that serve different customer or business requirements. Examples of meeting types are:
■ Top-down status meetings
■ Daily meeting or huddles
■ Customer-required meetings, such as a program review or design review
■ Informational meetings
■ Problem-solving meetings
SPACER
SPACER is a tool to ensure your meetings are efficient (see Figure 5.1).

Figure 5.1 SPACER is a tool we used at Honeywell to ensure meetings were efficient. (Source: BIG Archives.)
Safety—This is reviewing evacuation plans and pointing out any safety issues, such as cords on the floor. The main reason for including safety is to keep safety first in the mind of meeting attendees.
Purpose—The team leader reviews the purpose of the meeting, which should also have been part of the meeting notification.
Agenda—The team leader should have sent an agenda prior to the meeting to ensure each attendee is prepared. An agenda should list the topics to be discussed and an approximate time frame for each topic. The other purpose of the agenda is to help the participants decide whether they are the right person for the meeting. If they conclude they are the wrong person or someone else might be better suited to discuss the topics, then they can contact the team leaders and discuss options. The leader can ask if there is anything anyone would like to add or change on the agenda prior to starting the meeting.
Code of conduct—A code of conduct is a list of behaviors we are going to live by as a team to ensure we will have a good meeting. A code of conduct may include items such as no speeches, no interruptions, only one person speaks at a time, respect everyone’s opinion, no personal attacks (or if you want to have some fun, allow one unwarranted personal attack per person), and no such thing as a bad idea. Some companies post a basic code of conduct in their meeting rooms, and then the team can decide whether to add or detract from the one posted.
Expectations—The team leader quickly reviews expectations for the meeting, which should also have been part of the meeting notification.
Roles—The team leader asks for volunteers for meeting roles, which are described in more detail later.
Meetings are often the bane of existence in a corporation. Meetings require a tremendous amount of time and often consume most of the day for many executives. Is an executive’s or anyone’s time valuable? If so, why not take the time to structure a meeting to be effective in the shortest possible time? Meetings are not necessarily bad; however, in many companies, both the number of meetings and the meeting inefficiency create a tremendous waste of time for the most expensive personnel.
Meetings can serve a useful purpose as they help us communicate and share information or problem-solve. But are they all truly necessary? In too many companies in which we have worked, the leader’s Office Outlook® calendars are literally full of meetings every day, with many double-or triple-booked. We can’t possibly run our organizations if we are meeting all the time. How do we know what’s occurring in the company where the real value is being added?
Try setting the meeting to your actual agenda time, such as for 42 minutes instead of the usual hour and using meeting roles. If we schedule it for an hour, we usually find ways to fill the time. If it is a problem-solving meeting, try a stand-up meeting on the floor or in an office, wherever the source of the problem lies, to discuss ways to fix the problem. Meeting roles are the real secret to efficient and quick meetings and include the following:
1. Team Leader
2. Scribe—records on a flip chart during the meeting
3. Recorder—records action items
4. Process Monitor—makes sure the meeting stays focused on the agenda item
5. Process Observer—makes sure everyone participates
6. Time Keeper
7. Spokesperson
8. Facilitator (Optional)
9. Representative
10. Role of the Champion (for Problem-Solving Meetings)
How do you know if you ran a good meeting? One way is to collect data from those who attended. In one minute or less, you can ask each person to rate the meeting on a scale of one to five, what went well and what could be improved for the next meeting. This reflection is sometimes referred to as a plus/delta summary. The team members in attendance will appreciate knowing you acknowledge their time is valuable and you are working on constantly improving the meetings they attend even if the meeting didn’t go as well as it could have. Consider building meeting metrics into your agenda.
Effective Team Pre-Meeting Checklist
What is the purpose of the meeting and what kind of meeting it is? What do you expect to accomplish? Is a meeting the best way to accomplish it?
■ Is your purpose ultimately value-added to the customer?
■ Create an agenda and distribute prior to the meeting.
■ Let people know what they need to bring or think about in advance to be prepared.
■ Use SPACER and select meeting roles.
■ Agree ahead of time how decisions will be reached, that is, by majority or unanimous.
■ Use TQ tools as appropriate, to include brainstorming, Pareto, affinity, histograms, decision matrix, drivers/barriers, and problem-solving.
■ Be considerate of personality styles.
■ Use meeting metrics such as on a scale of one to five with one being a root canal and five being the best meeting ever attended; please rate the meeting. What could be improved? What went well? Were roles picked? Did the meeting start and end on time?
For team member questions and attributes of high-performing teams see Figures 5.2 and 5.3.
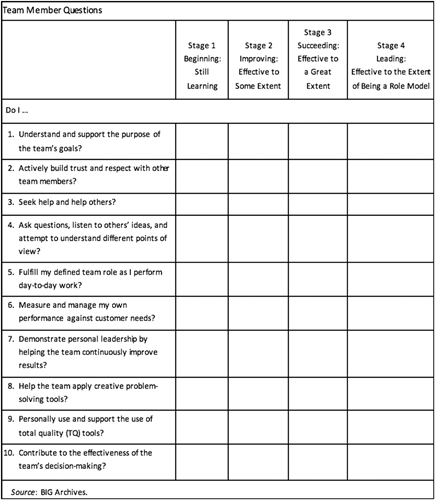
Figure 5.2 Team member questions. (Source: BIG Archives.)

Figure 5.3 Attributes of high-performing teams. (Source: BIG Archives.)
Why Are Meetings Always in Scheduled Half-Hour or Hour Increments?
When scheduling your meeting, ask yourself how long the meeting really needs to be. Many times, we tend to round off meeting times to the nearest 15 minutes or one hour. If your agenda says you need 37 minutes, then schedule it for 37 minutes.
The first question should be: is this meeting really necessary. If you find there is no alternative and a meeting must be held, the following guidelines will help to ensure higher levels of productivity:
■ The meeting owner is the person that called the meeting and must control the outcome.
■ Start the meeting on time.
■ Send read-ahead material before the meeting and ask if attendees reviewed the material at the beginning of the meeting. Those that did not review the material lose the privilege to speak.
■ Reduce the number of attendees to the critical core—the more communication nodes, the longer the decision making takes and the meeting runs.
■ Do not go backward by recapping information for late arrivers.
■ Constantly try to reduce the meeting time for ongoing meetings.
■ Ensure the meeting ends before the scheduled time allotment.
■ Late arrivers over five minutes are dismissed.
■ Focus on the agenda. Stay on task.
■ Cell phone off, personal digital assistants (PDAs) down, and laptops off (unless there is required laptop data for the meeting).
■ Invite staff to leave if they are working on items outside of the meeting.
■ Only one speaker talking at a time with a keen focus on agenda topics with a member assigned to control this specifically (this is the process monitor role).
■ Ever been subjected to a meeting with over a hundred PowerPoint slides and where they feel the need to read every bullet on each slide. This is affectionately known as PowerPoint Death. We have all been there. Next time, consider using a 5-up chart (see Figure 5.4) or an A3 instead.

Figure 5.4 5-Up report example. (Source: BIG Archives.)
Levels of Waste
This is a new concept we introduced in our The Lean Practitioner’s Field Book. We have categorized waste into six different levels2:
1. The first level is obvious waste: low-hanging fruit (or walking on it).
2. 5S wastes: the easiest wastes to see.
3. The Ohno seven wastes: discussed earlier.
4. Boiled frog waste: the waste that is hard to notice because it is old and we pass by it every day.
5. Tribal waste or sacred cows: untouchable waste in our culture and systems.
6. Hidden unseen waste: waste we don’t typically see, as it is hidden behind or masked by other wastes; you really have to hunt for it! The hardest waste to find and yet the most dangerous.
There are some similarities between Honda and Toyota approaches. At Toyota and Honda, going to the gemba—Genchi Genbutsu (go and see at the) actual place, seeing the actual thing—gives us a deeper understanding and stresses the importance of understanding what is occurring through first-hand experience. All levels of employees are expected to go and see the waste and resulting problems for themselves rather than calling a meeting or reviewing a report.3
30-30-30 Waste Exercise
Taiichi Ohno was known for drawing a chalk circle on the floor around managers and making them stand in that circle until they had seen and documented all of the problems in a particular area that he wanted them to see (sometimes an entire shift or longer) (Figure 5.5). Today the stand-in-a-circle exercise is known as the “Ohno Circle,” or the 30-30-30 exercise, and is a great first step to train someone’s eyes to see waste. It also helps to provide structure for the group leader/supervisor or manager to carry out daily improvement or for the busy executive with limited time to go to the gemba and see what is really happening.

Figure 5.5 The Ohno Circle—Managers would spend many hours, sometimes over a shift or more until they saw the waste Ohno wanted them to see.
Cost of Waste
Whenever you spend time searching for something, or you are idle, who pays for the searching or for the idle time? The first answer is your company, and the second answer is your customer, or actually, all of us end up paying through higher prices. Consider the impact of waste on your customer’s time, product quality, and experience. Imagine if your products could talk, what would they be saying to you? In healthcare, government, and service industries many times the product can talk, because the products are each of us. Finance should be involved up front in calculating the costs of these wastes or losses to truly convey the impact.
Lean and Productivity, Efficiency, and Effectiveness
Our Lean principles strive for the best utilization of man, machine, methods, and materials (the four Ms). When analyzing a system, it is important to understand the definitions.
1. Productivity—Productivity is the number of products produced in a certain amount of time with a certain amount of labor. The products could be physical products or transactional, such as processing an invoice or internet blogs. Productive means getting things done, outcomes reached, or goals achieved, and is measured as output per unit of input (i.e., labor, equipment, and capital) or as units per person per hour.
2. Efficiency—is based on the energy one spends to complete the product or service as well as timing. For example, we all know of the learning curve. The more one performs a new task, the better one becomes each time the task is practiced. As one becomes more efficient one definitely reduces stress and gains accuracy. A person has achieved efficiency when they are getting more done with the same or better accuracy in a shorter period of time, with less energy and better results.
3. Effectiveness—is the ability to achieve stated goals or objectives, judged in terms of both output and impact.
Apparent versus True Efficiency
By reducing the steps and complexity in the process, we also reduce the opportunity for defects in the process. This is extremely important. Behind this are the wastes of overproduction and over processing, and while this sounds simple, it is violated all the time. Toyota differentiates this by highlighting the difference between apparent versus true efficiency. True efficiency occurs only when we increase efficiency without overproducing or over processing. For a firm that has a demand of 480 units per eight-hour shift, kaizen 2 is the preferred process as there is no overproduction (see Figure 5.6).

Figure 5.6 Apparent versus true efficiency. (Source: Protzman, Charles. The Lean Practitioner’s Field Book. Productivity Press.)
Utility Factor and Efficiency4
■ For a machine, the utility factor is the percentage of the energy supplied to the machine relative to the machine’s actual capabilities (never more than 100%).
■ For people, the utility factor is the amount of labor expended for producing a given product in relation to the labor required for making a given product.
Efficiency is used when one wishes to compare output. That is, within a given time frame, how many people have produced how many pieces? To compare, one needs to first set a standard. When we discuss attaining a 20% improvement in efficiency there are two ways to accomplish improvement:
■ Increase the number of machines per person
■ Reduce the number of workers
A simple example is an air conditioner that can be productive in British thermal units (BTUs) per minute, but not efficient, because the filter has not been replaced in a year and not effective because the windows are open. In some industries, it is said that a 10% decrease in costs can equal a 100% increase in sales. Thus, businesses need to continuously drive costs down, while sustaining or improving quality; this is a key to business growth and competitive advantage.
Trading Labor Efficiency for Output
Under certain circumstances, we all knowingly trade labor efficiency for output. This situation occurs when we cannot utilize 100% of a person(s). This normally is because of a layout issue and peak customer demand. For example, one person in the cell can produce 80 pieces a day, but due to a long machine-time in the cell, two persons can only produce 130 pieces per day. This means 30 pieces of idle time are traded for 50 additional pieces of output. It is not efficient but sometimes may be necessary.
Shingo P-Course
Dr. Shingo taught a course named the “P-Course” (P was for production) that was part of the teachings to students as part of industrial engineering training. An exercise that was used by Dr. Shingo is depicted in Figure 5.7.

Figure 5.7 P-course training example. (Source: Legacy of Dr. Shingo and TPS, Art Smalley ©2006 http://www.artoflean.com. Used with permission.*)
The question he would ask the class is: If one man and one machine in one hour can make 100 parts, how can they make more parts?
The normal answers were of course to:
1. Add people
2. Add machines
3. Add more time
These were all unsatisfactory answers because they all add cost to the system. A fourth answer was often given such as “work harder,” which was also unsatisfactory since it could not be sustained. When the class was stumped he would inform them the right way was to improve the overall method by which the elements work together and produce more efficiently. Either the same combination would be used to make 120 parts per hour or if demand was not needed then instead it should strive to produce 100 parts in 8 hours.
One part of the class would then look in detail at the four categories and draw out symbols corresponding to the workflow. This is called a product-flow analysis today. He taught the engineers the basics of time study, and how to identify and measure the length of time for the individual elements of each task. Additionally, they had to learn the details of motion analysis, and to map out the 17 symbols invented by Frank and Lillian Gilbreth for motion analysis.
He taught them the basic discipline of systematic process analysis, for which he became so famous, and he showed them manufacturing logically consisted of four primary elements:
1. Actual processing work
2. Conveyance work
3. Inspection work
4. Delays
Only the process work added value. He would subdivide each of these items further. He taught other methods of looking at how the work was transformed step by step as well as basis operational availability analysis. Once the methods were clear in their heads everyone returned to the shop floor and began to review the process in great detail. Where eight machines and four operators previously seemed efficient, now there was suddenly a truer recognition of waste. With proper machine availability only six machines might be needed instead of eight. Where four operators were needed before, now only two were required.
Every aspect of the layout, tooling, motion, walk pattern, operation, and process were fit for more detailed study. During the workshop some of the items were fixed and improved on the fly and others were left as homework items to be resolved by the time Dr. Shingo returned in a couple of months.
Notes
1. Partially based on a discussion with ITT Control Technology Team Members: Stephen Deas, Lean Six Sigma Black Belt, Crystal Hamilton, Assembler & Machinist, HazMat Coordinator, Boyd Mashewske—CNC Machinist & Setup, Lloyd Smyly—CNC Machinist and Setup/R&D.
2. Protzman, C Mayzell, George, and Kerpchar, Joyce. Leveraging Lean in Healthcare (New York: Productivity Press), 2011.
3. Liker, Jeffery. Toyota Way (New York: McGraw-Hill), 2004, p. 223.
4. Kanban Just-in-Time at Toyota–Ohno, Japan Management Association.
_________
* Charlie Protzman added these two wastes in 1997.
* In email from Art Smalley dated 12/4/12—It is fine with me; however, it appears that I have made a mistake in attribution. In follow-up conversations with Mr. Kato, my coauthor, he has pointed out to me that Shingo did not come up with the graphic, although it was periodically used in the P-course and Toyota kaizen course. It appears the source for the “graphic and logic” is “probably” a professor by the name of Ueno (I don’t know his first name unfortunately) and appeared in one of his text books (now out of print) in Japan. I asked for a copy or source, but Mr. Kato did not provide anything further and I doubt he has the energy to research it further. It is safe to say that Shingo used the graphic and concept in teaching, as did Toyota in their kaizen course for many years. However, it was not really “invented” by either party. For all I know it could also reside in some American Industrial Engineering book as an example that Ueno borrowed to use in Japan in the 1950s and 1960s etc. It is unfortunately that murky … however I don’t mind you using it and the explanation. You just may want to tread lightly on any grounds or mention of “invention” or “development” or “creation” etc.