8
Financial Innovation: Creating Value… or Risk?
8.1. Basic concepts of portfolio management
In this chapter, we will try to answer, based on the fundamental concepts of portfolio management, the following question: does financial innovation create value or risk for the investor? In order to do so, we will first go back to the fundamental concepts of portfolio management.
8.1.1. Diversification
The principle of diversification is widely known, both by financial asset management professionals and private individuals. However, while it seems simple, it is often misunderstood.
The general idea is that by combining different assets, we will reduce the risk of our portfolio. That’s right, but we need to be more specific!
In fact, it is important to return to the basic objective: what is the purpose of diversification? Yes, the objective is to reduce the risk of our portfolio, but in a very specific context: when the markets fall and in an extreme case, in the event of a crash.
Indeed, it is when the markets fall that investors want this decline to be cushioned. But cushioned by what? If you have a large number of financial assets in the portfolio, but they all fall at the same time, this is not very useful. This last remark may seem rather obvious, but it is very important to remember, as markets sometimes behave in a way that is described as gregarious. Thus, when equity markets fall, many financial assets suffer the same fate: real estate, commodities, high-yield bonds. This is typically what was observed during the financial crisis of 2008 and again during the recent COVID-19 crisis.
Thus, there are many assets in the markets that tend to move “increasingly” in the same direction when markets fall. This is called correlation, which increases to tend towards 1, i.e. 100% correlation. There is then no more diversification in this case.
On the other hand, there are assets that have the opposite properties: when equity markets fall, these assets tend to rise; investors favor these assets when the context is particularly uncertain. We are talking here about socalled “risk-free” bonds, such as German or American government bonds, gold, or other types of assets perceived as safe havens.
8.1.2. Markowitz model
It was as early as 1952 that Professor Harry Markowitz specified and quantified the central concept of diversification and, as an extension, portfolio management.
Again, our goal here is not to get into theory, but rather into the advantage and practical application of the concepts. Readers wishing to go further into these elements can refer to the bibliography.
Markowitz laid the foundation for building a portfolio of financial assets. To do so, he summarized the problem by determining three basic inputs: expected return, expected risk and correlations between assets. This last ingredient is in a way the magic ingredient of portfolio management.
Thus, for the same level of expected return, for example, reaching 5% return over the year, it is possible to reduce risk by combining assets that are not perfectly correlated with each other. The expected return is therefore the same, but the risk of loss is reduced.
This is why diversification is central to portfolio management.
8.1.2.1. Expected return on a portfolio of financial assets
Calculating the expected return on a portfolio of financial assets is fairly simple; it is the weighted average of the expected returns on the assets that make up the portfolio.
Diversification is therefore not, as is often mistakenly thought, a question of return. You can increase the number of financial assets in your portfolio as much as you want, the return on the portfolio will always be the weighted average of the different returns.
8.1.2.2. Expected risk of a portfolio of financial assets
Diversification is therefore exclusively a question of risk in the Markowitz model.
Portfolio risk, when assets are not perfectly correlated, is lower than the weighted average risk of the individual securities. Thus, the more diversified the portfolio, the lower the risk.
To measure risk in the Markowitz framework, the concept of standard deviation is used:
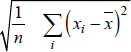
Behind this formula lies the following idea: by how much do the observed returns deviate from the average returns?
So, if your goal is 5%, it is not the same thing if you get it with a smooth linear increase, or if you get it with an average of returns ranging from −20% to +20%.

Thus, the higher the standard deviation, the greater the risk. If the standard deviation is 20% (which is close to the historical average for equities), this means that there is a 68% chance of being in the range: mean − 20% to mean + 20%. There is a 95% to be between mean − 40% to mean + 40%.
Portfolio risk is equal to the weighted average of standard deviations minus the benefits of diversification. Thus, the portfolio risk will only be equal to the weighted average of the individual risks in the case of a perfect correlation between these assets.
8.1.2.3. Covariance and correlation concepts
The tool to measure diversification is covariance. As you can see below, it is a variant of variance. The idea is to cross-tabulate the different assets with each other.
The lower the covariance, the greater the reduction in portfolio risk.
The portfolio risk is determined by the following formula:

where:
- – σport = standard deviation of the portfolio;
- – Wi = the weights of the individual assets in the portfolio, with these weights being determined by their proportion of value in the portfolio;
- – σi2 = variance of the rate of return of asset i;
- – Covij = covariance between the rate of return of assets i and j, where Covij = rijσiσj.
It is well observed that the lower the covariance, the lower the risk of the portfolio.
For an easier reading of this concept, correlations are generally favored:
where:
- – rij = correlation coefficient of returns;
- – σi = standard deviation of Rit;
- – σj = standard deviation of Rjt.
It is in fact a standardized version of covariance by dividing the covariance by the product of the standard deviations. This has the advantage of ranging correlations between – 1 and + 1.
A correlation of +1 means a perfect correlation and therefore no diversification benefits. The ideal is to obtain the lowest possible correlation, and even ideally a decorrelation or negative correlation. Thus, in the event of a fall in one asset, this fall is compensated by the rise in another asset. In the event of a financial crisis, this is generally what is observed between equities and bonds. Investors sell their shares in these difficult economic contexts in favor of assets perceived as safe, such as government bonds. As a result, there is a decline in equities and a rise in bond prices. The correlation is thus negative.
8.1.2.4. Markowitz’s optimal portfolio
On the basis of the different financial assets available, it is therefore possible to combine them. It appears that it is possible to combine them in such a way that, for a certain level of expected return, there is only one “optimal” combination of these assets that minimizes the portfolio risk. No other combination can achieve a lower risk for this objective. Conversely, for a given level of risk, there is only one combination that gives the highest expected return.
The combination of these different optimal portfolios makes up the efficient Markowitz frontier.
8.1.3. Financial innovation “theoretically” a source of diversification
Insofar as financial innovations constitute new investment opportunities, the correlation of these new asset classes with traditional assets will be less than 1, and therefore there will be a contribution to portfolio diversification.

Figure 8.4. Efficient frontiers as a function of asset correlation (inspired by Reilly and Brown (2012)). For a color version of this figure, see www.iste.co.uk/dispas/innovation.zip
8.2. Risk-creating financial innovation?
Unfortunately, in reality, these new share classes tend to correlate when markets are in crisis. For example, for investors who had favored private equity, commodities, real estate, hedge funds, high-yield bonds, etc., these new classes of shares tended to be highly correlated during the financial crisis of 2008. As a result, the benefits of diversification were not generated when the investor needed it the most.
Table 8.1. Correlations between the S&P 500 and various so-called “alternative” asset classes
(source: Bloomberg; Blackstone (2019))
| 1998–2007 | 2008–2019 | |
|---|---|---|
| U.S. Government Bonds | − 33.18% | − 30.69% |
| U.S. Inv. Corporate Bonds U.S. Rank | − 3.82% | 34.13% |
| Raw materials index | − 1.74% | 57.31% |
| High yield US | 50.18% | 72.28% |
| Real estate American side | 32.27% | 73.19% |
Following the example of Blackstone (2019), we have calculated the correlation of different classes of so-called “alternative” shares with respect to the S&P 500 American stock market index. It appears that the correlations have tended to increase between 2008 and 2019 compared to 1998 and 2007. For example, the correlation between listed real estate and the S&P 500 rose from 0.3 to 0.7. The correlation with commodities increased from 0 to 0.5.
Therefore, it appears that investors have globally faced an increase in the volatility of their portfolios, as they have replaced core assets such as listed stocks and (risk-free) bonds with assets whose risk they have underestimated. Collateralized Debt Obligations (CDOs) are the most obvious example with many investors substituting conventional bonds for this type of toxic product.
While financial theory tells us that financial innovations should promote diversification and thus reduce risk, it appears that the reality may be different. As illustrated in Table 8.1, two of the most uncorrelated assets are the basic historical assets: equities and government bonds. The problem is that if diversification is done at the expense of these assets, the result may be a riskier portfolio. For example, if we replace government stocks with high-yield bonds, commodities or real estate, we can see that the effect will be an increase in correlations and portfolio risk, not the other way around.
Therefore, asset multiplication should not be confused with diversification. Diversification is the consequence of the combination of uncorrelated assets. The financial crisis has been a strong indicator of this problem. Indeed, many new assets have brought little diversification in times of crisis. Derivatives are, as the name suggests, linked or derived from core assets.
Academic literature tends to confirm this conclusion. Buss et al. (2018) showed in an article that when non-professional investors are confronted with new financial assets, which they are less familiar with, there is an increase in the volatility of their portfolios. Simsek (2013a, 2013b) highlighted the same result due to the poor valuation given to these new products by inexperienced investors who risk investing in spite of too high a valuation. Moreover, these new types of investments, such as derivatives, private equity, hedge funds, natural resources or cryptocurrencies, tend to increase the speculative nature of the portfolio and thus its risk. Ang and Sorensen (2013), for example, illustrated the difficulties related to the valuation of private equity. Blackstone (2019) highlighted the appetite of investors for alternative investments, the potential gains in terms of diversification or return, as well as the difficulty of evaluating them accurately.