
Matplotlib is an open source library for easy plotting. We can integrate Matplotlib into Pygame game and create various plots. You can find the Matplotlib installation instructions at http://matplotlib.org/users/installing.html.
In this recipe we will take the position coordinates of the previous recipe and make a graph of them:
- Using a non-interactive backend: In order to integrate Matplotlib with Pygame, we need to use a non-interactive backend, otherwise Matplotlib will present us with a GUI window by default. We will import the main Matplotlib module and call the
usefunction. This function has to be called immediately after importing the mainmatplotlibmodule and before othermatplotlibmodules are imported:import matplotlib matplotlib.use("Agg") - Creating a Matplotlib canvas: Non-interactive plots can be drawn on a Matplotlib canvas. Creating this canvas requires imports, a figure, and a subplot. We will specify the figure to be 3 by 3 inches large. More details can be found at the end of this recipe:
import matplotlib.pyplot as plt
import matplotlib.backends.backend_agg as agg

fig = plt.figure(figsize=[3, 3])
ax = fig.add_subplot(111)
canvas = agg.FigureCanvasAgg(fig)
- Plotting data: In a non-interactive mode, plotting data is a bit more complicated than in the default mode. Since we need to plot repeatedly, it makes sense to organize the plotting code in a function. The plot is eventually drawn on the canvas. The canvas adds a bit of complexity to our setup. At the end of this example, you can find more detailed explanation of the functions:
def plot(data):
   ax.plot(data)
   canvas.draw()
   renderer = canvas.get_renderer()

   raw_data = renderer.tostring_rgb()
   size = canvas.get_width_height()

   return pygame.image.fromstring(raw_data, size, "RGB")
Note
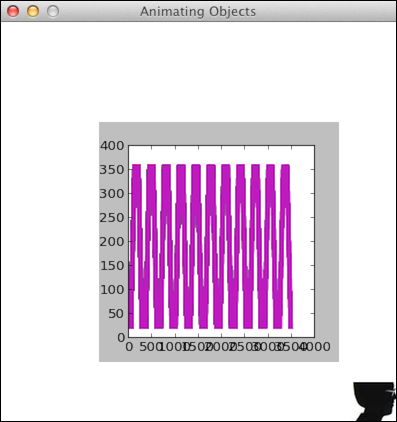
The following screenshot shows the animation in action. You can also view a screencast on YouTube at https://www.youtube.com/watch?v=t6qTeXxtnl4.
We get the following code after the changes:
import pygame, sys
from pygame.locals import *
import numpy
import matplotlib

matplotlib.use("Agg")

import matplotlib.pyplot as plt
import matplotlib.backends.backend_agg as agg

fig = plt.figure(figsize=[3, 3])
ax = fig.add_subplot(111)
canvas = agg.FigureCanvasAgg(fig)

def plot(data):
   ax.plot(data)
   canvas.draw()
   renderer = canvas.get_renderer()

   raw_data = renderer.tostring_rgb()
   size = canvas.get_width_height()

   return pygame.image.fromstring(raw_data, size, "RGB")

pygame.init()
clock = pygame.time.Clock()
screen = pygame.display.set_mode((400, 400))

pygame.display.set_caption('Animating Objects')
img = pygame.image.load('head.jpg')

steps = numpy.linspace(20, 360, 40).astype(int)
right = numpy.zeros((2, len(steps)))
down = numpy.zeros((2, len(steps)))
left = numpy.zeros((2, len(steps)))
up = numpy.zeros((2, len(steps)))

right[0] = steps
right[1] = 20

down[0] = 360
down[1] = steps

left[0] = steps[::-1]
left[1] = 360

up[0] = 20
up[1] = steps[::-1]

pos = numpy.concatenate((right.T, down.T, left.T, up.T))
i = 0
history = numpy.array([])
surf = plot(history)

while True:
   # Erase screen
   screen.fill((255, 255, 255))

   if i >= len(pos):
      i = 0
      surf = plot(history)


   screen.blit(img, pos[i])
   history = numpy.append(history, pos[i])
   screen.blit(surf, (100, 100))

   i += 1

   for event in pygame.event.get():
      if event.type == QUIT:
         pygame.quit()
         sys.exit()

   pygame.display.update()
   clock.tick(30)
The plotting-related functions are explained in this table:
|
Function |
Description |
|---|---|
|
|
This function specifies to use the non-interactive backend |
|
|
This function creates a figure of 3 by 3 inches |
|
|
This function creates a subplot (in this case we only need 1 subplot) |
|
|
This function creates a canvas in non-interactive mode |
|
|
This function creates a plot using specified data |
|
|
This function draws on the canvas |
|
|
This function gets a renderer for the canvas |