
In the previous chapters, we outlined the various capabilities of Qlik Sense and their use. One of the advantages of Qlik Sense is that it is built on open API 's Qlik Analytic Platform (QAP), that allows the customers and partners to extend their analytic solutions. This chapter will provide an overview and some interesting examples of how to enrich your solutions with QAP. It is not meant to replace the Qlik Sense for Developers help documentation, which can be found at https://help.qlik.com/sense/2.1/en-us/developer/#Home-developer.htm.
With this said, in this chapter, we will share some interesting examples and resources in the following key areas:
- Web mashups
- Extending Qlik Sense client
- Developer community – branch
QAP is made up of the following three layers, which include the client layer (Qlik Hub and Qlik Management Console), API, the SDK layer, and finally the Engine layer, which contains the QIX engine and all the supporting services:

We will explore each of these layers through specific examples on how QAP is used to extend your data discovery solutions.
Any discussion of QAP would be remiss without reviewing the new Qlik Developer Hub which was released in Qlik Sense 2.1:

The Qlik® Dev Hub, shown in the preceding screenshot, was developed specifically to simplify access and development using Qlik's APIs, but it is not a replacement for the rudimentary concepts of JavaScript, HTML (Hyper Text Markup Language), and CSS (Cascading Style Sheets). The Qlik Dev Hub can be accessed via any Qlik Sense Server, or Qlik Sense Desktop via a browser. The link is https://<servername>/dev-hub/, and for the desktop version of Qlik Sense, it is https://localhost:4848/dev-hub/. This chapter will focus primarily on Qlik Sense Enterprise. Dev Hub provides four key tools for extending Qlik Sense solutions. They include the following:
- Single configurator: A Qlik Sense tool that provides an easy way of creating simple mashup pages by returning a URL that will resolve to a Qlik Sense object.
- Extension editor: An editor for JavaScript files and QEXT files. It assists you with creating new visualization extensions as well as editing existing ones.
- Mashup editor: An editor for JavaScript files and HTML files. It assists you with creating your own mashups displaying Qlik Sense data on your website. You can use the templates provided with Qlik Sense to get started with building your own mashups.
- Engine API Explorer: A tool that helps you explore the capabilities of Qlik Engine API.
With this said, now let's take a closer look at the most common solution extensions that can be generated via Dev Hub.
One of the most common requests is: can Qlik Sense create a web mashup with Qlik Sense objects? There are two options based on the level of control and interactivity required of the Qlik Sense objects. The first is the single configurator which provides an easy way to create simple mashup pages without having to create any code. It simply generates a URL that returns a complete HTML page with an embedded Qlik Sense visualization. To create a Qlik Sense object link, select the Single configurator as shown in the following screenshot. Once selected, you will need to select the application you wish to access for the mashup. In this example, the Executive Dashboard application was selected. It is important to note that a developer should access a published application that is in a stream that aligns with the requirements of the resulting mashup. There is additional information on administration in Chapter 9, Administering Qlik Sense®.

Once selected, a listing will be generated of all the sheets and respective objects. A key point to highlight is that both sheets and individual objects are available based on your web page requirements.

For this example, Margin vs Sales was chosen with selection bars showing so that a user can interact with this visualization.
In the following screenshot, you can see the use of the Single configurator generating the URL and the Iframe code for the Margin vs Sales by Sales Rep scatter chart that is contained in the Executive Dashboard Qlik Sense application:

The resulting URL can then be embedded into a web page. Dev Hub offers a convenient View option so that a developer can see the results of the generated URL outside the Single configurator editor.

Additionally, multiple single Qlik Sense objects can be embedded and they will share common selections and interactions because of the QIX engine. Please note that not only can the visualizations be embedded, but the entire Qlik Sense sheets can be embedded as well. For more information, please refer to the Qlik Sense for Developers help site.
Now, let's move onto more complex mashup requirements with the Mashup editor. To start the creation of a new mashup, select Create new and immediately you will notice that the Mashup editor provides the following four pre-built templates to ease your development:


Once created, all these mashups are stored in the content store of the Qlik Sense server. Dev Hub provides an easy way to filter mashups versus visualization extensions. The following are the four templates that were generated:

Now, let's dig a bit deeper as we build out the Basic-single mashup with the creation of a sales and travel mashup that spans the two Qlik Sense applications:

With the template created, we are ready to begin. One of the advantages of working in the Dev Hub is that you can create mashups that can span different Qlik Sense applications, in this case, the Executive Dashboard that contains sales analysis visualizations and Travel Expense Management which tracks travel and food expenses. From the Executive Dashboard app, we have dragged Average Sales Per Day, Total Revenue by Product Group, and finally, Revenue by Sales Rep:

Now, let's combine these Qlik Sense sales objects with Expense by Expense Type, and Employee Airfare Expense from the Travel Expense Management app:

With the key Qlik Sense objects all in place, we can focus on changing the headings for the mashup page. Fortunately, the Mashup editor generates the following four files for this template. They include:
Sales and Travel.qextSales and Travel.htmlSales and Travel.jsSales and Travel.css
To make changes to all the headers and other formatting, just edit Sales and Travel.html:
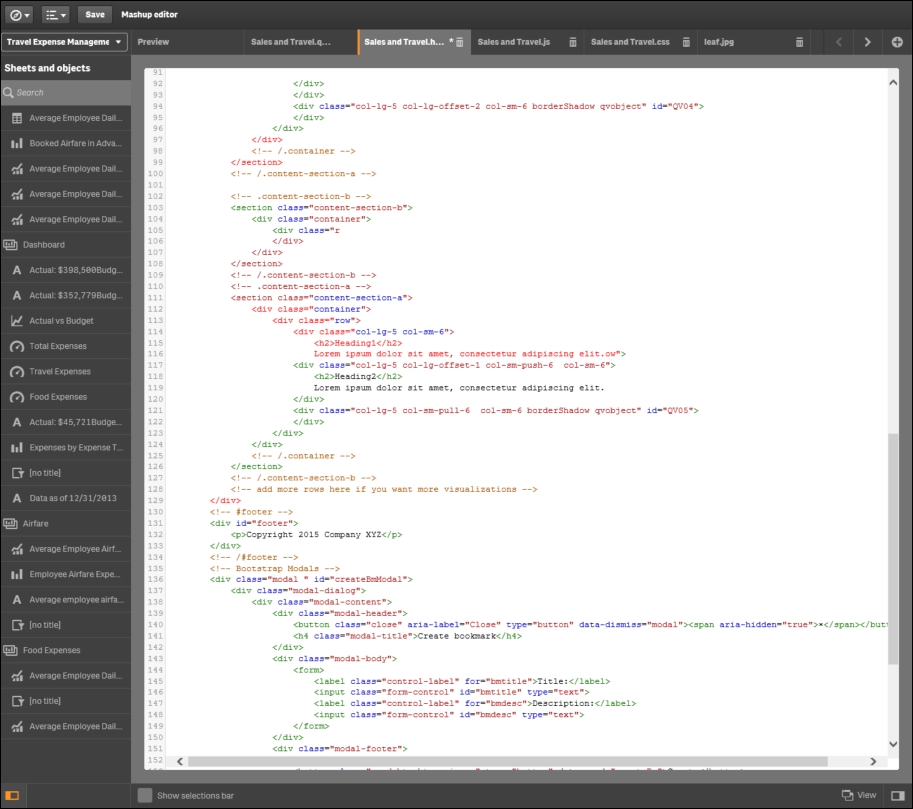
In the case of this example, the Header 1 and Header 2 titles were removed because the Qlik Sense app object titles were self-explanatory. Additionally, because this is a generated HTML file, it can be edited for additional formatting and content. The following is the resulting web page that is previewed from the Mashup editor:

Now, let's turn our attention to extending the visualization objects in Qlik Sense. One of the advantages of an open API is that it can be extended easily to include external visualizations. In our example, we will explore adding a People Chart to Qlik Sense. This example is available in the following locations:
- Qlik Sense Desktop:
...Users<UserName>DocumentsQlikExamplesExtensions - Qlik Sense:
...ProgramDataQlikExamplesExtensions
We start the process by reviewing the People Chart that is installed with Qlik Sense:

This visualization extension is made up of the following four files:
peoplechart-properties.js: This JavaScript sets the properties in which the rendering and drawing scripts will operatecom-qliktech-peoplechart.js: This JavaScript pulls together the properties, rendering, and drawing scripts for executioncom-qliktech-peoplechart.qext: This file is primarily used to document the extension name, description, type, and so onpeoplechart.css: Cascading Style Sheets (CSS) describes how HTML elements of the extensions will be displayed
The first step in defining this extension is to edit the applicable fields of the com-qliktech-peoplechart.qext file to set a default title, description, icon, and type:

Once this is completed, we need to define the properties for the extension in our Java code. In this example, we will do this in the com-qliktech-peoplechart.js file, which is loaded in the define statement:

The next step is to enable selections. To accomplish this, we use the selectValues function to reuse Qlik Sense standard selection UI. Also, make sure to set the selected CSS class on the selected elements:

Now that it is completed, we need to implement the paint method. In the paint method, we create the HTML for our extension based on the data in the layout parameter. Then, we set the content of the $element parameter to display the extension content. It is also important to tag your elements with class= 'selectable' data-value= '0':

Additionally, let's make sure that this object is available for storytelling by setting canTakeSnapshot to true:

It is a good programming practice to keep your styling in a separate CSS file. Qlik Sense sets the CSS class qv-object-[extension name] on your extensions. You should prefix your CSS rules with that. You then load your CSS file with RequireJS and add its content to the HTML page:

Finally, in the peoplechart-properties.jss, we need to define the accordions for reuse on the properties panel and the minimum requirements of one dimension and one measure to render this object:

Once the extension is saved, it is available for use by developers in the Qlik Sense Chart Library. In the following screenshot, you can see the Word Cloud chart type is available and was used to convert the horizontal bar chart of Total Revenue by Product Group into a Word Cloud:

Additionally, please note that all extensions are stored in the Qlik Sense content store and is managed by the QMC. Additional information on administration is available in Chapter 9, Administering Qlik Sense®.

Now, let's turn our attention to the final area of Dev Hub, that is, Engine API Explorer.
Qlik Engine API Explorer is a tool that allows developers to send messages and receive answers from the QIX engine. This provides an easy way for developers to form handles, methods, and macros to send the QIX engine and test the results before coding an application. To access the Engine API Explorer, select the Engine API Explorer from the Qlik Dev Hub menu:

The first step is to connect to a Qlik Sense app. To do this, we first must know what applications are available on this server. Fortunately, there is a full list of macros available to help explore QIX Engine:

In our case, we will be using the Get applist to see what applications are available to explore on this server. Based on the response, the Executive Dashboard is available:

Now we are ready to connect to the Executive Dashboard app. Note the send commands generated and the engine response. If satisfied with the response, the developer can then copy and paste into their development environment:

Now that we are connected, there is a global method to manage every aspect of a Qlik Sense app from outside the Qlik Sense client. This includes the full application life cycle from creation, maintenance, versioning, to deletion:

Now that we have explored the Qlik Analytic Platform through the Dev Hub, let's turn our attention to the value of having an open API through a developers community called Qlik Branch:
