To change the text used for each data series in the legend (the default is the column name from DataFrame), capture the ax object returned from the .plot() method and use its .legend() method. This object is an AxesSubplot object and can be used to change various aspects of the plot before it is generated:

The location of the legend can be set using the loc parameter of .legend(). By default, pandas sets the location to 'best', which tells matplotlib to examine the data and determine the best place it thinks to put the legend. However, you can also specify any of the following to position the legend more specifically (you can use either the string or the numeric code):
|
Text |
Code |
|
'best' |
0 |
|
'upper right' |
1 |
|
'upper left' |
2 |
|
'lower left' |
3 |
|
'lower right' |
4 |
|
'right' |
5 |
|
'center left' |
6 |
|
'center right' |
7 |
|
'lower center' |
8 |
|
'upper center' |
9 |
|
'center' |
10 |
The following example demonstrates placing the legend in the upper-center portion of the graph:

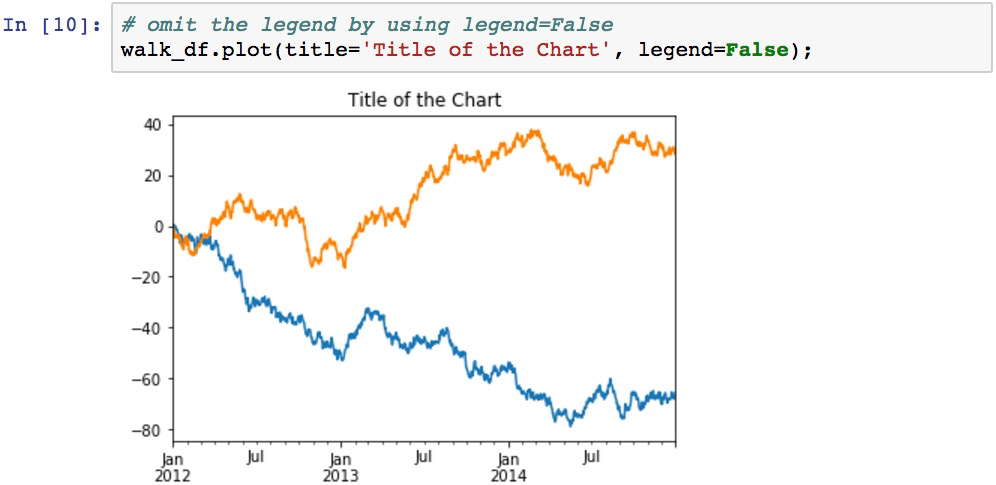
Legends can be turned off by using the legend=False: