
Planned Grocery® (A Real Estate Location Analytics Platform)
Grocery retail is changing faster today than ever. Technology, delivery, meal kits, and in-store special amenities are just some of the things that are changing consumer behaviors. Behaviors that traditional real estate companies have depended on for years. This evolution will impact store sizes, layouts, merchandise mix, and most importantly store locations. Planned Grocery® is the only platform on the market today that specifically tracks planned grocery store locations nationwide. Already in use by some of the best-known grocery retailers, shopping center owners, real estate developers, and investment banks across the country, this platform makes it easy to see new store expansion and contraction trends in the industry. This combination of data gives subscribers a never before seen look at the current nationwide grocery expansion. Figure 8.1 shows the Planned Grocery® platform starting view of when the application is first opened. Each logo represents a grocery store that is either proposed, planned, under construction, or recently built in the last six months.
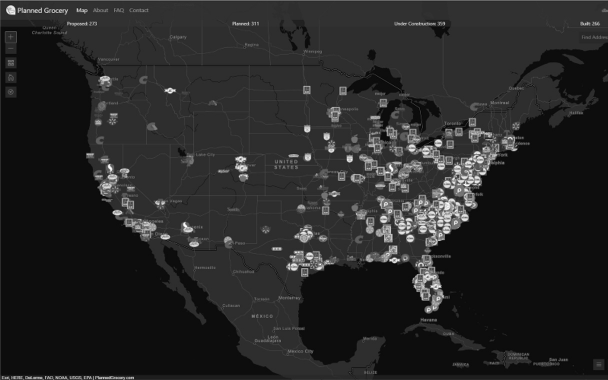
Figure 8.1 Planned Grocery® location analytics platform
Beitz and Daigh Geographics (of whom I am a partner in the business) started creating the data for the Planned Grocery® platform in early 2014. Working with various retail real estate clients throughout the United States, we kept running across the locations of planned grocery stores that had yet to start construction. I knew that real estate companies were doing this research only for the trade areas that they were interested in. I also had never seen a nationwide layer just for these sites where grocery stores were planned for. So, I started a GIS layer for these and then kept adding locations as I found them. Originally this layer was an ESRI shape file where I worked with it in the Esri ArcGIS Desktop software. After some time, we uploaded this layer to Esri ArcGIS online where more editors could work with the data at the same time and from outside of the office. We then had some interns at that time and they started researching and adding these locations as well. Any time I had some extra time that was not directly related to another project I would start adding to and refining the data in this layer. We classified new locations as planned, proposed, under construction, and recently built (within the past six months). And later we added a dead deals classification for sites where a grocery store was planned but then the deal did not move forward.
News articles are our primary source of finding these locations. We developed a search algorithm to help find these planned grocery locations and we developed an audit methodology to keep the data up to date. We also source data from social media, planning organizations, the grocery retailers themselves, as well as real estate developers. If the source mentions that the site is speculative or that the site still needs to clear hurdles such as a zooming change or approval from city or county council, then we mark that location as proposed. We mark the location as planned if the source document says the location is planned and will likely start construction soon. If the ground is being prepared or if building is going up, then we mark the location as under construction. When the location is built and open for business then we mark the location as built. We also capture the square footage, the source on the web, the accuracy of the location, the square footage, the developer, source url for marketing materials, and the attributes of the location itself. Figure 8.2 shows a view of the Planned Grocery® platform with a proposed Publix info box.

Figure 8.2 Planned Grocery® platform showing a proposed Publix info box
Later that year in 2014 when we had hundreds of locations, Todd Atkins, a partner in the business and our developer at Beitz and Daigh Geographics, built the web-mapping platform to incorporate this data. He also later created an iOS version of the app for the Apple Store. At this point we needed a logo, website, and some brochures, so one of our interns recommended a designer he knew who recently graduated from the University of South Carolina. This guy did amazing work on helping us get everything going and looking great. The first retail developer that I showed the platform to in my office in January 2016 subscribed right on the spot. Special thanks go out to Frank Cason with Cason Development for becoming Planned Grocery® customer #1! Shortly after this we added a major grocery chain (who prefers to remain anonymous) and then we added Ledbetter Properties who are shopping center owners and developers. In May of 2016, I remember going to the Gravisite Site Selection conference (formally the Gravitec Site Selection conference) in Clearwater, FL where Jim Puffer graciously offered for us to show the platform in one of the breakout sessions. I got up early that morning to add more locations to the database. It was that morning that we crossed over 1,000 locations. Shortly after this we went on to add the clients Wegmans, MTN Retail Advisors, RAM Real Estate, Lowes Foods, and Whole Foods. Our goal was to get 10 users in 12 months and we hit 10 users in half that time. Later that year we went on to several more conferences and continued to consistently add clients.
Pricing has been a difficult part of the equation to figure out. We originally thought the platform should run about $10,000 a year. But after several conversations with developers we decided to market it at $2,500 a year for the login version, with an extra annual cost for additional users. We went on to create two other pricing levels as well. We have a streaming data plan where we stream the data into our client’s mapping applications and they have the option to login to our platform as well. If they are an existing Esri client, then this is very easy and can be set up in no time. If they use a different mapping technology, then we can provide them API access to the data. Presently our streaming plan partners that include Esri, TETRAD, SiteZues, eSite, and Intalytics. We also have a raw data plan that includes logins to the platform, streaming, and the ability to download the raw data from the application. We recently raised prices at all pricing levels to help pay for the continuing maintenance of the data the costs associated with adding new layers to the platform, as well as costs associated with application (Web and iOS) development.
With solid market validation we did an official launch in the fall of 2016. For 2017 we kept adding new subscribers and almost tripled our income that year compared to 2016. The year 2017 was great, we were mentioned in the Wall Street Journal and Business Insider and we started worked on the next version of the platform. The next version of the platform just recently launched (at the time of writing this book) on March 12, 2018. It took us over five months to finish this major update. Todd did most of the work. We added a nationwide parcel layer that displays the lot lines and shows parcel ID, ownership data, and the parcel’s acreage. Figure 8.3 shows the Planned Grocery® platform with the new parcel layer on the aerial base map. We also added a layer of data from Space Jam Data which shows who wants what grocery retail and where. Space Jam Data performs social media surveys across the United States for various property owners and developers. After meeting with them in New York at the International Council of Shopping Centers (ICSC) NY Deal Making conference we formed a partnership include their data in our platform in exchange for adding some links to their website for our clients to follow in case they want more information on their services. We also added e-mail alerts so that our clients can opt in to receive a daily e-mail showing them new locations that we have recently added to the platform. Lastly, we added a “Newsworthy” section that includes locations that are slated to close. Presently this includes all Toys R Us locations and 94 locations owned by Southeastern Grocery which includes the Bi-Lo, Win Dixie, Fresco y Mas, and Harveys Supermarkets.

Figure 8.3 Planned Grocery® platform showing aerial view with parcel data
The Planned Grocery® platform was originally built with WordPress and Esri’s ArcGIS Online. Then for version 2.0 we dropped Wordpress and replaced it with our own code (when I say we I mean Todd). This platform contains the existing grocery store locations as well. For the existing grocery store locations, we scrape retailer’s websites to get the most up to date data as possible. We added three options for base maps: Light, Dark, and Bing Hybrid Aerials. The platform has four thematic demographic layers: Five Year Population Growth, Population Density, Average Household Income, and Esri’s Tapestry Segmentation. We also include traffic counts, county boundaries, and core based statistical areas from the census. When you have one of the demographic layers turned on and click one of the sections you will see a pop-up window that tells you the dominant tapestry segment with a link to the full tapestry description. This pop-up also shows the percentage of people that have completed a bachelor’s degree and higher, along with stats for income, population, and population density. The platform has measurement tools for area, distance, and for capturing the latitude and longitude of any place on the map. Other tools include the ability to calculate basic demographics for a radius ring and drive time polygon. Figure 8.4 shows the Planned Grocery® platform with drive time demographics.
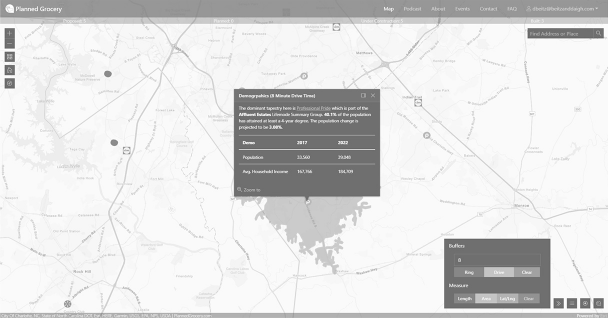
Figure 8.4 Planned Grocery® platform showing a drive time analysis with demographics
In the summer of 2018, Planned Grocery® was accepted into the Esri Marketplace. The Esri Marketplace is designed to make it easier for users to find data and applications for use with ArcGIS Online subscriptions. Currently our “data streaming” plan falls into this usage but being listed in the Esri Marketplace makes it easier for Esri users to find us and see what the data is all about. Esri users can also purchase an annual subscription to the Planned Grocery® data set directly through the Esri Marketplace.
Our platform is subscriber driven in that we take feedback from our users and update the platform based on their suggestions. In May 2018, we had a booth at ICSC RECon for the second year in a row. This was our busiest conference so far. Clients and interested parties in the platform continue to give us lots of great feedback on improvements to make to the data and to the platform itself. We are currently looking at adding more reporting and map export functions. There are some other layers we are looking into adding that will help with site selection, and we have some great new ideas for ways to improve the Planned Grocery® iOS mobile app.