
15
Building Enterprise BI with Power BI Premium
For many organizations, the deployment of Power BI entails surfacing mission-critical KPIs over vast sets of data as well as empowering business users as part of a data culture. Power BI Premium is designed to meet these needs via a workload-based pricing model and scalable, enterprise-grade semantic modeling and reporting features.
While Power BI projects may begin as a proof-of-concept or as a self-service solution developed by a business analyst, the features exclusive to Power BI Premium capacity, such as large datasets, paginated reports, and the XMLA endpoint are often necessary to meet performance, scalability, and application life cycle needs of enterprise solutions.
Power BI Premium represents Microsoft’s flagship business intelligence suite, including a superset of Analysis Services semantic modeling features, a paginated reporting service offering the pixel-perfect enterprise reporting features of Reporting Services, and additional workloads including artificial intelligence and dataflows.
This chapter focuses on a review of the capabilities enabled by Power BI Premium capacities and the top considerations in provisioning and using this capacity. In addition, subjects such as life cycle management, data management, and disaster recovery are also addressed.
In this chapter, we will review the following topics:
- Power BI Premium
- Premium capacity nodes
- Premium capacity estimations
- Premium capacity administration and allocation
- Premium capacity resource optimization
- Life cycle management with Premium
Power BI Premium
Power BI Premium consists of dedicated capacity (hardware) that an organization can provision to host some or all of its Power BI content (datasets, reports, scorecards, and dashboards). As an alternative to the free clusters of capacity provided by Microsoft and shared by many organizations, Premium capacities are isolated to a specific organization and thus are not impacted by the use of Power BI by other organizations.
As flexible platform and software as a service (SaaS) architectures become the norm, organizations increasingly value the ability to focus their efforts on building the right solutions for their stakeholders with the appropriate amount of resources and with minimal to no infrastructure maintenance. Power BI Premium capacity aligns well with these new expectations as it enables an organization to provision and deploy enterprise-scale resources it requires in seconds and avoids the need to configure or maintain the underlying hardware
With Power BI Premium, organizations can utilize their provisioned capacity as needed and are not constrained by the limits imposed on shared (free) capacity, such as a max of 1 GB dataset sizes and eight (8) refreshes per day. Additionally, as a cloud service managed by Microsoft, organizations have great flexibility to scale, allocate, and manage Premium resources according to their preferred allocation methodology and changing requirements.
The top benefit of Power BI Premium is the ability to provide read-only access to Power BI Free users and thus cost-effectively scale Power BI deployments based on workloads rather than individual user accounts. This is particularly essential for large organizations with thousands of users, the majority of which only need the ability to infrequently view and optionally interact with content. Thus, an IT organization can assign a Power BI Free license to all users and decide which relatively small group of users should be assigned Power BI Pro licenses for developing and publishing content.
When Power BI content is hosted in a Premium capacity, the users consuming content such as via Power BI apps can view and interact with the content, such as making filter selections on a report or viewing a mobile-optimized dashboard on Power BI mobile applications without requiring a paid license. Thus, Power BI Premium enables organizations to limit the assignment of Power BI Pro users to those who create and distribute content.
Additionally, Power BI Premium capacity can be used to deliver Power BI content to users in applications and environments outside of the Power BI service. For example, Premium capacity can be used to embed Power BI visuals in custom applications, in other SaaS applications such as SharePoint Online, and to license Power BI Report Server (PBRS). Details regarding PBRS and alternative content distribution methods are included in Chapter 12, Deploying Paginated Reports, and Chapter 13, Creating Power BI Apps and Content Distribution, respectively.
The Premium capacity-based licensing model, which currently starts at $4,995 per month for a P1 SKU, implies the following three fundamental questions:
- How much Premium capacity should be provisioned?
- How should provisioned capacity be allocated?
- What can be done to minimize capacity utilization and thus resource costs?
Guidance and consideration of these questions are included in the following sections.
Premium Embedded (EM) SKUs, which are exclusive to embedding Power BI content in applications or services such as SharePoint Online, have a lower starting price point and fewer resources. EM SKUs were discussed in the Embedding section of Chapter 13, Creating Power BI Apps and Content Distribution. As most organizations will leverage the Power BI service and mobile apps for large-scale deployments, Power BI Premium P SKUs are the focus of this chapter.
Power BI Premium capabilities
Power BI Premium provides many additional capabilities beyond the ability to distribute content to read-only Power BI Free users. For example, Premium capacity or Premium Per User (PPU) licensing would be required to migrate SSRS, Cognos, or other similar types of reports to paginated reports in the Power BI service. Likewise, the limits of 1 GB of in-memory dataset size and only 8 refreshes per day may not be sufficient for many scenarios. Power BI Premium unlocks these resource limitations and exposes many other features, including artificial intelligence, and a rich suite of tool support via the XMLA endpoint.
Table 15.1 identifies additional features of Premium capacities as well as Premium Per User (PPU) licenses:
|
# |
Feature |
License Type |
|
1 |
Enable Power BI users to view content without a license |
Premium |
|
2 |
Licensing for Power BI Report Server (PBRS) |
Premium |
|
3 |
Multi-geo deployment |
Premium |
|
4 |
Bring your own key (BYOK) |
Premium |
|
5 |
Autoscale add-on |
Premium |
|
6 |
Increased model size limit of 100 GB (PPU) and 400 GB (Premium) |
Premium and PPU |
|
7 |
Paginated reports in the Power BI service |
Premium and PPU |
|
8 |
Advanced AI (AutoML and Azure Cognitive Services) |
Premium and PPU |
|
9 |
XMLA endpoint (read/write) |
Premium and PPU |
|
10 |
Enhanced dataflow functionality (enhanced compute engine, DirectQuery, linked, and computed entities) |
Premium and PPU |
|
11 |
Application life cycle management (pipelines) |
Premium and PPU |
|
12 |
100 TB maximum storage |
Premium and PPU |
|
13 |
Maximum scheduled refreshes of 48 times per day (note: refreshes can be more frequent using the API endpoint) |
Premium and PPU |
|
14 |
Backup and restore datasets |
Premium and PPU |
Table 15.1: Power BI Premium features
Some of the capabilities identified in this table enable completely new scenarios for projects involving Power BI datasets created with Power BI Desktop. For example, up to 400 GB datasets can be hosted in Premium capacity. Likewise, a dataset can be configured to refresh every 30 minutes in Premium capacity.
The integration of advanced artificial intelligence enables organizations to apply machine learning and other cognitive services models to their datasets, enabling predictive capabilities for categorization and regression as well as sentiment analysis, text analytics, and vision capabilities.
The ability to publish SQL Server Reporting Services (SSRS) reports, also referred to as paginated reports (RDL reports), to the Power BI service is especially valuable for organizations with significant SSRS investments. Without this capability, these organizations were previously required to deploy the Power BI Report Server (or an SSRS server), as described in Chapter 12, Deploying Paginated Reports.
Additionally, connectivity parity with Analysis Services, as provided by the XMLA endpoint, allows BI developers to utilize rich and familiar model development and management tools, including SQL Server Management Studio (SSMS), Tabular Editor, ALM Toolkit, DAX Studio, and Visual Studio, as they would with Analysis Services models. Additionally, the standard XMLA protocol allows for other popular BI reporting tools such as Tableau to leverage a Power BI dataset as a data source.
The dataflow capabilities enabled by the enhanced compute engine allow the use of DirectQuery in dataflows as well as incremental refreshes. The enhanced compute engine also drastically improves data refresh speeds when performing costly data transformation operations such as joins, distinct rows, and grouping. Finally, linked and computed entities enable the reuse of dataflows within other dataflows as well as the pre-aggregation of data into new tables, respectively.
To support the largest Power BI deployments, the multi-geo feature of Power BI Premium allows Premium capacities to be assigned to different regions, allowing datasets and reports to be located closer to users in different geographies and thus achieve a better overall performance.
Note that BYOK allows organizations to use their own encryption keys, making it easier to meet compliance requirements and exercise more control over their data assets, and that the 100 TB storage limit for Premium capacities is a per-capacity node.
Finally, the autoscale feature allows additional processing power to be added temporarily depending upon the load within the Premium capacity. Autoscaling allows Premium capacities to remain performant during peak load times.
Let’s now take a closer look at Power BI Premium capacities.
Premium capacity nodes
A Premium capacity node can be thought of as a fully managed server in the Azure cloud that runs the Power BI service, including all frontend and backend operations such as loading a report and refreshing a dataset, respectively. The capacity node is dedicated and isolated to the organization that provisioned the capacity, and the same user experience and functionality are delivered as the shared (free) capacity provided by the Power BI Service.
Each capacity node has a set of processing and memory resources (v-cores and RAM), bandwidth limits, and a cost that aligns with these resources. For example, a P1 capacity node includes 8 v-cores and 25 GB of RAM at a cost of $4,995 per month, while a P2 capacity includes 16 v-cores and 50 GB of RAM at a cost of $9,995 per month.
When workspaces containing Power BI content (datasets, reports, and dashboards) are assigned to Premium capacity nodes, the resources of the given capacity node are used to execute Power BI activities associated with this content, such as query processing and data refresh operations. Depending upon how Power BI datasets and results are architected, different resources are more important than others.
For example, if Power BI reports utilize a DirectQuery dataset or a live connection to an Analysis Services model, then the amount of RAM provided per capacity is much less important than the limits on the number of connections and the max page renders at peak times. In such deployments, the resources provisioned for the data source system (CPU cores, clock speed, and RAM), as well as the latency and bandwidth of the connection between the source system and the data center region of the Power BI tenant, would largely drive query performance.
The following table identifies the resources associated with the eight EM and P Premium capacity nodes currently available as well as their equivalent A capacities:
|
Capacity SKUs |
Total v-cores |
Backend v-cores |
Frontend v-cores |
RAM (GB) |
DirectQuery/ Live connections (per second) |
Max memory per query (GB) |
Model refresh parallelism |
|
EM1/A1 |
1 |
0.5 |
0.5 |
3 |
3.75 |
1 |
5 |
|
EM2/A2 |
2 |
1 |
1 |
5 |
7.5 |
2 |
10 |
|
EM3/A3 |
4 |
2 |
2 |
10 |
15 |
2 |
20 |
|
P1/A4 |
8 |
4 |
4 |
25 |
30 |
6 |
40 |
|
P2/A5 |
16 |
8 |
8 |
50 |
60 |
6 |
80 |
|
P3/A6 |
32 |
16 |
16 |
100 |
120 |
10 |
160 |
|
P4/A7 |
64 |
32 |
32 |
200 |
240 |
10 |
320 |
|
P5/A8 |
128 |
64 |
64 |
400 |
480 |
10 |
640 |
Table 15.2: Premium capacity nodes
The differences between P, EM, and A SKUs were discussed in the Embedding section of Chapter 13, Creating Power BI Apps and Content Distribution. As mentioned there, EM SKUs are exclusive to embedding Power BI content in external applications (custom, Teams, SharePoint) and do not support viewing the content in the Power BI service or Power BI mobile apps without a license.
Given their more limited workloads, EM SKUs have significantly fewer resources and cost less to provision. Premium P SKUs (P1, P2, P3, P4, P5), however, support both embedding content in applications and the usage of the Power BI Service. As shown in Table 15.2, the largest Premium capacity node (P5) includes 128 v-cores and 400 GB of RAM.
The dataset size limitation for Power BI Premium of 400 GB reflects the maximum amount of memory available within Premium capacity nodes. In other words, dataset sizes are limited based on the maximum amount of memory available within the capacity. For example, a P2 Premium capacity could support several 45 GB datasets but would not support a 55 GB dataset given its 50 GB limit.
This per-dataset limit associated with Premium Capacity Generation 2 represents a dramatic leap in scalability relative to the per-capacity limits of the first generation of Premium capacity. Keep in mind that some memory must be reserved for dataset refreshes and queries, and thus the maximum permitted dataset size may be smaller than the total amount of memory for the capacity.
Some of the limits in Table 15.2 only apply to certain dataset modes. For example, the DirectQuery/Live connections (per second), and Max memory per query (GB) are applicable to DirectQuery/Live mode connections, while Model refresh parallelism applies to import mode datasets. Model refresh parallelism refers to the number of objects (tables) that can be refreshed at the same time.
We now further explain additional columns in Table 15.2, specifically, the differences between frontend and backend resources.
Frontend versus backend resources
It’s important to understand the composition of frontend and backend resources in relation to Power BI workloads. For example, although a P2 capacity provides 16 total v-cores, only 8 backend cores are dedicated to processing queries, refreshing datasets, and the server-side rendering of reports.
Additionally, only the backend of a Premium capacity node, such as the 50 GB of RAM for a P2 capacity, is exclusive to the provisioning organization. If Power BI is only being used to create reports and dashboards against DirectQuery or Live connection sources, then these backend resources are less important and the connection limit (60 per second for a P2 capacity) would be the most relevant resource to understand and monitor.
The frontend cores (8 for a P2) are shared with other organizations in a pool of servers responsible for the web service, the management of reports and dashboards, uploads/downloads, and the user experience in navigating the Power BI service. Organizations that utilize Power BI datasets in the default import (in-memory) mode will want to ensure that sufficient RAM and backend cores are available to support both the data refresh process and the query workloads.
Figure 15.1 illustrates the distribution of frontend and backend resources for a Premium capacity node (P2):

Figure 15.1: Power BI Premium capacity node
As shown in Figure 15.1, the backend of a capacity node can be thought of as a dedicated server or virtual machine with a fixed amount of CPU and RAM. It’s the backend server that is responsible for the most resource-intensive or heavy lifting operations and thus should always be considered in relation to the resource needs of import mode datasets assigned to the given capacity.
In Power BI Premium Generation 1 (Gen1), the backend v-cores were reserved physical computing nodes dedicated to a particular Power BI Premium capacity. However, in Power BI Generation 2 (Gen2), these backend resources are physical nodes within regional clusters that service all Premium capacities within that region. This new architecture has significant advantages in terms of performance and monitoring.
For example, because the limitations of different capacity SKUs listed in Table 15.2 are no longer based on physical constraints, as they were in Gen1, but rather a set of rules that the Power BI service enforces, administrators no longer need to monitor their capacities as closely as before. Instead of monitoring capacities to observe whether the capacity was approaching the limits of its resources, administrators are instead simply notified when capacity limits have been reached, thus significantly reducing the overhead required by administrators to maintain optimal performance.
A factor of 2.5X (times) is generally used to size the RAM requirements of in-memory Power BI datasets. For example, a 10 GB Power BI dataset (.PBIX), would require 25 GB of RAM (10 * 2.5 = 25). This estimate is based on 10 GB to store the dataset in-memory, another 10 GB for a copy of the dataset that is created during full refresh/processing operations, and an extra 5 GB to support temporary memory structures that can be required to resolve user queries.
Note that this example is exclusive to import mode datasets hosted in the Power BI Premium capacity (the backend resources). A separate architecture and considerations for capacity nodes apply when query requests are routed to Analysis Services models via Live connection or a DirectQuery data source such as Teradata or SAP HANA.
From a Premium capacity perspective, in these scenarios, the BI team would need to determine via load testing and the usage metrics described in the Monitoring Premium capacities section later in this chapter whether the query throughput limit (DirectQuery/ Live connections per second from Table 15.2) to these sources is sufficient. If this throughput level is sufficient, yet performance is still unacceptable, several other components of the overall solution could represent the performance bottleneck and could be evaluated separately.
The other components or factors impacting performance include the design of the data model, the efficiency or complexity of DAX measures, the design of the data source, the design of Power BI reports (for example, quantity and type of visuals), the resources and performance of the gateway server(s) if applicable, the network connection between the Power BI service and the data source, and the level of user interactivity with reports.
Techniques and practices to optimize data models and the visualization layer in Power BI are provided in the Data model optimizations and Report and visualization optimizations sections later in this chapter, respectively.
With the basics of Premium capacities understood, we next turn our attention to answering one of the three primary questions regarding Premium capacities introduced at the beginning of this chapter: how much Premium capacity should be provisioned?
Premium capacity estimations
The volume of factors involved in Premium capacity utilization makes it difficult to forecast the amount of Premium capacity (and thus cost) required. This complexity is particularly acute for large deployments with diverse use cases to support.
Additionally, for organizations relatively new to Power BI, the level and growth of user adoption, as well as the requirements for future projects, can be unclear. In the past, Microsoft provided an online tool to estimate which capacities would be needed for estimated workloads. However, that online tool no longer exists. Instead, use the guidance in this section to estimate Premium capacity requirements and then use the Monitoring Premium capacities section later in this chapter to determine whether additional resources are necessary.
Recall from the previous section that the important capacity limits from Table 15.2 vary per dataset storage mode and usage. Available RAM is highly important to import mode datasets while somewhat less important for DirectQuery/Live datasets. Also, consider that resource requirements are not simply defined based on the number of concurrent users.
For example, 1,000 users viewing a single report with one visual is vastly different from 1,000 users viewing 100 reports, each with 10 different visuals. Add to this the variability of resource requirements based upon the complexity and efficiency of data transformation operations and/or DAX calculations as well as RLS rules and it is easy to understand the complexity of providing clear estimates in all circumstances.
For import models, it is important to realize that these models must be fully loaded into available memory in order to facilitate refreshing and querying. In addition to the size of these data models, it is important to consider how many active, heavily used, data models will exist within the capacity. Enough memory should be available to allow all such datasets to be loaded into memory at the same time in order to maximize performance.
Referencing the 2.5X factor mentioned in the last section, thus, if two 10 GB datasets are heavily used by the organization, then this would require a total of 50 GB or a P2 node. Alternatively, organizations may instead choose to deploy two P1 nodes and dedicate a dataset to each node. By using multiple capacities, organizations can isolate workloads and thereby guarantee resources for priority datasets and reports.
Import mode datasets are also constrained by the model refresh parallelism (how many models can be refreshed simultaneously), but in Gen2 are no longer constrained by the number of concurrent refreshes. In Gen1, the maximum number of concurrent refreshes was 1.5X the number of backend v-cores, rounded up.
For DirectQuery and Live connection datasets, the DirectQuery/Live connections per second and maximum memory per query are two primary constraints, but also consider that these datasets can require significant v-core resources and even memory when evaluating complex RLS rules and DAX measure calculations.
Finally, dataflows and paginated reports.
Given the complexity of estimating required capacity sizes, a fiscally conservative approach would be to develop initial assets as part of shared capacity. Subsequently, the organization could purchase equivalent A SKUs for test purposes, which is why the A SKUs were included in Table 15.2.
A SKUs are charged on an hourly basis and require no minimum commitment. These A SKUs are thus an inexpensive way to load test workloads. Load testing can be executed using a PowerShell script or, for more complex scenarios, performed within Visual Studio. The Power BI Dedicated Capacity Load Assessment Tool can be downloaded from the following link: https://bit.ly/3tG66aR.
Power BI Embedded A SKUs can be purchased within the Azure portal, while Power BI EM and P SKUs are purchased within the Microsoft 365 Admin Center under the Billing section.
With an approach to capacity estimation provided, we next turn our attention to capacity administration and the second of the three primary questions regarding Premium capacities introduced at the beginning of this chapter: how should provisioned capacity be allocated?
Premium capacity administration and allocation
One of the most important responsibilities of a Power BI administrator is the management of Power BI Premium capacities. From a Power BI administration perspective, Power BI Premium can be thought of as an organization’s dedicated hardware resources to support the use of the Power BI service.
Not all of an organization’s content needs to be hosted in Premium capacity. However, these resources enable the distribution of content to read-only Power BI Free users and they provide more consistent performance, among other scalability and management benefits.
Microsoft 365 global administrators and users assigned to the Power BI service administrator role automatically have the right to administer Premium capacities in the Power BI admin portal. An administrator’s role in relation to Premium capacity is to ensure that the provisioned resources are utilized according to the organization’s policies, and that sufficient resources are available to support the existing workload.
Power BI Premium administrators should be familiar with the following list of responsibilities:
- Create a new capacity with the available (purchased) v-cores
An organization may choose to dedicate a Premium capacity to a specific project or application. In other scenarios, one capacity could be dedicated to self-service projects while another capacity could be used by corporate BI projects.
- Grant capacity assignment permissions to users or security groups of users
This enables Power BI Pro users who are also administrators of workspaces to assign their workspaces to Premium capacity. This setting can also be disabled or enabled for the entire organization.
- Assign workspaces to Premium capacity, or remove a workspace from Premium capacity, in the Power BI admin portal
This is an alternative and complementary approach to capacity assignment permissions. Power BI service administrators can manage existing capacities and assign workspaces in bulk. These bulk assignments can be by user, by a security group of users, or for the entire organization.
- Monitor the usage metrics of Premium capacities to ensure sufficient resources are available
An app is available for monitoring Premium capacities. More information about this app can be found at the following link: https://bit.ly/3EmzbPu.
- Change the size of an existing capacity to a larger (scale up) or smaller (scale down) capacity node
As more users and content utilize a specific capacity, it may be necessary to scale up or allocate certain workspaces to a different Premium capacity or shared (free) capacity.
- Assign a user or group of users as capacity administrators for a capacity
This can be appropriate to support large, enterprise deployments with multiple capacities and many app workspaces.
Given the importance of performance to any BI project, as well as the cost of Power BI Premium capacities, BI/IT teams need to plan for an efficient, manageable allocation of Premium capacity. This allocation plan and any project-specific decisions need to be communicated to the Premium administrator(s) for implementation. The following sections describe the responsibilities identified here and related considerations in greater detail.
Capacity allocation
Power BI Premium provides organizations with significant flexibility for both allocating their resources to Premium capacities, as well as assigning Power BI content to those capacities.
Although it’s possible to broadly assign all workspaces (and thus all content) of an organization to a single Premium capacity, most organizations will want to efficiently allocate and manage these resources.
For example, certain Power BI reports and dashboards that are utilized by executives or which contribute to important business processes might be identified and prioritized for Premium capacity. In an initial deployment of a Premium capacity, a BI/IT team may exclusively assign the workspaces associated with content considered mission-critical to this capacity. This capacity may remain isolated to the specific workload(s) or, based on testing and monitoring, the BI team may determine that sufficient resources are available to support additional workspaces and their associated resource requirements.
Similar to provisioning a Premium capacity exclusive to high-value content, a Premium capacity may be provisioned due to the unique requirements of a particular solution. As one example, a new Power BI dataset may be developed that represents a data source or business process not currently supported in the data warehouse. In this scenario, a large import mode Power BI dataset, perhaps initially developed by the business team, would serve as the source for reports and dashboards that require distribution to many Power BI Free users or even the entire organization. Given these characteristics, a Premium capacity node could be provisioned and dedicated to the app workspace hosting this dataset and its visualizations so that no other solution could impact its performance.
A single Premium capacity can be provisioned and created for an organization, or, for larger and more diverse deployments, multiple Premium capacities can be created with different sizes (CPU, memory, bandwidth) appropriate for their specific workloads.
In terms of allocating resources to Premium capacities, an organization is only limited by the number of virtual cores (v-cores) that have been purchased. For example, an organization could initially purchase a P2 capacity, which includes 16 v-cores. Once purchased, a P2 capacity could be created in the Capacity settings page of the Admin portal that utilizes all of these cores. However, at some later date, this capacity could be changed to a P1 capacity that only uses 8 v-cores. This would allow the organization to create a second P1 capacity given the 8 remaining v-cores available. Alternatively, a second P2 capacity could be purchased, providing another 16 v-cores. With 32 total v-cores purchased by the organization, an existing P2 capacity could be increased to a P3 capacity (32 v-cores).
Figure 15.2 illustrates this example of capacity allocation:
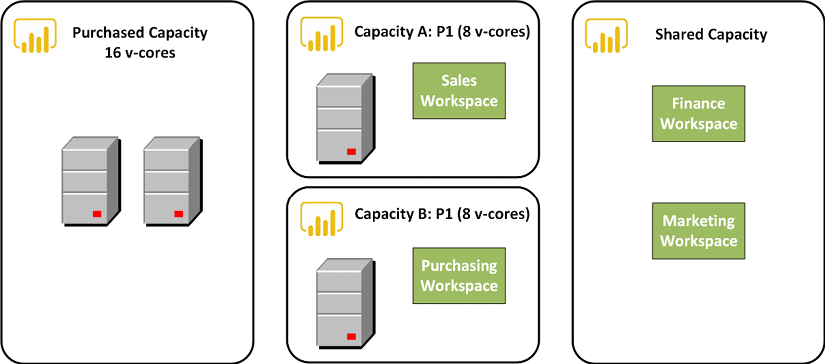
Figure 15.2: Power BI Premium capacity allocation
Regardless of the Premium SKU (P1, P2, P3, P4, or P5), the combination of SKUs purchased in the Microsoft 365 admin center, or the number of specific SKUs (instances), an organization can use the total number of v-cores purchased as it wishes. For example, purchasing a P3 SKU provides 32 v-cores, the same as purchasing four instances of a P1 SKU (8 X 4 = 32).
For organizations getting started with Power BI and that are comfortable with actively managing their Premium capacities, individual instances of the P1 SKU with no annual commitment (month-to-month) could make sense. For example, a single P1 instance could be purchased to start and then, if it’s determined that more resources are needed, a second P1 instance could be purchased, making 16 cores available for either a P2 capacity or two P1 capacities.
In this diagram, an organization has chosen to isolate the sales and purchasing workspaces to their own P1 capacities with eight v-cores each. This isolation ensures that the resources required for one workspace, such as the user’s connection to the Sales app, do not impact the other workspace (Purchasing). Additionally, the Finance and Marketing workspaces have been left in shared (free) capacity for now but could later be assigned to Capacity A or Capacity B if sufficient resources are available.
Whether Power BI workspaces are allocated to Premium capacity or shared capacity is transparent to end users. For example, the same login and content navigation experience in the Power BI service and Power BI mobile apps applies to both Premium and shared capacity. Therefore, organizations can selectively allocate certain workspaces, such as production workspaces accessed by many Power BI Free users, to Premium capacity while allowing other small or team workspaces to remain in the shared capacity.
The following section describes a capacity planning method.
Corporate and Self-Service BI capacity
As described in the Data governance for Power BI section of Chapter 14, Administering Power BI for an Organization, certain projects will likely be wholly owned by the BI/IT team, including the report and visualization layer. Other projects, however, may be owned by business units or teams but still require or benefit from IT-provided resources, such as the on-premises data gateway and Premium capacity.
The BI team can manage a continuous life cycle over both project types (Corporate BI, Self-Service BI) by validating use cases or requirements for Premium capacity. Additionally, the migration of Power BI content across distinct Premium capacities could become part of a standard migration process from a self-service solution to a corporate BI-owned solution.
The provisioning and allocation of Power BI Premium capacity can further reflect an organization’s support for both Corporate and Self-Service BI solutions. Typically, the Power BI content created and managed by IT is considered mission-critical to the organization or is accessed by a high volume of users. Self-service BI solutions, however, tend to utilize smaller datasets and usually need to be accessible to a smaller group of users.
In the following example shown in Figure 15.3, the allocation includes two Premium capacities, a P3, and a P2, dedicated to Corporate BI Capacity and Self-Service BI Capacity content, respectively:

Figure 15.3: Power BI Premium Capacity allocation: Corporate and Self-Service BI
As shown in Figure 15.3, the Sales and Finance workspaces have been assigned to a P3 capacity dedicated to corporate BI solutions.
The Human Resources and Purchasing workspaces, however, have been assigned to a P2 Premium capacity dedicated to self-service BI projects. For example, certain Power BI Pro users in these departments have developed datasets and reports that have proven to be valuable to several stakeholders. The assignment of these workspaces to Premium capacity enables these users to make this content accessible to a wider audience, such as the 20 Power BI Free users in the Purchasing department.
Remember that not all workspaces need to consume Premium capacity resources. A team of Power BI Pro users may collaborate within a workspace and still be effective with the content hosted in shared capacity. Premium capacity is only needed in scenarios requiring broad distribution to read-only Power BI Free users or when the additional capabilities (for example, large datasets) identified in the Power BI Premium capabilities section earlier in this chapter are required.
In the event that one of the self-service solutions needs to be migrated to the corporate BI team, the BI team could re-assign the workspace to the existing P3 capacity. Alternatively, to avoid consuming any additional resources of the existing P3 capacity and potentially impacting these workloads, a new corporate BI capacity could be created for the workspace or the capacity expanded to a P4.
BI teams consistently need to evaluate the trade-offs involved with isolating projects/solutions to specific Premium capacities. Assigning a single workspace or multiple related workspaces to a dedicated capacity ensures that no other project or activity impacts performances. However, many dedicated Premium capacities may become onerous to manage and could be an inefficient use of resources if the Power BI workload doesn’t fully utilize the resources.
Ultimately, teams will need to monitor capacity resource utilization and either re-allocate and re-assign capacities and workspaces, respectively, or provision additional Premium resources (v-cores) and scale up existing capacities. Scaling up and scaling out activities are discussed in the next section, which covers creating, sizing, and monitoring capacities.
Create, size, and monitor capacities
Microsoft 365 global admins and Power BI service administrators can view, create, and manage all Power BI Premium capacities via the Admin portal, as discussed in Chapter 14, Administering Power BI for an Organization.
In Figure 15.4, the Capacity settings page from the Admin portal is shown:

Figure 15.4: Admin portal’s Capacity settings page
As shown in Figure 5.4, 16 v-cores have been provisioned for the organization and a single P1 capacity has been created, which consumes half of these cores.
A Set up new capacity button is located above the list of Premium capacities that have been configured. Clicking the Set up new capacity button launches a setup window, as shown in Figure 15.5:

Figure 15.5: Set up new Premium capacity
In this example, eight v-cores are available for the new capacity, and thus a P1 capacity requiring eight v-cores can be created. The capacity is named and the capacity administrator(s) for the new capacity are defined.
The Capacity size dropdown exposes all capacity sizes, but sizes requiring more v-cores than the volume of v-cores currently available cannot be selected. Once these properties are configured, click the Create button to complete the process.
Note that the Capacity size and Capacity admins properties are required to set up the new capacity. Each capacity must have at least one capacity admin, who has full administrative rights to the given capacity. These users do not have to be a Microsoft 365 global admin or a Power BI service administrator. Users assigned as capacity administrators have the same administrative rights to the given capacity as Power BI service administrators, such as the ability to change capacity sizes, assigning workspaces to the capacity as well as user assignment permissions.
For example, a Power BI Pro user could be assigned as a capacity admin and could access this capacity via the Admin portal just like a Power BI admin. However, only the capacities for which the user is a capacity admin would appear on the Capacity settings page. Additionally, other pages of the Admin portal, such as Tenant settings, would not be visible or accessible to the capacity admin.
As mentioned, capacity admins are capable of changing capacity sizes and settings, so let’s look at those topics next.
Changing capacity size
At some point after a capacity has been created, it may be necessary to change the size of the capacity. For example, given the increased adoption of Power BI, the P1 SKU may be insufficient to support the current workload, and thus an additional eight v-cores could be purchased with the intent to scale up the existing capacity to a P2 capacity size (16 v-cores). Alternatively, an administrator may wish to view the recent utilization of a Premium capacity to help determine whether additional app workspaces can be assigned to the capacity.
To change a capacity size and to view the utilization for a capacity, click the name of the capacity from the Capacity settings page shown in Figure 15.4. In Figure 15.6, a capacity was selected and then the Change size button clicked in order to expose the Change size pane:

Figure 15.6: Changing the capacity size
The Change size pane contains a dropdown used for setting the capacity size. In this scenario, eight additional v-cores are available, meaning that the P1 capacity could be changed to a P2 capacity in just a few clicks.
Alternatively, instead of changing sizes manually, as shown in Figure 15.6, an option exists to autoscale Premium capacities. Autoscaling is an optional feature with an additional cost that allows capacities to automatically scale up by adding additional v-cores once certain thresholds are exceeded. Using autoscale can help ensure optimal performance during peak hours. Additional information about autoscale can be found at the following link: https://bit.ly/3J2bb4S.
With the creation and sizing of capacities understood, we next look at monitoring Premium capacities.
Monitoring Premium capacities
As mentioned previously, Gen2 of Power BI Premium capacities has reduced the need to constantly monitor capacity nodes since the performance of backend resources are no longer physically constrained.
That said, it is still important to monitor capacities in order to identify problematic queries or datasets and reports receiving increased traffic.
An app is available for monitoring all capacities to which a user is a capacity admin. This app is available in AppSource as the Power BI Premium Capacity Utilization and Metrics app, as shown in Figure 15.7:

Figure 15.7: Changing capacity size
This app allows capacity admins to understand the usage of datasets, dataflows, paginated reports, and other content within Power BI Premium Gen2 capacities, as well as important metrics such as memory utilization and v-core processing time. A link to the app is included under the Capacity usage report section of the settings for a capacity. Additional information about this app is available at the following link: https://bit.ly/377d0Qu.
In addition to the monitoring of utilization and metrics, Premium capacities also include the ability to send notifications when certain important metrics have been reached or exceeded. This is done in the notifications section after clicking on a specific capacity from the Capacity settings page of the Admin portal, as shown in Figure 15.8:

Figure 15.8: Notification settings
As shown in Figure 15.8, instead of the constant need to monitor capacities typical of Gen1, Gen2 allows for less rigorous monitoring via notifications. Capacity admins can choose thresholds for notifications as well as for important events such as autoscaling.
Let’s next take a look at assigning workspaces to capacities.
Workspace assignment
Just as organizations have the flexibility to allocate their purchased v-cores across one or multiple Premium capacities, there are also multiple options for assigning workspaces to Premium capacity.
To bulk assign multiple workspaces to a capacity within the Admin portal, navigate to a specific capacity by clicking on the capacity name from the Capacity settings page of the Admin portal, expand the Workspaces assigned to this capacity section, and then click the Assign workspaces link, as shown in Figure 15.9:

Figure 15.9: Assigning workspaces
Clicking this link exposes the Assign workspaces pane as shown in Figure 15.10:

Figure 15.10: Assign workspaces pane
As shown in Figure 15.10, all workspaces for the entire organization can be bulk assigned to the capacity. In addition, specific workspaces or all workspaces created by specific users can also be assigned. If applied to specific users, any existing workspaces assigned to those users, including workspaces already in a separate capacity, will be moved to the capacity assigned.
As an alternative or complementary approach to assigning workspaces in the Admin portal, administrators of a capacity can also grant users or groups of users permission to assign workspaces to Premium capacity. This is done in the Contributor permissions section for a capacity. In Figure 15.11, a user (gdeckler) is granted contributor permissions to a Premium capacity:

Figure 15.11: Contributor permissions
Users granted this permission will also require administrative rights to any workspace they wish to assign to Premium capacity. Workspace assignment is performed by workspace administrators via the Premium tab of the Setting pane for a workspace, as shown in Figure 15.12:

Figure 15.12: Assigning to Premium per capacity
The differences between workspace administrators and members were described in the Workspace roles and rights section of Chapter 10, Managing Workspaces and Content.
This completes our coverage of the administration and allocation tasks for Premium capacities. We now turn our attention to the final primary question regarding Premium capacities introduced at the beginning of this chapter: what can be done to minimize capacity utilization and, thus, resource costs?
Premium capacity resource optimization
Given the cost of Premium capacity, BI teams will want to follow practices to ensure that these resources are actually required and not being used inefficiently. For example, with large import mode datasets, a simple design change such as the removal of unused columns from a fact table can significantly reduce the size of the dataset and, hence, the amount of memory needed.
By following a series of recommended practices in terms of both modeling and report design, fewer Premium capacity resources will be required to deliver the same query performance and scale. With small-scale self-service BI datasets and reports, performance tuning and optimization are usually not necessary. Nonetheless, as these models and reports can later take on greater scale and importance, a basic review of the solution can be applied before the content is assigned to Premium capacity.
The following two sections identify several of the top data modeling and report design practices to efficiently utilize Premium capacity resources.
Data model optimizations
For many data models, particularly those that were developed as part of pilot projects or by business users, a number of modifications can be implemented to reduce resource requirements or improve query performance. Therefore, prior to concluding that a certain amount of Premium capacity is required, data models can be evaluated against a number of standard design practices and optimization techniques such as the following:
- Avoid duplicate or near-duplicate data models
Design and maintain a consolidated, standardized dataset (data model) of fact and dimension tables that can support many reports. Multiple datasets that represent near duplicates of the same source data and logic will require their own resources for refreshes and will also be difficult to manage and maintain version control.
- Remove tables and columns that aren’t needed by the model
For import mode models, columns with unique values (cardinality) will be the most expensive to store and scan at query time. The Fact table columns section of Chapter 4, Designing Import, DirectQuery, and Composite Data Models provides examples of avoiding derived columns that, for import mode models, can be efficiently implemented via DAX measures.
- Reduce the precision and cardinality of columns when possible
If four digits to the right of the decimal place are sufficient precision, revise a column’s data type from a Decimal number to a Fixed decimal number (19, 4). Apply rounding if even less precision is required. Split columns containing multiple values, such as a datetime column, into separate columns (date and time).
- Limit or avoid high cardinality relationships, such as dimension tables with over 1.5 million rows
Consider splitting very large dimension tables into two tables and defining relationships between these tables and the fact table. The less granular table (such as Product Subcategory grain) could support most reports while the more granular table (such as Product) could be used only when this granularity is required.
- Avoid expensive DAX measures
Avoid measures that require a high volume of context transitions (from row to filter context) or that cause an unnecessary number of evaluations. For example, only define DAX variables that will always be required for the expression and that can be used to replace other expressions. Additionally, rather than embedding complex logic in measures, particularly logic that involves materializing large temporary tables or iterating over large tables, look for opportunities to revise the model such as with new attributes to keep the DAX measures simple and efficient.
- Use whole number (integer) data types instead of text data types whenever possible
- If the data model uses a DirectQuery data source, optimize this source
For example, implement indexes or columnar technologies available, such as the Clustered Columnstore Index for SQL Server. Additionally, ensure that the source database supports referential integrity and that the DirectQuery model assumes referential integrity in its defined relationships. This will result in inner join queries to the source. Additionally, consider whether an in-memory or even a DirectQuery aggregation table could be used to improve the performance of common or high priority report queries.
- Avoid or limit DISTINCTCOUNT() measures against high cardinality columns
For example, create the
DISTINCTCOUNT()measure expression against the natural key or business key column identifying the dimension member (such as Customer ABC), rather than the columns used in the fact-to-dimension relationship. With slowly changing dimension processes, the relationship columns could store many more unique values per dimension member and thus reduce performance. Additionally, if a slight deviation from the exact result is tolerable, theAPPROXIMATEDISTINCTCOUNT()function can be considered a more performant alternative toDISTINCTCOUNT(). - Avoid the use of calculated DAX columns on fact tables
Create these columns in the source system or in the queries used to load the model to allow for better data compression. For DirectQuery models, avoid the use of DAX calculated columns for all tables.
In addition to dataset optimizations, it is also important to consider report and visualization optimizations.
Report and visualization optimizations
A well-designed analytical model with ample resources can still struggle to produce adequate performance due to an inefficient visualization layer. The following list of techniques can be applied to Power BI reports and dashboards to reduce the query workload and avoid slower resource-intensive queries:
- Create dashboards on top of reports to leverage cached query results representing the latest data refresh
Unlike dashboards, report queries are sent and executed on the fly when Power BI reports are loaded. Multiple dashboards can be linked together as described in Chapter 9, Designing Dashboards. If the dataset uses a DirectQuery or Live connection, take advantage of the scheduled cache refresh, as described in the Dashboard cache refresh section of Chapter 11, Managing the On-Premises Data Gateway.
- Avoid report visuals that return large amounts of data such as tables with thousands of rows and many columns
Report visuals that require scrolling or which represent a data extract format should be filtered and summarized. Report visuals that return more data points than necessary to address their business question can be modified to a lower granularity.
For example, a dense scatter chart of individual products could be modified to use the less granular product subcategories column.
- Ensure that filters are being applied to reports so that only the required data is returned
Apply report-level filters to only return the time periods needed (such as current year and last year). Use visual-level filters such as a top N filter, as described in the Visual-level filtering section of Chapter 8, Creating and Formatting Visualizations.
- Limit the volume of visuals used on a given report page
Optionally, remove the interactions between visuals (cross-highlighting) to further reduce report queries.
- Understand which DAX measures are less performant and only use these measures when required
For example, only use expensive measures in card visuals or within highly filtered visuals exposing only a few distinct numbers.
Following these best practices for reports will help optimize the use of Premium capacity resources. In addition, the capacity settings themselves can be tuned in order to optimize resource workloads.
Workloads
Power BI Premium was originally exclusive to datasets but has been expanded to include three additional workloads: Paginated Reports, AI, and Dataflows. Power BI administrators have the option of configuring settings specific to each of these workloads. Workloads settings are available for Premium capacities in the Workloads section after navigating to a specific capacity from the Capacity settings page of the Admin portal. These settings are shown in Figure 15.13:

Figure 15.13: Workloads settings
Configuring Premium capacity workload settings is an important tool for ensuring that Premium capacity resources are being allocated to the highest priority workloads and to avoid or mitigate the impact of inefficient or resource-intensive queries and artifacts on the overall Premium capacity.
For example, setting threshold values for both the Query Memory Limit % and the Max Result Row Set Count dataset settings can help avoid capacity resources being allocated to poorly designed queries or ‘data extract’ style reports. Likewise, the Minimum refresh interval dataset setting can be used to avoid report authors from configuring reports that would generate a high and unnecessary volume of queries against a DirectQuery source system. Additional information on Workloads can be found at the following link: https://bit.ly/379PEK3.
The three primary questions regarding Premiums capacities have now been covered. However, there are additional secondary considerations for Premium capacities, such as life cycle management.
Life cycle management with Premium
In addition to the enhanced life cycle management capabilities of Power BI Premium described in the Power BI deployment pipelines section of Chapter 10, Managing Workspaces and Content, the write capabilities of the XMLA endpoint enable additional capabilities with regard to life cycle management of datasets assigned to Premium capacities.
Specifically, given the write capabilities of the XMLA endpoint, the recommended tool for deploying incremental changes to datasets becomes the ALM Toolkit from MAQ Software, which is based on the BISM Normalizer by Christian Wade.
ALM Toolkit deployment
ALM Toolkit is a free, open source tool that enables the object-level comparison of source and target datasets and the incremental deployment of changes such as new or revised DAX measures. ALM Toolkit can be downloaded from http://alm-toolkit.com.
Once downloaded, simply run the .msi installer file to install. After installation, ALM Toolkit is available from the External tools tab of Power BI Desktop, as shown in Figure 15.14:

Figure 15.14: ALM Toolkit as available through External Tools
Open a Power BI Desktop file and then launch ALM Toolkit from the ribbon on the External tools tab. Once opened, click the Compare button to display the Connections dialog shown in Figure 15.15:

Figure 15.15: ALM Toolkit Connections dialog
As shown in Figure 15.15, the local dataset open in Power BI Desktop serves as the Source and is compared with a Target dataset in the Power BI service. Clicking the OK button compares the Target with the Source in order to ascertain any differences between the data models.
As shown in Figure 15.16, a new measure, New Account Measure, has been added to the local data model but does not exist in the Target dataset published to the Power BI service.

Figure 15.16: ALM Toolkit comparison of data models
Use the Select Actions dropdown shown in Figure 15.16 to select Create all objects Missing in Target, as shown in Figure 15.17:

Figure 15.17: ALM Toolkit Select Actions dropdown
Next, click the Validate Selection button and, once validated, click the OK button. Finally, click the Update button to deploy the changes to the published dataset in the Power BI service.
In this example, changes made by a developer to a local copy of the Power BI Desktop (.pbix) file were deployed to a workspace assigned to the Development stage of a Power BI Deployment pipeline. As discussed in the Power BI deployment pipelines section of Chapter 10, Managing Workspaces and Content, these changes could then be promoted to the workspace assigned to the Test stage and finally, to the Production stage.
Using ALM Toolkit to deploy changes to Power BI datasets is particularly important when using incremental refresh. Incremental refresh creates an additional partition within the dataset for each incremental refresh cycle. In addition, because of this, datasets using incremental refresh cannot be downloaded from the Power BI service.
Without the use of ALM Toolkit, if model changes are required, the local Power BI Desktop file would need to be fully refreshed and then republished to the Power BI service, removing all incremental refresh partitions and effectively “starting over” with regard to incremental refreshes. For large, complex data models, this could be a costly and time-consuming exercise, especially if only minor changes have been made.
Additionally, there’s often a scenario in which certain objects in the source dataset, such as query parameters, need to remain different than the target dataset. ALM Toolkit makes it easy to exclude certain differences and deploy only the changes required.
Documentation for ALM Toolkit can be found at the following link: https://bit.ly/3f95ODQ.
We next take a look at another life cycle scenario enabled by the XMLA endpoint.
Dataset management with SSMS
With the XMLA endpoint feature of Power BI Premium, it is possible to connect to datasets published to the Power BI service from within SQL Server Management Studio (SSMS). To accomplish this, follow these steps:
- First, open Settings for a workspace and navigate to the Premium tab, as shown in Figure 15.18:

Figure 15.18: Premium Workspace Connection
- Use the Copy button to copy the workspace connection
- Open SSMS
- In the Connect to Server dialog, choose Analysis Services in the Server type field and paste the copied connection string into the Server name field, as shown in Figure 15.19:

Figure 15.19: SQL Server Connection
- As shown in Figure 15.19, choose Azure Active Directory - Password in the Authentication field, enter a username and password, and then click the Connect button
- The datasets published to the workspace are available in the Object Explorer pane of SSMS, as shown in Figure 15.20:

Figure 15.20: SSMS Object Explorer
The datasets within the workspace can now be managed within SSMS as if they were any other Analysis Services tabular cube.
For example, the data warehouse team might need to reload the entire sales history for the past 5 years to correct an issue found by an external audit. However, the incremental refresh policy in Power BI is only loading the last 1-2 months’ worth of data. Using SSMS via the XMLA endpoint, the older partitions can be manually refreshed for the historical data by viewing the partitions for the dataset, as shown in Figure 15.21:

Figure 15.21: Partitions within SSMS
Note that PowerShell scripts and the SqlServer PowerShell module can also be used as a means to handle these custom refresh scenarios and to potentially supplement incremental refresh policies managed by Power BI.
We will now look at a final topic regarding the life cycle of Premium capacity datasets – backup and restoration.
Backing up Premium capacities
The release to general availability (GA) support for backing up and restoring Power BI Premium and PPU datasets closed an important gap with Analysis Services and also provides a mechanism for migration from an Analysis Services model to Power BI Premium.
Either SSMS or the Analysis Services cmdlets for PowerShell can be used to back up and restore datasets published to the Power BI service using the XMLA endpoints. For example, once connected to a Power BI workspace, as explained in the previous section, the Back Up and Restore options become available for datasets published to Premium capacities, including PPU workspaces, as shown in Figure 15.22:

Figure 15.22: Back Up and Restore options for datasets
To use the Back Up and Restore features, you must register an Azure Data Lake Gen2 (ADLS Gen2) storage account for the tenant or at the workspace level. These settings were discussed in the Azure connections section of Chapter 14, Administering Power BI for an Organization. Offline backups can be obtained by using Azure Storage Explorer to download backup files from the connected ADLS Gen2 storage.
Backups performed place backup files (.abf files) into a power-bi-backup container within the ADLS Gen2 storage container. A folder is created in this container with the same name as the workspace. In the event that a workspace is renamed, the corresponding backup folder is also automatically renamed to match. To conduct a restore, the backup files must also be placed in that same folder.
Workspace users who have write or administrator permissions can perform backups of datasets within that workspace. This includes users who are members of the admin, member, and contributor roles discussed in the Workspace roles and rights section of Chapter 10, Managing Workspaces and Content. In addition, users with direct write permissions to a dataset can back up that dataset. Only workspace admins, members, and contributors can restore a dataset.
As mentioned, the ability to back up and restore datasets published to the Power BI service enables a migration path for Analysis Services workloads. In addition, backup and restore operations might be undertaken in the event of tenant migration, data corruption, or for regulatory-based data retention requirements.
This concludes our analysis of life cycle management for Premium capacities as well as our exploration of building enterprise BI with Power BI Premium.
Summary
This chapter reviewed Power BI Premium as the primary means to deploy Power BI at scale and with enterprise BI tools and controls. The features and administration of Power BI Premium were described, as well as the factors to account for inefficiently provisioning and allocating Premium capacity. Finally, life cycle management concerns particular to Premium capacity features were explored.
This book has been all about how to enable enterprise-level business intelligence using Power BI, and this chapter highlighted some of the exclusive features that Power BI Premium provides in pursuit of this goal. We hope you have enjoyed this book and are now confident in how to apply this knowledge within your own organization.
Join our community on Discord
Join our community’s Discord space for discussions with the author and other readers: https://discord.gg/q6BPbHEPXp
