
Some troubleshooting and debugging tools show numbers in hex and some in decimal even for things that are traditionally hex, for example PID and TID. Then, when getting data from one program we need to convert it to a different base for another tool. So over some time it is possible to get an idea of what hex numbers usually are even if they don't have hexadecimal 'A'-'F' in their digits. For example, in one log we got this output:
Parent changed to 393954
Although this number is a valid hex number as well as a decimal we had the intuitive feeling that it was decimal... Checking source code of the tool revealed that it was output as decimal indeed.
Recently I was asked how to measure complexity of technical support cases especially ones that require memory dump analysis. My first response was that it is a subjective qualitative measure based mostly on experience and feeling. However, after careful consideration, I understood that nothing has changed for many years: the nature and causes of system or application hangs and crashes still the same regardless of OS types and versions. Therefore the complexity measure shifts from a case description and its artefacts to an analyst, a memory dump reader. Here the number of queries, questions asked or commands executed to gather information for analysis, can be a good approximation to the measure of complexity. For example, many years ago I started with a few commands like !analyze -v, kv and dd and progressed to an elaborate check-list (Appendix B). Here the natural logarithm_can be used to approximate the measure:
C = ln (Ndc), where Ndc is the number of debugging commands used.
Initially, the complexity was ln (3) ≈ 1.1 and now, if someone uses 10 commands on average or asks 10 questions, the complexity is ln (10) ≈ 2.3. The analysis is more than 2 times complex than it was.
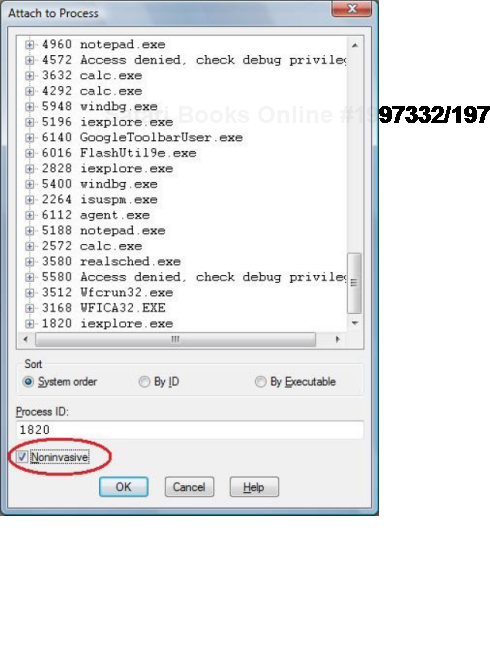
One question often asked is to how to simulate a process hang. One method that we found is to attach WinDbg noninvasively, freeze all threads by executing the following command:
and then quit by using q command. This leaves an application or a service process in a total hang state.
A local browser crashed when doing copy-paste of an RTF text into an HTML editor window. The dump was not saved because logging was set up as described in Volume 2, page 38 (and the script didn't include .dump commands).
Looking at stack trace we noticed that the crash happened during HTML processing (call arguments are removed for visual clarity):
STACK_TEXT:
0476de3c 6970d597 html!FPseudoStyleBis+0x26
0476de48 69703b0e html!BisFromLpxszStyle+0x1c
0476de60 69702ba9 html!LwMultDivRU+0x4b6
0476dea4 6970518a html!FMarkListCallback+0x56c
0476deb4 697068b7 html!JcCalcFromXaExtents+0x91
0476df60 697070c5 html!EmitNonBreakingSpace+0x445
0476e08c 697107ff html!FEmitHtmlFnOtag+0x17d
0476e0b0 696ec6a8 html!ConvertRtfToForeign+0x105
0476e538 696ec745 html!FceRtfToForeign+0x266
0476e560 6b7e5ad4 html!RtfToForeign32+0x51
0476e9a8 6b7e5c83 mshtmled!CRtfToHtmlConverter::ExternalRtfToInternalHtml+0x163
0476edfc 6b79cc15 mshtmled!CRtfToHtmlConverter::StringRtfToStringHtml+0x11a
0476ee18 6b79cd81 mshtmled!CRtfToHtmlConverter::StringRtfToStringHtml+0x38
0476ee2c 6b7cdcea mshtmled!CHTMLEditor::ConvertRTFToHTML+0x12
0476ee98 6b7ce392 mshtmled!CPasteCommand::PasteFromClipboard+0x2c0
0476ef08 6b78d218 mshtmled!CPasteCommand::PrivateExec+0x47a
0476ef2c 6b78d1ad mshtmled!CCommand::Exec+0x4b
0476ef50 6b470d14 mshtmled!CMshtmlEd::Exec+0xf9
0476ef80 6b4688a8 mshtml!CEditRouter::ExecEditCommand+0xd6
0476f328 6b5ceccf mshtml!CDoc::ExecHelper+0x338d
0476f374 6b468a2f mshtml!CFrameSite::Exec+0x264
0476f3a8 6b4687af mshtml!CDoc::RouteCTElement+0xf1
0476f740 6b468586 mshtml!CDoc::ExecHelper+0x325e
0476f760 6b510e7b mshtml!CDoc::Exec+0x1e
0476f798 6b48a708 mshtml!CDoc::OnCommand+0x9c
0476f8ac 6b3997e1 mshtml!CDoc::OnWindowMessage+0x841
0476f8d8 766ff8d2 mshtml!CServer::WndProc+0x78
0476f904 766ff794 USER32!InternalCallWinProc+0x23
0476f97c 767006f6 USER32!UserCallWinProcCheckWow+0x14b
0476f9ac 7670069c USER32!CallWindowProcAorW+0x97
0476f9cc 6ce1851b USER32!CallWindowProcW+0x1b
WARNING: Stack unwind information not available. Following frames may be wrong.
0476fa40 6ce0cdc6 GoogleToolbarDynamic_6D0D6FD66D664927!DllGetClassObject+0x24981
0476fa64 6ce9beaa GoogleToolbarDynamic_6D0D6FD66D664927!DllGetClassObject+0x1922c
0476fa94 766ff8d2 GoogleToolbarDynamic_6D0D6FD66D664927!DllGetClassObject+0xa8310
0476fac0 766ff794 USER32!InternalCallWinProc+0x23
0476fb38 76700a05 USER32!UserCallWinProcCheckWow+0x14b
0476fb78 76700afa USER32!SendMessageWorker+0x4b7
0476fb98 6b47fb9b USER32!SendMessageW+0x7c
0476fbc4 6b3d8e5a mshtml!CElement::PerformTA+0x71
0476fbe4 6b3d8db9 mshtml!CDoc::PerformTA+0xd8
0476fc60 6b46381c mshtml!CDoc::PumpMessage+0x8e0
0476fd14 6b463684 mshtml!CDoc::DoTranslateAccelerator+0x33f
0476fd30 6b4634cc mshtml!CServer::TranslateAcceleratorW+0x56
0476fd50 70c9f550 mshtml!CDoc::TranslateAcceleratorW+0x83
0476fd6c 70c9f600 IEFRAME!CProxyActiveObject::TranslateAcceleratorW+0x30
0476fd90 70c9fca1 IEFRAME!CDocObjectView::TranslateAcceleratorW+0xb1
0476fdb0 70c9faf4 IEFRAME!CCommonBrowser::v_MayTranslateAccelerator+0xda
0476fddc 70c9f7b0 IEFRAME!CShellBrowser2::_MayTranslateAccelerator+0x68
0476fdec 70c9f7f5 IEFRAME!CShellBrowser2::v_MayTranslateAccelerator+0x15
0476fe58 76894911 IEFRAME!CTabWindow::_TabWindowThreadProc+0x264
0476fe64 776ae4b6 kernel32!BaseThreadInitThunk+0xe
0476fea4 776ae489 ntdll!__RtlUserThreadStart+0x23
0476febc 00000000 ntdll!_RtlUserThreadStart+0x1b
In Andreas Zeller's book Why Programs Fail[40] a browser parsing HTML was used as an example to show delta debugging[41].
The complete log file can be downloaded from this link:
http://www.dumpanalysis.org/blog/files/HTMLProcessingCrash.log
Consider this crash point:
0:000> r eax=02d0f15c ebx=02a62918 ecx=77e41c30 edx=00000000esi=ffffffffedi=02a8ed28 eip=76154193 esp=02d0f124 ebp=02d0f130 iopl=0 nv up ei pl zr na pe nc cs=001b ss=0023 ds=0023 es=0023 fs=003b gs=0000 efl=00010246 Application!GetData+0xb: 76154193 8b9eac000000 mov ebx,dword ptr [esi+0ACh] ds:0023:000000ab=????????
Seeing 000000ab address we can think that ESI was 0 but it is 0xFFFFFFFF as we can see above. Adding 0xAC to it produced an effective NULL data pointer (page 131) 0xAB through integer addition overflow if we consider addition as unsigned. It is easy to see the result if we consider 0xFFFFFFFF as signed -1. Looking at stack trace and function disassembly we see that 0xFFFFFFFF was passed as a parameter:
0:000> kv ChildEBP RetAddr Args to Child 02d0f130 7616328dffffffff02d0f15c 02d0f150 Application!GetData+0xb [...] 02d0ffec 00000000 740420d8 02a74070 00000000 kernel32!BaseThreadStart+0×34 0:000> u Application!GetData Application!GetData: 76154188 mov edi,edi 7615418a push ebp 7615418b mov ebp,esp 7615418d push ecx 7615418e push ebx 7615418f push esi76154190 movesi,dword ptr [ebp+8] 76154193 movebx,dword ptr [esi+0ACh]
This is an example of a sentinel pointer marking the end of a linked list, although NULL pointers having 0 values are usually used. Also -1 value can be used to assign an invalid pointer value (Volume 1, page 267).
This is a stack trace (backtrace) where all finctions are removed and only modules are left. It is useful for depicting component dependencies. Here is an example:
0: kd> kc 100
nt!KiSwapContext
nt!KiSwapThread
nt!KeDelayExecutionThread
3rdPartyAVDriver
3rdPartyAVDriver
3rdPartyAVDriver
3rdPartyAVDriver
nt!IofCallDriver
DriverA!Dispatch
DriverA!KUI_dispatch
nt!IofCallDriver
DriverB!PassThrough
DriverB!Dispatch
nt!IofCallDriver
DriverC!LowerPassThrough
DriverC
DriverC
DriverC
DriverC!DispatchPassThrough
nt!IofCallDriver
nt!IopParseDevice
nt!ObpLookupObjectName
nt!ObOpenObjectByName
nt!IopCreateFile
nt!IoCreateFile
nt!NtOpenFile
nt!KiFastCallEntry
ntdll!KiFastSystemCallRet
ntdll!NtOpenFile
ntdll!LdrpCreateDllSection
ntdll!LdrpMapDll
ntdll!LdrpLoadDll
ntdll!LdrLoadDll
kernel32!LoadLibraryExW
kernel32!LoadLibraryW
ntdll!LdrpCallInitRoutine
ntdll!LdrpRunInitializeRoutines
ntdll!LdrpLoadDll
ntdll!LdrLoadDll
kernel32!LoadLibraryExW
kernel32!LoadLibraryW
USER32!LoadAppDlls
USER32!ClientThreadSetup
USER32!__ClientThreadSetup
ntdll!KiUserCallbackDispatcher
nt!KiCallUserMode
nt!KeUserModeCallback
win32k!xxxClientThreadSetup
win32k!xxxCreateThreadInfo
win32k!UserThreadCallout
win32k!W32pThreadCallout
nt!PsConvertToGuiThread
nt!KiBBTUnexpectedRange
Collapsed stack trace is much simpler to grasp:
nt
3rdPartyAVDriver
nt
DriverA
nt
DriverB
nt
DriverC
nt
ntdll
kernel32
ntdll
kernel32
USER32
ntdll
nt
win32k
nt