
Chapter 7. Distributed Tracing with OpenTracing
In the previous chapters, we built a couple of microservices that connect to a backend. To access these two microservices, we also built an API Gateway. With just a few microservices, it’s easy to understand the topology and what calls what inside our cluster. However, in a real-world scenario the network of services will likely be far more complex, and therefore it will be much more complex to monitor the number of requests, the response time, and the path of a particular invocation. A simple invocation can traverse several microservices, and any particular issue will be hard to detect if we don’t have the ability to trace those invocations.
One things that we need to keep in mind is that distributed tracing should be technology-agnostic, because a Java microservice might invoke a .NET microservice that will call a Python microservice, and they should all accept and propagate the tracing information.
In 2010, Google published a paper about the project Dapper, which was designed to provide a solution for distributed tracing. This paper influenced several open source implementations, like Zipkin and Appdash. In 2015 the OpenTracing project was started, and in 2016 it became a hosted project of the Cloud Native Computing Foundation (CNCF).
OpenTracing is comprised of a set of standard APIs and a vendor-neutral framework for instrumentation. It supports the following platforms: Go, JavaScript, Java, Python, Ruby, PHP, Objective-C, C++, and C#. There are already several OpenTracing implementations, including Jaeger (from Uber), Apache Skywalking, and Instana, and others. In this report, we will use Jaeger, which is the most widely used implementation of OpenTracing.
Installing Jaeger
All information captured on each microservice should be reported to a server that will collect and store this information, so it can be queried later.
So, before instrumenting the source code of our microservices, first we need to install the Jaeger server and its components. Jaeger provides an all-in-one distribution composed of the Jaeger UI, collector, query, and agent, with an in-memory storage component.
We can install this distribution with the following command:
$ oc process -f
http://raw.githubusercontent.com/jaegertracing/jaeger-openshift
/master/
all-in-one/jaeger-all-in-one-template.yml | oc create -f -

deployment.extensions "jaeger" created
service "jaeger-query" created
service "jaeger-collector" created
service "jaeger-agent" created
service "zipkin" created
route.route.openshift.io "jaeger-query" created
That’s it! Now we can start modifying our microservices to report the tracing information to this server.
Modifying Microservices for Distributed Tracing
Now that we have our Jaeger server installed, it’s time to modify our microservices to report information to it.
All Java OpenTracing libraries can be configured using environment variables. The only environment variable that is required is JAEGER_SERVICE_NAME, which tells Jaeger the name of the service. This will be declared as an ENV instruction in each microservice’s Dockerfile. Because we will also need other environment variables on all microservices to configure the tracing collector, they will be declared using a Kubernetes feature called a ConfigMap, and then will be consumed by all the microservices.
Modifying the API gateway
The first microservice that we will modify is the api-gateway service. Since it was built using Camel, we will make use of a Camel component called camel-opentracing. This component is used for tracing incoming and outcoming Camel messages.
To use this Camel component, we just need to add the dependency camel-opentracing-starter that enables the integration of Camel, Spring Boot, and OpenTracing to our pom.xml file. We will also need to add two Jaeger libraries--jaeger-tracerresolver gets the Tracer object and configures it from environment variables, and jaeger-thrift is a set of components that send data to the backend:
<!-- OpenTracing --><dependency><groupId>org.apache.camel</groupId><artifactId>camel-opentracing-starter</artifactId></dependency><dependency><groupId>io.jaegertracing</groupId><artifactId>jaeger-tracerresolver</artifactId><version>0.32.0</version></dependency><dependency><groupId>io.jaegertracing</groupId><artifactId>jaeger-thrift</artifactId><version>0.32.0</version></dependency>
Now we can “turn on” the OpenTracing feature by annotating the main class with @CamelOpenTracing as shown in Example 7-1.
Example 7-1. src/main/java/com/redhat/examples/MySpringBootApplication.java
@SpringBootApplication@CamelOpenTracingpublicclassMySpringBootApplication{/*** A main method to start this application.*/publicstaticvoidmain(String[]args){SpringApplication.run(MySpringBootApplication.class,args);}}
As mentioned previously, the Tracer object will be configured using several environment variables. Because the only one that is required is JAEGER_SERVICE_NAME, we will add this to our Dockerfile with the value API-Gateway:
FROMfabric8/java-alpine-openjdk8-jdkENVJAVA_APP_JAR api-gateway-1.0.jarENVAB_OFF trueENVJAEGER_SERVICE_NAME API-GatewayADDtarget/api-gateway-1.0.jar /deployments/
Now we can rebuild the JAR file and the Docker image and restart the Kubernetes pod with the following commands:
$ mvn clean package
$ docker build -t rhdevelopers/api-gateway:1.0 .
$ oc delete pod -l app=api-gateway
Modifying the Spring Boot microservice
For our hello_springboot microservice, we need to add the same jaeger-tracerresolver and jaeger-thrift libraries that we included in the api-gateway service, plus the opentracing-spring-web-starter dependency that will be responsible for providing the integration with Spring Boot and OpenTracing:
<!-- OpenTracing --><dependency><groupId>io.opentracing.contrib</groupId><artifactId>opentracing-spring-web-starter</artifactId><version>1.0.1</version></dependency><dependency><groupId>io.jaegertracing</groupId><artifactId>jaeger-tracerresolver</artifactId><version>0.32.0</version></dependency><dependency><groupId>io.jaegertracing</groupId><artifactId>jaeger-thrift</artifactId><version>0.32.0</version></dependency>
To enable the tracing headers to be forwarded from this microservice to the backend, the RestTemplate needs an interceptor called TracingRestTemplateInterceptor.
Let’s modify the GreeterRestController class to add this interceptor, as shown in Example 7-2.
Example 7-2. src/main/java/com/redhat/examples/hellospringboot/GreeterRestController.java
@RestController@RequestMapping("/api")@ConfigurationProperties(prefix="greeting")publicclassGreeterRestController{privateRestTemplatetemplate=newRestTemplate();privateStringsaying,backendServiceHost;privateintbackendServicePort;@RequestMapping(value="/greeting",method=RequestMethod.GET,produces="text/plain")@HystrixCommand(fallbackMethod="fallback")publicStringgreeting(){template.setInterceptors(Collections.singletonList(newTracingRestTemplateInterceptor(TracerResolver.resolveTracer())));StringbackendServiceUrl=String.format("http://%s:%d/api/backend?greeting={greeting}",backendServiceHost,backendServicePort);System.out.println("Sending to: "+backendServiceUrl);BackendDTOresponse=template.getForObject(backendServiceUrl,BackendDTO.class,saying);returnresponse.getGreeting()+" at host: "+response.getIp();}//fallback method and setters}
Now let’s add the declaration of the JAEGER_SERVICE_NAME environment variable in the Dockerfile:
FROMfabric8/java-alpine-openjdk8-jdkENVJAVA_APP_JAR hello-springboot-1.0.jarENVAB_OFF trueENVJAEGER_SERVICE_NAME hello-springbootADDtarget/hello-springboot-1.0.jar /deployments/
Then we can rebuild the JAR file and the Docker image and restart the Kubernetes pod with the following commands:
$ mvn clean package -DskipTests
$ docker build -t rhdevelopers/hello-springboot:1.0 .
$ oc delete pod -l app=hello-springboot
Modifying the MicroProfile microservice
For our hello_microprofile, we will follow the same recipe:
-
Add a Maven dependency.
-
Modify the source code.
-
Add the
JAEGER_SERVICE_NAMEenvironment variable to the Dockerfile.
Let’s start by adding the Maven dependencies related to OpenTracing and Jaeger, respectively. MicroProfile has support for OpenTracing and Thorntail has integration with Jaeger, so we will need both dependencies:
<!-- OpenTracing --><dependency><groupId>io.thorntail</groupId><artifactId>microprofile-opentracing</artifactId></dependency><dependency><groupId>io.thorntail</groupId><artifactId>jaeger</artifactId></dependency>
MicroProfile has an API for accessing an OpenTracing-compliant Tracer object within a JAX-RS application. We just need to add the @Traced annotation to the methods that will be “traced.” We also need to use the class ClientTracingRegistrar to configure tracing features into the JAX-RS client. Let’s perform these modifications to the greeting() method in the GreeterRestController class in Example 7-3.
Example 7-3. src/main/java/com/redhat/examples/hellomicroprofile/rest/GreeterRestController.java
@Path("/api")publicclassGreeterRestController{@Inject@ConfigProperty(name="greeting.saying",defaultValue="Hello")privateStringsaying;@Inject@ConfigProperty(name="greeting.backendServiceHost",defaultValue="localhost")privateStringbackendServiceHost;@Inject@ConfigProperty(name="greeting.backendServicePort",defaultValue="8080")privateintbackendServicePort;@GET@Produces("text/plain")@Path("greeting")@CircuitBreaker@Timeout@Fallback(fallbackMethod="fallback")@Traced(operationName="greeting")publicStringgreeting(){StringbackendServiceUrl=String.format("http://%s:%d",backendServiceHost,backendServicePort);System.out.println("Sending to: "+backendServiceUrl);Clientclient=ClientTracingRegistrar.configure(ClientBuilder.newBuilder()).build();BackendDTObackendDTO=client.target(backendServiceUrl).path("api").path("backend").queryParam("greeting",saying).request(MediaType.APPLICATION_JSON_TYPE).get(BackendDTO.class);returnbackendDTO.getGreeting()+" at host: "+backendDTO.getIp();}publicStringfallback(){returnsaying+" at host "+System.getenv("HOSTNAME")+" - (fallback)";}}
That’s it! Just one annotation and we are good to go. But let’s not forget about the JAEGER_SERVICE_NAME in the Dockerfile:
FROMfabric8/java-alpine-openjdk8-jdkENVJAVA_APP_JAR demo-thorntail.jarENVAB_OFF trueENVJAEGER_SERVICE_NAME hello-microprofileADDtarget/demo-thorntail.jar /deployments/
We can then rebuild the JAR file and the Docker image and restart the Kubernetes pod with the following commands:
$ mvn clean package -DskipTests
$ docker build -t rhdevelopers/hello-microprofile:1.0 .
$ oc delete pod -l app=hello-microprofile
Modifying the Servlet backend
Finally, we will add tracing capabilities to our backend application. To make this happen, we will add the dependency jaeger-client to our pom.xml file:
<!-- OpenTracing --><dependency><groupId>io.jaegertracing</groupId><artifactId>jaeger-client</artifactId><version>0.32.0</version></dependency>
With this library, the backend application using OpenTracing’s TracerResolver can continue using the Jaeger Java client without any hardcoded dependency; we can configure it via environment variables just like we did for the previous microservice.
On the source code side, it will require a little bit more work as we need to extract the parent Span coming from the microservice’s request headers and create a new child Span. This can be done using the following code snippet:
//Extract the parent Span from the headersSpanContextparentSpan=tracer.extract(Format.Builtin.HTTP_HEADERS,newTextMapExtractAdapter(headers));//Start a new Span as a child of the Parent SpanScopescope=tracer.buildSpan("backend-servlet").asChildOf(parentSpan).startActive(true);//Perform workscope.span().finish();
Example 7-4 shows the necessary modifications in the BackendHttpServlet class.
Example 7-4. src/main/java/com/redhat/examples/backend/BackendHttpServlet.java
@WebServlet(urlPatterns={"/api/backend"})publicclassBackendHttpServletextendsHttpServlet{privateTracertracer=TracerResolver.resolveTracer();@OverrideprotectedvoiddoGet(HttpServletRequestreq,HttpServletResponseresp)throwsServletException,IOException{//Place the HTTP headers in a HashMapfinalHashMap<String,String>headers=newHashMap<>();Enumeration<String>headerNames=req.getHeaderNames();while(headerNames.hasMoreElements()){Stringname=headerNames.nextElement();Stringvalue=req.getHeader(name);headers.put(name,value);}//Extract the parent Span from the headersSpanContextparentSpan=tracer.extract(Format.Builtin.HTTP_HEADERS,newTextMapExtractAdapter(headers));//Start a new Span as a child of the parent SpanScopescope=tracer.buildSpan("backend-servlet").asChildOf(parentSpan).startActive(true);resp.setContentType("application/json");ObjectMappermapper=newObjectMapper();Stringgreeting=req.getParameter("greeting");ResponseDTOresponse=newResponseDTO();response.setGreeting(greeting+" from cluster Backend");response.setTime(System.currentTimeMillis());response.setIp(getIp());PrintWriterout=resp.getWriter();mapper.writerWithDefaultPrettyPrinter().writeValue(out,response);scope.span().finish();}privateStringgetIp(){Stringhostname=null;try{hostname=InetAddress.getLocalHost().getHostAddress();}catch(UnknownHostExceptione){hostname="unknown";}returnhostname;}}
We must also to add the declaration of the JAEGER_SERVICE_NAME environment variable in the Dockerfile:
FROMjboss/wildfly:10.0.0.FinalENVJAEGER_SERVICE_NAME backendADDtarget/ROOT.war /opt/jboss/wildfly/standalone/deployments/
Now we can rebuild the JAR file and the Docker image and restart the Kubernetes pod with the following commands:
$ mvn clean package -DskipTests
$ docker build -t rhdevelopers/backend:1.0 .
$ oc delete pod -l app=backend
Configuring Microservices Using ConfigMap
As we discussed previously, the configuration of Jaeger Java clients is done through environment variables. In any case, the only environment variable that is required is JAEGER_SERVICE_NAME, which we defined in every Dockerfile.
If you look at the logs of any microservices, you should see a message like the following:
Initializedtracer=JaegerTracer(version=Java-0.32.0,serviceName=API-Gateway,reporter=RemoteReporter(sender=UdpSender(),closeEnqueueTimeout=1000),sampler=RemoteControlledSampler(maxOperations=2000,manager=HttpSamplingManager(hostPort=localhost:5778),sampler=ProbabilisticSampler(tags={sampler.type=probabilistic, sampler.param=0.001})), ...
This means that the default configuration for the tracer uses a UDP Sender that sends the tracing information to localhost:5778. The ProbabilisticSampler defines that only 0.1% (0.001) of the requests will be traced. Tracing only 0.1% of the requests seems fine for production usage. However, for our tutorial we will change the tracer to collect all requests.
According to the environment variable definitions in the jaeger-core module, we will need to configure the following keys/values for all microservices:
-
JAEGER_ENDPOINT: http://jaeger-collector:14268/api/traces -
JAEGER_REPORTER_LOG_SPANS: true -
JAEGER_SAMPLER_TYPE: const -
JAEGER_SAMPLER_PARAM: 1
These environment variables configure the tracer to send an HTTP report to http://jaeger-collector:14268/api/traces. Every tracer report will be logged, and we will use a constant sampler that collects 100% of the requests (1 of 1).
We could use the command oc set env for every microservice, but we want to try something more advanced. We will create a Configmap Kubernetes object to hold this configuration. Later we will consume the configurations using environment variables, but don’t worry about the details right now.
$ oc set env deployment --all --from=configmap/jaeger-config
deployment.extensions/api-gateway updated
deployment.extensions/backend updated
deployment.extensions/hello-microprofile updated
deployment.extensions/hello-springboot updated
deployment.extensions/jaeger updated
Note that it will cause the deployment of every microservice and that the logs now for any microservice will contain different information about the tracer:
Initializedtracer=JaegerTracer(version=Java-0.32.0,serviceName=API-Gateway,reporter=CompositeReporter(reporters=[RemoteReporter(sender=HttpSender(),closeEnqueueTimeout=1000), LoggingReporter(...sampler=ConstSampler(decision=true,tags={sampler.type=const, sampler.param=true}),tags={hostname=api-gateway-78f6f8dcd7-wckvx, jaeger.version=Java-0.32.0,ip=172.17.0.16}, ...
Wait for the pods to come alive, and try making a request to the microservice:
$ curl http://api-gateway-tutorial.$(minishift ip).nip.io
  /api/gateway
["Hello from cluster Backend at host: 172.17.0.13",
 "Hello Spring Boot from cluster Backend at host: 172.17.0.13"]
You should see something like this in the logs:
i.j.internal.reporters.LoggingReporter
: Span reported: d716584c2fab233d:d716584c2fab233d:0:1
Analyzing the Tracing in Jaeger
Now that we’ve made a request using the curl command, and we’ve seen in the logs that this request generated a tracer Span that was reported to Jaeger, we can open the Jaeger UI to look at some important information. To open the UI in your browser, use the following command:
$ minishift openshift service jaeger-query --in-browser
In the top menu, select Dependencies, and then select DAG. Note that the generated dependency graph is similar to what we expected (Figure 7-1 from Jaeger and Figure 7-2 from our architecture show the same pattern). The number 1 in the Jaeger DAG indicates the number of requests between the microservices.

Figure 7-1. Jaeger dependencies

Figure 7-2. Calling another service
Now click Search in the top menu, and select the API-Gateway service. Scroll down the page, and click the Find Traces button. You should see the tracing generated by your request with the curl command, as shown in Figure 7-3.

Figure 7-3. Jaeger tracing
Click on the trace, and Jaeger will open the details. It’s easy to see that the api-gateway service made parallel requests to hello-microprofile and hello-springboot. You can click on the details of each Span to verify the path walked by the request inside the Camel routes until it reached the microservice. Figure 7-4 shows the Span details.
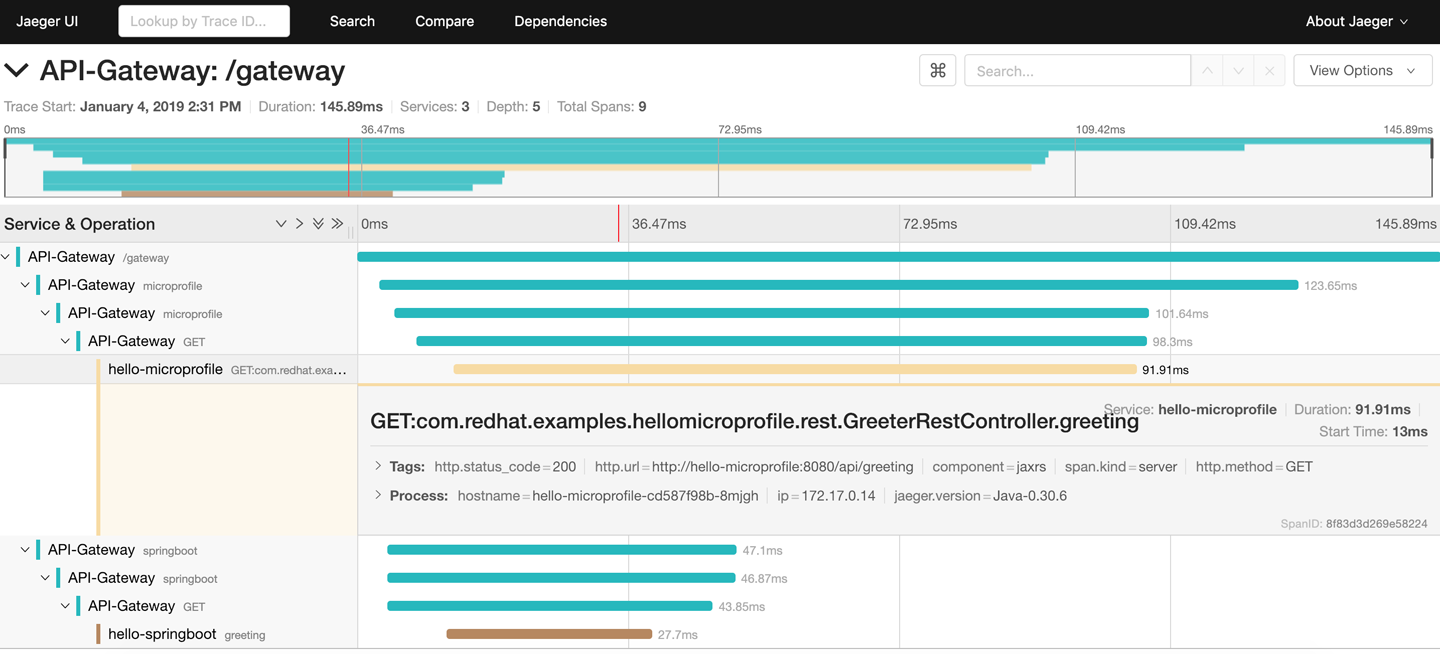
Figure 7-4. Span details
Feel free to go ahead and search for the backend service spans.
Where to Look Next
In this chapter, you learned about distributed tracing, the CNCF OpenTracing specification, and the Jaeger implementation. You also learned how to instrument different technologies to collect and report tracing information, and learned how to use ConfigMaps to store and spread the configuration. Tracing is a complex subject, and we just covered the basics without going deeper into how the tracing happens. Check out the following links for more information: