Chapter 16. Applying Advanced Formatting

In this chapter, you will learn how to: | |
✓ | Format the Gantt Chart view. |
✓ | Format the Network Diagram view. |
✓ | Format the Calendar view. |
Tip
Do you need only a quick refresher on the topics in this chapter? See the Quick Reference entries in Applying Advanced Formatting.
This chapter introduces you to some of the more advanced formatting features in Microsoft Office Project 2007. A well-formatted project plan is essential for communicating details to resources, customers, and other stakeholders. Some of the formatting capabilities in Project are similar to those of a style-based word processor, such as Word, in which defining a style once affects all content in the document to which that style has been applied. In Project, you can use styles to change the appearance of a specific type of Gantt bar, such as a summary bar, throughout a project plan. Other formatting options introduced in this chapter focus on the different ways of identifying tasks and formatting some of the more commonly used views.
Important
Before you can use the practice files provided for this chapter, you need to install them from the book’s companion CD to their default locations. See "Using the Book’s CD" for more information.
Formatting a Gantt Chart View
You can directly format specific items (a milestone, for example) in a Gantt chart view or use the Gantt Chart Wizard (on the Format menu) to change the look of a Gantt Chart view in limited ways. If you completed Chapter 5, you worked with the Gantt Chart Wizard. In this section, you will customize specific items, such as Gantt bars and gridlines, in ways that the Gantt Chart Wizard cannot.
Tip
Remember that several views are Gantt chart views, even though only one view is specifically called the Gantt Chart view. Other Gantt chart views include the Detail Gantt, Leveling Gantt, Multiple Baselines Gantt, and Tracking Gantt. Gantt chart view generally refers to a type of presentation that shows Gantt bars organized along a timescale.
In addition to changing the formatting of objects that appear by default in a Gantt chart view (such as a task’s Gantt bar), you can add or remove objects. For example, it may be useful to compare baseline, interim, and actual plans in a single view. Doing so helps you evaluate the schedule adjustments you have made.
In this exercise, you display the current schedule along with the baseline and the interim plan. (The baseline and the interim plan were previously set in the project plan.) You begin by customizing a copy of the Tracking Gantt chart view.
Important
If you are running Project Professional, you may need to make a one-time adjustment to use the Computer account and to work offline. This ensures that the practice files you work with in this chapter do not affect your Project Server data. For more information, see "Starting Project Professional“.
Note
OPEN Parnell Film 16a from the DocumentsMicrosoft PressProject 2007 SBSChapter 16 Advanced Formatting folder. You can also access the practice files for this book by clicking Start, All Programs, Microsoft Press, Project 2007 Step by Step and then selecting the chapter folder of the file you want to open.
On the File menu, click Save As.
The Save As dialog box appears.
In the File name box, type Parnell Film 16, and then click Save.
On the View menu, click More Views.
The More Views dialog box appears.
On the Views list, click Tracking Gantt, and click the Copy button.
The View Definition dialog box appears.
In the Name box, type Interim Tracking Gantt, and click OK.
The new view is listed in the More Views dialog box.
Click the Apply button.
Project displays the new view, which at this point is identical to the Tracking Gantt view. Next, you will customize this new view so that your original Tracking Gantt view will not be altered. You will add the interim plan bars to the view.
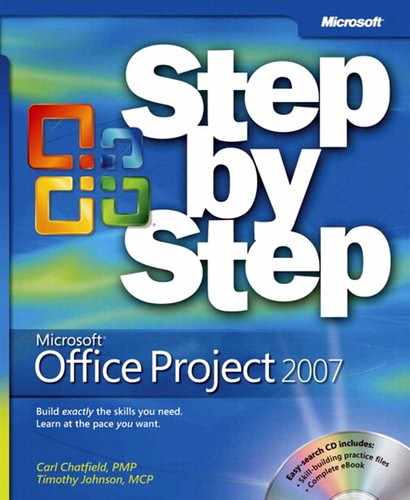
On the Format menu, click Bar Styles.
The Bar Styles dialog box appears.
Scroll down the list of the bar styles, and in the Name column, click Baseline Split.
Click the Insert Row button.
Project inserts a row for a new bar style in the table. Project draws Gantt bars in the order in which they are listed in the Bar Styles dialog box. Inserting a new bar style above the Baseline Split will help ensure that it won’t be obscured by another type of Gantt bar.
In the new cell in the Name column, type Interim.
Interim is the name you’ll give to the new task bar that will appear on the chart portion of the view.
Tip
The names of most task bars will appear in the legend of printed Gantt chart views. If you do not want a task bar name to appear in the legend, type an asterisk (*) at the beginning of the task bar name. For example, if you wanted to prevent Interim from appearing in the legend, you would enter its name here as *Interim. In the Bar Styles dialog box, you can see that the Rolled Up task bar name (among others) is prefaced with an asterisk, so it does not appear in the legend of a printed Gantt chart view.
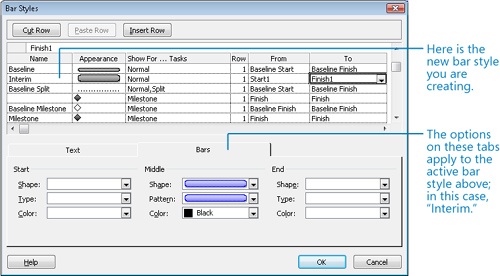
In the same row, click the cell under the Show For...Tasks column heading, and then click Normal on the drop-down list.
The Show For ... Tasks value indicates the type of task the bar will represent (such as a normal task, a summary task, or a milestone) or the status of the task (such as critical or in progress).
Click the cell under the From column heading, and click Start1 on the drop-down list.
Click the cell under the To column heading, and then click Finish1 on the drop-down list.
The From and To values represent the start and end points for the bar.
The Start1 and Finish1 items are the fields in which the first interim plan values were previously set for you in the project plan. The current start date and finish date of each task in the project were saved to these fields when the interim plan was set. If you completed Chapter 13, you have already been introduced to interim plans.
You have now instructed Project to display the first interim plan’s start and finish dates as bars. Next, you will specify what these bars should look like.
Click the cell under the Row column heading, and click 2 on the drop-down list.
This causes Project to display multiple rows of Gantt bars for each task in the view. Next, focus your attention on the lower half of the Bar Styles dialog box.
In the Shape box under the Middle label, click the half-height bar, the third option from the top of the list.
In the Pattern box under the Middle label, click the solid bar, the second option from the top of the list.
In the Color box, click Green.
Because this custom view focuses on the interim plan, next you’ll format the interim bars to include their start and finish dates.
In the Bar Styles dialog box, click the Text tab.
In the Left box, click Start1 on the drop-down list.
In the Right box, click Finish1 on the drop-down list.
Selecting these values will cause the Start1 and Finish1 dates to appear on either side of the bar.
Click OK to close the Bar Styles dialog box.
Project displays the interim bars on the Interim Tracking Gantt view. Next, you will get a better look at the Gantt bars.
In the Task Name column, click the name of task 6, Select locations.
On the Standard toolbar, click the Scroll To Task button.
Project scrolls the view to display the Gantt bars for task 6 and its adjacent tasks.
Here you can see that the completed task 6 (shown as a solid blue bar at the top of the task row) corresponds exactly to its interim plan bar (the green bar at the bottom of the task row) and that both were scheduled later than the baseline (the patterned gray bar in the middle of the task row). This occurred because, after the baseline was set, changes to the schedule were made that pushed out the scheduled start date of the task. Then the interim plan was saved.
To conclude this exercise, you’ll display horizontal gridlines on the chart portion of the Interim Tracking Gantt view to better distinguish the rows of Gantt bars per task.
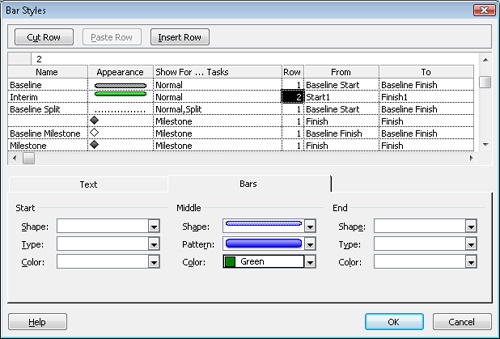
On the Format menu, click Gridlines.
The Gridlines dialog box appears.
In the Line to change box, make sure that Gantt Rows is selected. Then, in the Type box, click the long dashed line, the last option on the list.
Click OK to close the Gridlines dialog box.
Project draws gridlines between task rows in the chart.
Displaying gridlines like this is a great idea when you print multiple Gantt bars for each task.


Project supports several additional Gantt Chart formatting features than those we’ve worked with in this section. If you wish to explore other formatting options, look at these commands on the Format menu:
Timescale—. for setting time increments, such as weeks and days, and how nonworking time is displayed.
Text Styles—. for formatting text associated with a specific task type, such as summary task text.
Layout—. for formatting link lines and Gantt bar visual effects.
Formatting the Network Diagram View
In traditional project management, the Network Diagram is a standard way of representing project activities and their relationships. Tasks are represented as boxes, or nodes, and the relationships between tasks are drawn as lines connecting the nodes. Unlike a Gantt chart, which is a timescaled view, a Network Diagram enables you to view project activities in a manner more closely resembling a flowchart format. This is useful if you’d like to place more focus on the relationships between activities rather than on their durations.
Project provides substantial formatting options for the Network Diagram. In this section, you will use only a few of these formatting options. If you’re a heavy-duty Network Diagram user, you’ll want to explore the formatting options in greater detail on your own.
In this exercise, you format items in the Network Diagram view.
On the View menu, click Network Diagram.
The Network Diagram view appears. In this view, each task is represented by a box or node, and each node contains several pieces of information (or fields) about the task.
Next, you’ll replace the task ID values with the Work Breakdown Structure (WBS) codes.
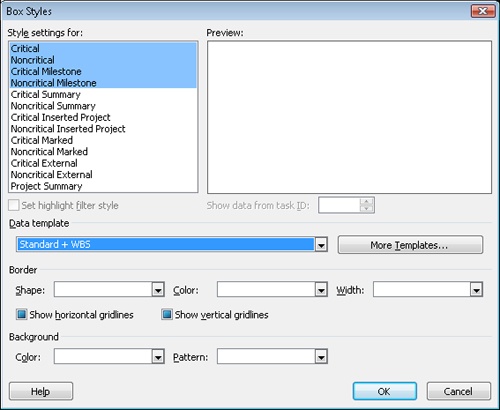
On the Format menu, click Box Styles.
Note that commands on the Format menu may change depending on the type of active view.
The Box Styles dialog box appears.
On the Style Settings For list, you can see all of the node box styles available in Project. The Preview box shows you the specific labels and fields displayed in each box style.
Click More Templates.
The Data Templates dialog box appears. Templates determine what fields appear in boxes (nodes) as well as their layout.
On the Templates in “Network Diagram” list, make sure that Standard is selected, and then click Copy.
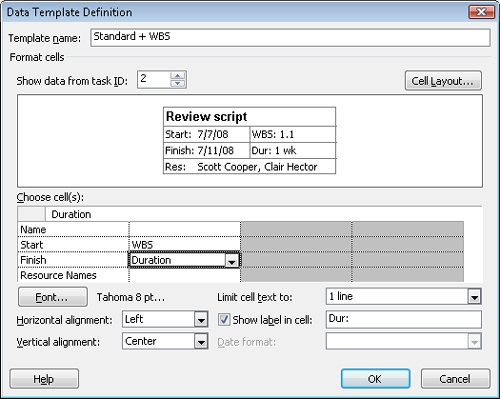
The Data Template Definition dialog box appears. You want to add the WBS code value to the upper right corner of the node.
In the Template name box, type Standard + WBS.
Below Choose cell(s), click ID. This is the field you will replace.
Click WBS on the drop-down list of fields, and then press the
 key.
key.Pressing the
key causes Project to update the preview in
the dialog box.Click OK to close the Data Template Definition dialog box.
Click Close to close the Data Templates dialog box.
In the Box Styles dialog box, under Style settings for, select Critical, and while holding the
 key, click Noncritical Milestone.
The four types of subtasks are selected.
In the Data template box, select Standard + WBS from the drop-down list.
Click OK to close the Box Styles dialog box.
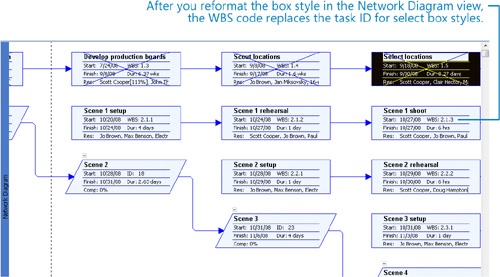
Project applies the revised box style to nodes in the Network Diagram.
Now for these box styles, the WBS value appears in the upper right corner of each box rather than the Task ID.


Here are some additional things to consider when working in the Network Diagram view:
In the Network Diagram view, you can format all boxes with the Box Styles command on the Format menu, or you can format just the active box with the Box command. This is similar to the Bar Styles and Bar commands available on the Format menu when you have a Gantt Chart view displayed.
If you have Visio 2007 or later, you can generate a Visio visual report that is similar to a network diagram view. Visio visual reports are PivotDiagrams that you can customize. For more information about visual reports, see Chapter 12.
Formatting the Calendar View
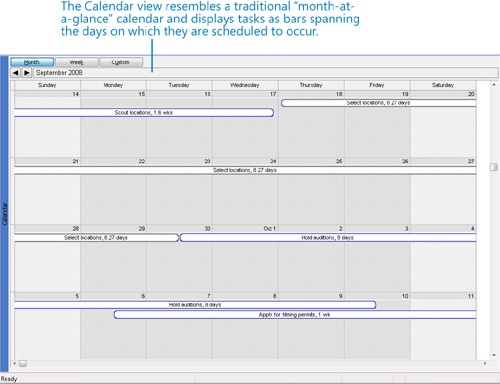
The Calendar view is probably the simplest view available in Project; however, even the Calendar view offers several formatting options. This view is especially useful for sharing schedule information with resources or other stakeholders who prefer a traditional “month-at-a-glance” format rather than a more detailed view, such as the Gantt Chart view.
In this exercise, you reformat summary and critical tasks in the Calendar view.
On the View menu, click Calendar.
The Calendar view appears. It displays four weeks at a time, and it draws task bars on the days on which tasks are scheduled. Depending on your screen resolution, you might see additional task bars in the Calendar view.
On the Format menu, click Bar Styles.
The Bar Styles dialog box appears. The additional item type you would like to show on the Calendar view is a summary bar.
In the Task type box, click Summary.
In the Bar type box, click Line on the drop-down list.
The next item type to reformat is critical tasks.
In the Task type box, click Critical.
In the Pattern box, select the second option on the drop-down list: the solid bar.
In the Color box, select Red from the drop-down list.
Click OK to close the Bar Styles dialog box.
Project applies the format options to the Calendar view. To conclude this exercise, you’ll display a month that includes some critical tasks.
On the Edit menu, click Go To.
In the Date box, type or select 11/23/08, and then click OK.
Project displays parts of November and December 2008, which includes the newly formatted critical tasks. Next, you will change how the bars are laid out.
On the Format menu, click Layout.
In the Layout dialog box, click Attempt to fit as many tasks as possible, and then click OK.

As with the other views you’ve customized in this chapter, the Calendar view has additional formatting options available on the Format menu.

Key Points
Many different types of bars can appear in the chart portion of a Gantt chart view. Each type of bar can represent a type of task (such as a summary task) or a condition of a task (such as completed).
The Gantt Chart Wizard offers limited Gantt bar formatting, but the Format Bar Styles command (Format menu) gives you complete control over Gantt bar formatting.
Although the Gantt Chart view is often synonymous with project plans, the Network Diagram view (sometimes incorrectly referred to as a PERT chart) is useful for focusing on the relationships between activities.
The Calendar view is especially helpful for those who prefer a traditional “month-at-a-glance” format.
The specific commands available on the Format menu vary with the view displayed, but most views in Project support some degree of customization.