
Chapter 2. Reporting Services Capabilities: Presentation, Navigation, and Programmability
In This Chapter
• Report Layouts
• Report Presentation (Rendering) Formats
• Report Items, Visual Effects, and Charting
• Report Navigation
• Ad Hoc Reports NEW in 2005
• Reporting Services Data Access Features
• Programmability
Building on basics covered in the previous chapter, this chapter provides a deeper overview of features in SSRS, from rendering reports to programmability. Along the way, any new features that were not available in the previous version are pointed out. Specific topics include the following:
• Report layout and rendering
• Report items
• Report navigation
• Ad hoc reporting
• Data access and programmability
Report Layouts
SSRS has three report layout options for developers to choose from during the design phase: tabular (top-down, row-by-row, column aligned output), matrix (top to bottom and left to right, column- and row-aligned output), and free-form. Developers can combine various layouts on a single report. More detailed discussion about report layouts is available in Chapter 11, “Working with Report Items.”
The report presented in Figure 2.1, taken as a whole, has a combination of layouts: free-form and tabular.
Figure 2.1. Tabular and free-form layout.

Tabular Report Layout
The tabular report layout is designed to display column-based data. This type of report is very similar to the way data is presented in a Microsoft Excel worksheet.
In the tabular report, developers can group and summarize data using aggregate functions. Aggregate functions include Sum, Avg, Min, Max, and Count. Tabular report layout propagates from top to bottom, row-by-row and allows grouping rows. Using a Table data region is the most common way to generate the tabular report layout. Unlike a table, a list does not provide item alignment; however, this type of layout could also be created using a list. Figure 2.1 includes a tabular layout.
A large portion of reports are developed in a tabular layout.
Free-Form Report Layout
As the name implies, free-form layout can contain repetitive or nonrepetitive data; items can be free-form, grouped, nested within each other (providing multiple levels of grouping), and/or located side by side. Much like a Microsoft Office document, a report contains three main areas: the body (the main informational content of a report), a page header (the information that repeats at the top of each page of a report), and a page footer (the information that repeats at the bottom of each page of a report).
A header and a footer can contain a limited subset of report items: images, text boxes, and lines. A report’s body can contain any report item. Each report area serves as a free-form container in that it allows you to place report items in any position and, unlike tabular (or matrix) layout, does not restrict this position.
In addition, rectangle and list report items can be used as free-form containers for other report items. A free-form layout is shown in Figure 2.1.
Matrix Report Layout
Matrix layout (see Figure 2.2) is similar to a cross-tab or pivot table in Excel. Unlike table layout, which has a static number of columns and a dynamic number of rows, matrix layout has a dynamic number of rows and a dynamic number of columns. In other words, matrix layout propagates from top to bottom and from left to right. In turn, matrix layout allows grouping and summarizing by rows and columns. Developers can use aggregate functions for each group of rows and/or columns.
Figure 2.2. Matrix report layout.
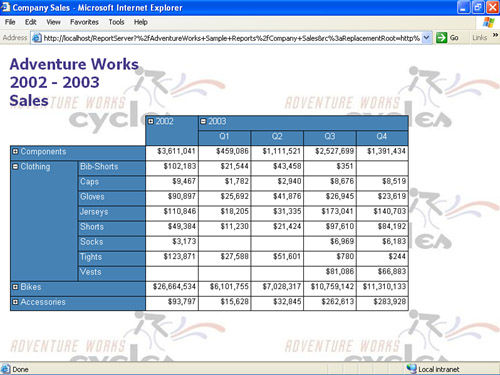
Matrix layout is accomplished using a Matrix data region and cannot be created by any other container.
Report Presentation (Rendering) Formats
SSRS offers a choice of presentation formats for the report. The following formats are available: Extensible Markup Language (XML), web-oriented Hypertext Markup Language (HTML, HTML with Office Web Components, and Web archive MHT), page-oriented such as Tagged Image File Format (TIFF) or Portable Document Format (PDF), and desktop application (Excel and CSV) formats.
Switching between presentation formats is very fast and does not requery data sources. This is accomplished by separation of data processing from final rendering, enabling multiple users to choose different rendering options for the same report.
Report Items, Visual Effects, and Charting
Presentation elements in SSRS are called report items. Report items are very similar to visual controls available in Visual Studio languages, such as Visual Basic and C#. Report items are classified as data regions, containers, and independent report items. Data regions support grouping and sorting of data and provide repetitive display of rows (or groups of rows) from a data set associated with a data region. Independent report items display a single value or a single image.
Containers contain other report elements, including data regions. A container is fixed when the position of a report item is fixed. Most, but not all, of the containers are also data regions. Thus, data regions can be nested within other data regions.
Note
Report Builder does not support nested data regions.
Developers can create visual effects by using rectangles, lines, and images (embedded or referenced) in a report. SSRS has extensive capabilities to specify properties of items on a report, including border, color, background color, and so on. For example, a report can include bold totals and red negative numbers. A report can include score card graphics, like a traffic light, with red indicating problematic areas and green highlighting areas where everything is well.
In addition to static graphical images, reports can include charts. Just like any other data region, a chart has to be associated with one of the report’s data sets to be able to display data. See Figure 2.3 for sample charts.
Figure 2.3. Report using bar and pie charts.

A chart has comprehensive functionality and is very similar by capabilities to an Excel chart with a variety of chart types, 3-D effects, and more. Unlike an Excel chart, an SSRS chart does not build a trend line internally; however, this limit can be overcome by calculating values for a trend line in the data set and then providing it to a chart.
Note
The chart control used in this release of Reporting Services is licensed from Dundas Software (www.dundas.com). In addition, a more comprehensive version of the chart can be purchased from Dundas Software.
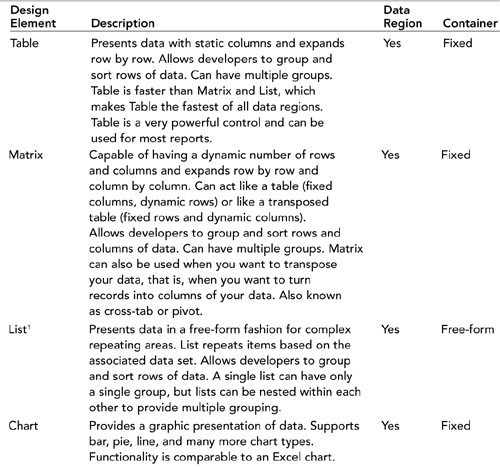
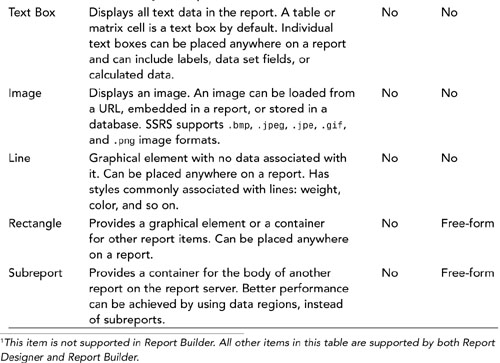
List, Table, Matrix, and Chart report items are data regions. The Line, Text Box, Image, Rectangle, and Subreport report are independent items. Table 2.1 provides a summary of SSRS design elements.
Report Navigation
Developers can add interactive features to navigate to related reports (jump to report or URL) or within a single report (find, go to page, jump to bookmark, and document map). Developers can add links to related reports, reports that have more details (drill down through or simply drill through), or, in general, to any web page. Bookmarks and document maps provide navigation within a large report.
For multipage reports, SSRS provides functionality to move through pages of the report, go to a specified page, and go to the beginning or the end of the report. In addition, users can search through a report for a string that they specify in search criteria.
If a report is too big or too small for a page, the zoom capability comes in handy. Users can zoom-in and zoom-out on the report’s page when using web-oriented formats (HTML, HTMLOWA). Other formats such as PDF handle zoom through corresponding applications, such as Adobe Acrobat Reader.
After a user accesses the Reporting Services site, she can navigate a folder hierarchy to find reports and other items. In addition, reports can be added to a Favorites list in a web browser, presented via a web portal. Users can store and manage reports and other items in a personal workspace.
In addition, users can use an interactive sorting feature—the end users can sort rows in the table interactively by clicking on the column heading. Report developers can enable or disable this functionality.
Ad Hoc Reports NEW in 2005
This is a new capability that was added for SSRS and was not available prior to this release. Microsoft provides the Windows application Report Builder NEW in 2005 tool to support this functionality. Report Builder uses models generated by the Model BuilderNEW in 2005 tool.
Model Builder is a tool used by database developers to abstract the complexities of the database schema, and provide information analysts with a view of “business objects” to which analysts can relate. The model also allows developers to relate the business objects (or entities) to other objects within the database. Because the model contains information on the underlying database schema, as well as how to abstract it, it becomes integral to ad hoc reporting. After a model is complete, it is published to the report server, just as any report.
The Report Builder uses models to provide the end user views of business objects and how they relate to each other. Because the model has information on the relationship between entities, and the underlying database schema, it allows for a feature called “infinite drill down.” This feature allows information analysts to browse through company data with little or no knowledge of SQL.
Reporting Services Data Access Features
SSRS data-processing extensions use ADO.NET-managed providers and support a variety of data sources. SSRS includes the following providers: SQL Server (7.0-2005), SQL Server Analysis Services (2000-2005), Oracle, ODBC, and OLEDB. Other providers are usually available from corresponding database vendors. In general, SSRS can populate reports with relational and multidimensional data from SQL Server, Analysis Services, and other .NET Framework data providers. Developers can also create custom data-processing extensions if there is no provider available for the specific data source.
SSRS allows using multiple data sources and multiple data sets within a single report. This allows developers, for example, to combine data from the SQL Server transactional database, SQL Server Analysis Services data warehouse, and Oracle database on the same report.
Developers can add parameters to refine a query or filter a data set. Dynamic parameters get values at runtime based on user selections (the selection of one parameter can build the value list for a second parameter).
Several new features were added to SSRS:
• NEW in 2005Multidimensional Expressions (MDX) query parameters—A tool that allows you to pass parameters to multidimensional queries.
• NEW in 2005MDX query designer—An intuitive tool to develop multidimensional queries with a simple drag and drop.
• NEW in 2005Data Mining Extension (DMX) query designer—An intuitive tool to develop data-mining queries with a simple drag and drop.
• NEW in 2005Multivalued parameters—A tool that allows you to select multiple parameters. For example, a user might like to be presented with sales data for 2002 and 2003, but not for 2001 and 2004. In technical terms, this is IN(list) selection criteria.
Programmability
This feature provides endless possibilities for developers to extend SSRS. For example, developers can script administrative functionality, execute a report asynchronously1 (using BeginRender and EndRender functions) within their code, and more. Table 2.2 provides a summary of programmable features in SSRS.
Note
1 Asynchronous execution can be also accomplished within a custom extension. Additional asynchronous options are to schedule a snapshot or to subscribe to a report.
Table 2.2. Reporting Services Programmability and Extensibility Features

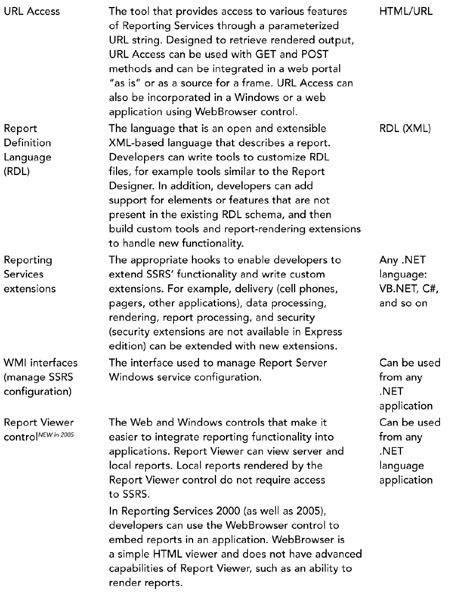

More detailed discussion about each of the programmability features is available in Chapters 22 through 28
Summary
This chapter provided an overview of features in SSRS in the areas of data retrieval, presentation, navigation, and programmability. SSRS added several new features to the future mix that was available in the previous version, to name a few:
• End-user capability to develop ad hoc reports
• Intuitive, drag-and-drop editors for Multidimensional Expressions (MDX) and Data Mining Extensions (DMX)
• New controls to integrate reports (ReportViewer) and report printing (RSPrintClient) in Windows or web applications
• Ability to add custom (not defined in RDL) report items
The next chapter discusses a high-level architecture of SSRS.