
Chapter 12. Grouping, Sorting, and Aggregating Data, Working with Scope
In This Chapter
• Grouping Data on a Report
• Sorting, Including Interactive User Sorting
• Scope of an Aggregate Function
• Level and InScope Functions
Grouping and sorting functionality provides some of the key motivators for purchasing reporting tools. Although every enterprise DBMS has the ability to group and sort data, reports presented to business users usually have multiple levels of grouping inside of them, not to mention lots of pretty pictures, complex layouts, and graphs. A simple query tool is inadequate for this task. This chapter discusses grouping and sorting as well as when it is appropriate to do it in SSRS versus the DBMS. In SSRS, grouping and sorting is available within data regions.
Grouping Data on a Report
Grouping allows you to aggregate items within a group and, in turn, to generate reports with complex formatting. Chapter 8, “Expressions,” covered a set of aggregation functions. Aggregation functions help grouping scenarios by providing totals for groups and subtotals for subgroups. The relationship between an aggregation function and group is controlled by scope. This relationship becomes useful when, for example, a user needs to see what percentage of a total a particular line item is.
In the examples from previous chapters, you have seen summarizations that can be done in data regions, such as the Table, Matrix, Chart, and List data regions.
Most scenarios employ grouping in SSRS to aggregate data and generate summary information. Concepts applicable to aggregation in SSRS are very similar to those applicable to the GROUP BY expression in SQL. However, unlike a query, which allows for very limited formatting, SSRS is practically unlimited in its formatting capabilities.
As in many cases in software development, choosing a particular approach is based on several key factors: performance, scalability, elegance, and development time. This is a “magic” formula. The complex part of this is to find the best balance that can solve this “magic.” The best solution is to experiment with various approaches and find the best for a particular application.
In almost all cases, using SQL for grouping provides the best performance. However, a static SQL statement is not very flexible.
The SQL statement might be too complex, lose its elegance, and, especially, not provide required formatting. It might be hard for a developer, who just started working on a newly developed reporting system, to determine what a complex query is doing and why it is not producing the correct result.
The following are some tips to help strike a balance between SSRS’ ability to group and SQL:
• Ideally, use single query with GROUP BY
• Use query grouping (GROUP BY) with WHERE and HAVING clauses if it allows you to reduce the amount of data received by SSRS.
• Do not format or convert data in a query, unless needed for >GROUP BY.
For example, the following query to retrieve a summary of all line items for each order with the result displayed in a Table report item will execute several times faster than using a Table report item to accomplish the same grouping.
SELECT Sales.SalesOrderHeader.SalesOrderNumber, SUM(Sales.SalesOrderDetail.LineTotal) AS SumOfDetails, SUM(Sales.SalesOrderHeader.SubTotal) AS OrderSubTotal
FROM Sales.SalesOrderDetail INNER JOIN
Sales.SalesOrderHeader ON Sales.SalesOrderDetail.SalesOrderID = Sales.SalesOrderHeader.SalesOrderID
GROUP BY Sales.SalesOrderHeader.SalesOrderNumber
The Grouping and Sorting Properties dialog box provides an interface to edit groups for Matrix, Table, List, and Chart.
See Figure 12.1 to view the Grouping and Sorting Properties dialog box for a Table Group.
Figure 12.1. Grouping and Sorting Properties dialog box.

The Grouping and Sorting Properties dialog box will vary slightly in check boxes at the bottom, depending on the report item. For example, List only has Page Break at Start and Page Break at End check boxes.
The following are procedures to display grouping properties:
• List—Right-click on a list, select Properties from the shortcut menu, and click the Edit Details Group button.
• Table Detail—Right-click the detail handler and select Edit Group from the shortcut menu. This group is not very frequently used as it only allows you to group details and does not provide functionality to calculate subtotals.
• Table Group—On an existing group, Right-click a group header or footer handler and select Edit Group from the shortcut menu.
This is a frequently used group and provides functionality to calculate subtotals and pagination functionality for a group.
• Matrix—Right-click a row or column group and select Edit Group from the shortcut menu.
• Chart—Right-click on a chart, select Properties from the shortcut menu, click on the Data tab, and select Edit on either the Series or Category groups.
The number of available grouping properties varies, but Name, Group on Expression (allows for multiple expressions), Document Map Label (or simply label in the case of a Chart item), and Parent Group are always available. The RDL that describes grouping is as follows:
<Grouping Name="OrderGroup">
<GroupExpressions>
<GroupExpression>=Fields!SalesOrderNumber.Value</GroupExpression>
</GroupExpressions>
</Grouping>
Sorting, Including Interactive User Sorting
In SSRS 2005, three options are available to sort results on a report:
• Make the data source (database) sort data on data retrieval by using an ORDER BY clause.
• Make SSRS sort data during report generation. SSRS sorts items that have the Sorting property defined.
• Use the new, interactive sort functionality for HTML-rendered reports only. This functionality makes SSRS regenerate a report with a new direction: ascending or descending.
The RDL that describes sorting is as follows:
<Sorting>
<SortBy>
<SortExpression>=Fields!Name.Value</SortExpression>
<Direction>Ascending</Direction>
</SortBy>
</Sorting>
Interactive SortingNEW in 2005
SSRS 2005 adds a new, interactive sort action that allows users to sort an HTML-rendered report.
The RDL that describes interactive sorting is as follows:
<UserSort>
<SortExpression>=Fields!Name.Value</SortExpression>
</UserSort>
A developer can set up this type of sorting though a text box’s property UserSort or through the Interactive Sort tab of a text box’s property sheet (see Figure 12.2).
Figure 12.2. Interactive sorting.

To determine the proper position of an interactive sorting control, visualize the output and decide what location makes sense for the interaction to occur. For example, to sort values within a group, a cell in a group header should contain an interactive sort control.
The following are the components of an interactive sort:
• Sort expression (required)—Normally, is a column expression for the column to be sorted. For example, if the designer needs to sort a column that contains the expression =Fields!FirstName.Value, the same expression is used for sorting. In a few cases, the designer might choose to use different expressions for sorting; for example, the designer might decide to use =Fields!UserId.Value if UserId is sequenced in the same sort order as FirstName.
• In data region or grouping to sort current scope—Enables sorting on the repeated rows in the data region that contains the sort item. The scope must be the current scope, a peer scope that is a data region, or an ancestor scope. The Choose Data Region or Grouping option allows you to select a specific data region or group (for example, if a developer wants the sort to affect additional data regions or data regions other than the one that contains the sortable item).
• Evaluate sort expression in this scope—Specifies which data regions or groups are sorted. Setting these options is useful if you are targeting a specific data region and want to further specify where sorting occurs within that data region.
• Detail scope—Sorts only the repeated rows of the selected data region.
• Data region or grouping—Selects a specific data region or group on which to sort.
There is nothing magical about interactive sorting behind the scenes. If you look at the rendered report’s source, you will notice the following pieces of the puzzle were added to your field to be sorted:
<a style=”cursor:hand;” onclick=”return ClientReportctl00.ActionHandler('Sort’,’18_A’);”>
<IMG SRC=”<ReportViewerControlURL><DisplayImageReportViewerCommnand><ImageName>”/>
ImageName is initially unsorted.gif and changes to sortAsc.gif or sortDesc.gif, depending on the direction of the sort. This is internal functionality to SSRS and you do not want to mess with it. It reveals that the “magic” is simply scripting. You can further explore this functionality by adding more interactive sort fields and observing changes in rendered HTML and the report’s URL.
Data Source Sorting
A designer can use the ORDER BY clause in a query. In this case, the database performs sorting. Especially in cases in which the amount of data is large, this provides the best performance. In this case, a developer needs to consider performance implications for the database server. In addition, because the query approach has a scope of an entire data set, it might not provide needed fine-tuning for data sorting.
When necessary, a designer can parameterize data source sorting by using the following expression used as the query in a data set: =”SELECT {fields} FROM {table} ORDER BY “ & Parameters!MySort.Value.
Parameter MySort should contain a valid list of database fields or numbers corresponding to the fields to use in ORDER BY.
For example, to retrieve a list of employees, use the following expression:
="SELECT FirstName, LastName, Title FROM Employee ORDER BY " & Parameters!MySort. Value
,In this e,xample, MySort could be set to a nonqueried parameter with the values FirstName and LastName or values 1 and 2. For more details about parameters, including information on how to pass a parameter value to a report, refer to Chapter 10, “Report Parameters.”
For dynamic query expressions, developers need to make sure that Parameters!MySort.Value properly corresponds to a database field or fields. In addition, a dynamic query expression has to return a valid query. Each properly placed space is crucial, such as the space between ORDER BY and a parameter.
Query design has to follow best practices to avoid SQL injection. Here is a good article on avoiding SQL injection attacks: http://msdn.microsoft.com/msdnmag/issues/04/09/SQLInjection/.
Data Region and Group Sorting
A designer can implement sorting for a group or a data region by providing one or many expressions for the Sorting property of each, as shown in Figure 12.3.
Figure 12.3. Sorting expressions.

Similar to data source sorting, an expression can, for example, sort by FirstName and LastName. Of course, fields used in expressions in this case will belong to the Fields collection. That is, the sorting expressions will have the form of =Fields!FirstName.Value and =Fields!LastName.Value. FirstName and LastName by default have the same name as fields retrieved by the data source (or database field names), but could be changed to different names. Similar to data source sorting, sort expressions can take advantage of parameters. For more details about parameters, including information on how to pass a parameter value to a report, refer to Chapter 10. The expression that incorporates parameters has a form of =Fields(Parameters!{ParameterName}.Value).Value. For example, if the parameter MySort is used, the expression will be =Fields(Parameters!MySort.Value).Value. In addition, expressions can include flow control functions, such as IIF().
Sorting is performed in the scope where the sort is specified. For example, if you have a table that contains a group, sorting expressions specified for a table will not affect the data sort in the group.
Scope of an Aggregate Function
The Scope parameter defines the scope in which the aggregate function is performed. A valid scope could be
• A string name of data set.
• String name of containing grouping.
• String name of containing data region. Within the data region, Scope is optional for all aggregate functions except RowNumber().
• Omitted, when optional. In this case, the scope of the aggregate is the innermost data region or grouping to which the report item belongs. If the item is outside of a data region and there is a single data set, Scope refers to this single data set. If there are multiple data sets, Scope cannot be omitted. In the case of multiple data sets, SSRS provides an explicit reference if the designer drags and drops a field outside of the data region.
• A keyword set to Nothing. This is only allowed inside of data regions. In this case, the scope of the aggregate is the outermost data region or grouping to which the report item belongs.
Tip
Scope is a context-sensitive string, thus Dataset1 and dataset1 are different Scope values.
If the containing group or data region is not used as scope, then SSRS throws an error: “The Value expression for the <Item> ’<Item Name>’ has a scope parameter that is not valid for an aggregate function. The scope parameter must be set to a string constant that is equal to either the name of a containing group, the name of a containing data region, or the name of a data set.”
The Scope parameter cannot be used in page headers or footers.
For RowNumber to generate expected results, the expression containing this function has to be in the “detail” row and not on the “summary” row like a group header or footer.
Table and Matrix report items can have multiple defined scopes. Table can have multiple row scopes. Table with a single group has three scopes: entire data set, entire Table for detail rows, and one for a group. Matrix can have multiple scopes defined on rows and columns. Because Matrix requires at least one row and at least one column group, it has at least four scopes: entire data set, Matrix for details, scope, and one for each of the groups.
Level and InScope Functions
Level([Scope]) returns a zero-based (top level in a hierarchy is 0) Integer—the current level of depth in a recursive hierarchy.
If Scope specifies a grouping with no Parent element, data set, or data region, Level returns 0. Child group, which specifies Parent, can only have a single group expression. If Scope is omitted, it returns the level of the current scope.
Level can be useful to provide indentation, for example, a hierarchy of employees in a sales department. To provide indentation, a designer needs to
• Retrieve EmployeeId and ManagerID from a database.
• Specify the hierarchy by setting the Parent of a group to ManagerId.
• Specify padding as Padding.Left = (2 + Level()*20) & “pt”.
The InScope(Scope) function returns True if the current instance of an item is within the specified scope. Practical usability of InScope() is mostly limited to data regions that have dynamic scoping, such as Matrix and Chart.
To illustrate how scope works, let’s capitalize on the example used previously for Matrix and change the detail cell to the following expression:
= "Scope ="
+ IIF(InScope("RG_SalesOrderNumber"), "RG_SalesOrderNumber," , "")
+ IIF(InScope("RG_ItemName"), "RG_ItemName,", "")
+ IIF(InScope("RG_static"), "RG_static,", "")
+ IIF(InScope("CG_OrderQty"), "CG_OrderQty,", "")
+ IIF(InScope("CG_static"), "CG_static,", "")
+ IIF(InScope("matrix2"), "matrix,", "")
+ IIF(InScope("DataSet1"), "DataSet1,", "")
+ ")"
Remember there are several groups in that example that denoted “RG” for row group and “CG” for column group. The same example also has the Matrix item and a data set.
You will see the resulting output similar to the following.
Scope = Scope =
RG_SalesOrderNumber, RG_SalesOrderNumber,
RG_ItemName, RG_ItemName,
RG_static, RG_static,
CG_OrderQty, CG_OrderQty,
CG_static, CG_static,
matrix, matrix,
DataSet1 DataSet1
Scope = Scope =
RG_SalesOrderNumber, RG_SalesOrderNumber,
RG_ItemName, RG_ItemName,
CG_OrderQty, CG_OrderQty,
CG_static, CG_static,
matrix, matrix,
DataSet1 DataSet1
We have used strikethrough text to indicate information that is not presented on the actual output.
This example provides insight on Scope information and clearly identifies each type of cell on a Matrix. Table 12.1 presents a summary of the Scope.
Table 12.1. Scope of Cells in Matrix
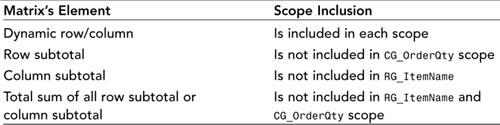
This knowledge allows developers to implement advanced formatting. For example, InScope() can be used to highlight rows with subtotals or to create a drill-through link with capabilities to access different reports, depending on the clicked cell.
Type a drill-through link expression in BackgroundColor of a Matrix’s cell. This highlights the last row for an order:
=IIF(Not InScope("RG_ItemName"), "LightGrey", "White")
Summary
Grouping and Sorting is a separate reporting tool from a simple query tool. Matrix and Table both have the capability to perform multiple levels of grouping. Matrix provides the ability to group across multiple columns as well as rows. Although List can only contain a single grouping, nesting a list creates the same effect as multiple grouping.
SSRS provided multiple ways to allow for sorting. Data regions can sort data statically, as well as provide an interactive sort. Using query parameters and expressions, it is also possible to make Dynamic SQL to do sorting within the database.
Scope is another critical aspect of sorting and grouping. In most cases, scope is handled effortlessly by default. In the cases in which scope is dynamic, SSRS provides an InScope function to check and see if a scope is valid.