
Chapter 16. Ad Hoc Reporting New in 2005
In This Chapter
• Issues Facing Ad Hoc Reporting
• Client-Side Reporting with SSRS
• Report Models and the Model Designer
This chapter begins with a few words about needs and challenges for ad hoc reports and some definitions.
A lot of things have changed for business in the post dot-com era, but one thing that remains is the need for accurate and timely data. Most businesses want to analyze and report on up-to-the-minute data. Moreover, a lot of analysts want to analyze the data kept in their organization’s data warehouse(s) to test their theories or to spot trends. This kind of analytical reporting does not preclude the nicely printed and formatted reports for C-level executives, but rather serves as the foundation for new reports.
Issues Facing Ad Hoc Reporting
The challenge in doing this kind of analysis has often been with the technology. Technologists such as report developers are usually keen on SQL and their reporting tools. They know the ins and outs of relational databases, the different kinds of joins, and the concepts behind OLAP. They might or might not be so keen on the business and repercussions of certain trends.
The opposite is most likely true for business analysts. The typical analyst knows what he wants to see or at least has a theory that he wants to collect data for to prove or disprove. Analysts might not know or care that to get a typical sales order, he must join six or seven tables together. Analysts are not technologists.
What the analyst needs is a flexible, yet powerful tool to build his own reports and do his own analysis without overbearing technical terms.
Client-side Reporting with SSRS
SSRS attempts to address these issues with two main tools, Report Builder and Model Designer.
Before a user can create a client-side report, an analyst or technologist must create a report model. The report model is built with the aid of Visual Studio, and contains metadata about the underlying database.
The purpose of the metadata is to describe the relationships between the various tables in the RDBMS in terms of entities, attributes, and relationships (roles), which can then be used by Report Builder users to help them build ad hoc reports.
This helps to abstract the DBMS into business objects that the nontechnologist should recognize.
The second part of the equation is the actual Report Builder. The Report Builder is the tool used to create ad hoc reports.
It is a Windows forms-based .NET application that can be accessed through a URL (using the http://<localhost>/reportserver/reportbuilder/reportbuilder.application URL, where <localhost> is the name of the computer that is running Report Server) or from Report Manager (using the http://<webservername>/reports URL and then clicking Report Builder).
Report Builder uses the report model to present the end user with the abstracted view of business objects. Although Report Builder is a powerful report-development application, Visual Studio provides many more features for report developers and is required to build models for Report Builder’s consumption.
Report Models and the Model Designer
As previously mentioned, the first step in creating end-user reports is the creation of the report model. The model is written in a declarative language called Semantic Definition Model Language (SDML). The Semantic Definition Model Language is based on the Unified Modeling Language (UML), and it contains many of the same paradigms. It is similar to the RDL in that it is an XML-based communications language. The report model abstracts the RDBMS into business objects the end user would recognize.
To be effective for the end user, the model author must include some key pieces of information about the database. This type of information includes the following:
• A map of table names and column names into business objects
• Information about the relationships between tables that would otherwise be stored in primary keys or foreign keys
• Hierarchical information or logical groupings about your objects
• Permissions for users to see objects
From Report Builder, the model aids the user in selecting what information she wants to see, and, consequently, building the query for the data source of the resulting report.
To build these models, model developers must use a tool called Model Designer. Like Report Designer, it is built in to Visual Studio/Business Intelligence Development Studio. The template project type is called “Report Model Project.” Models can be generated against SQL Server or Analysis Services
Note
Model Designer and, subsequently, Report Builder can only build reports against SQL Server or Analysis Services. To build reports for other data sources, such as Oracle, you can employ linked servers or the unified data model (UDM). Both provide a thin abstraction layer.
Developers can generate models in two ways. The first way to generate models is based on a set of preexisting rules. This is the way the wizard and the autogenerate functionality work. The other way is to connect using a data source, and start designing the model by hand.
You will take a look at both methods later in this chapter.
Report Model Projects
As previously mentioned, report model projects are what the Model Designer uses to generate models. There are three kinds of files that it uses to generate models. These files correlate to the major steps in models generation. The first kind of file is the Data Source (.ds).
The second type of file is the Data Source view. The Data Source view provides the model information about the underlying data store. It is kind of like an entity relationship diagram, in that it provides information about the database schema, but is written in XML. The model uses the Data Source view to query the database, making the Data Source view the bridge between the model and the data source. The final type of file is the actual model file (.sdml). The model can only reference one data source, and one Data Source view.
Model File Content
A report model contains three main sections:
• Semantic models—A collection of business objects in terms familiar to a business analyst.
The semantic model also contains the relationships of these business objects to one another.
• Physical model—The outline of the database schema. This contains information about the tables and views in the data source.
• Bindings—The map between the physical model and the semantic model.
The data source and Data Source view are used to make up the physical model. The semantic model is a combination of the physical model along with semantic objects and bindings.
Entities
The first of these objects is called an entity. The entity is really the crux of the semantic model because it maps tables and views.
An entity can map to multiple tables or views, and itself has a collection of objects called attributes, expressions, folders, and source fields. Entities should have names that are recognizable to a business analyst. For example, instead of the obscure table name tbl_sls_ordr, the entity would be named Sales Order.
As you add relational items to the Data Source view, you can map these items into entities. The binding property of the entity tells Report Builder the table(s) or view(s) to which the entity refers.
Roles
In a way, roles take us back to Database Design 101. Roles store information about the relationship between entities. The relationship information is basically the cardinality between the objects. This can be one to one, one to many, or many to many. As an example, a store entity can have only one address, whereas a customer can have many orders. Roles also contain information about which attributes in each entity are the defining ones in terms of the cardinality relationship. So, if the AddressID field on the store entity is what you need to obtain the proper address data from the address entity, then the role that contains information about the relationship storing that AddressID is the field to use to correlate the two entities.
End users see the relationships play out when browsing entities in Report Builder. Roles are also what enable the infinite drill-down feature in Report Builder.
Source Fields and Expressions
If roles contain information about the primary and foreign fields, source fields contain information about the columns. A source field is an attribute that maps to a table column and gives the column a friendly name. Source fields can only be added after the parent entity’s binding property has been set. For example, LastName on the Person table could be a source field on the person entity.
Expressions should have a familiar ring to them. Expressions in a report model take one or more source fields, and manipulate them with functions, operators, and/or constants to derive a calculated value. These expressions are just like expressions in Report Designer. They are based on VB.NET, and automatically provide access to System.Math and System.Convert. Functions from the Microsoft.VisualBasic namespace and references to other assemblies or custom code can be used as well.
A good example of what could be an expression is the combination of FirstName and LastName to create a new field called Name.
Folders
Folders allow you to group collections of entities. Folders can also contain other folders and perspectives. Folders allow you to add hierarchical information to the model. Folders can also be used to group items together regardless of hierarchical relationships. For example, because Report Builder users can navigate folders in a manner similar to Windows Explorer, you can move infrequently used items into a folder to hide them from the users.
Perspectives
Perspectives help to give us a narrower view or a view of a subset of the model. Per-spec-tives can help limit users to see only information to which they have access. For example, a company might have a model that contains information about all the financial data items for that company. One of the things perspectives can help us do is to limit what budgetary information users can see to only information about their department’s budgets.
Perspectives are contained in the model, and the model designers and wizards don’t create them for you. They have to be manually created and model items must be placed in them. Perspectives can contain other model objects, such as entities folders, roles, source fields, and expressions. Just by placing items into a perspective does not exclude them from the rest of the models. Items can still be placed in other folders and perspectives.
Creating a Model Project
To create a model, you need to complete a few steps. The first is to create a report model project. Then, you give the project a data source and a Data Source view. Finally, you can create the models. In the following steps, you create a model based on the AdventureWorks catalog:
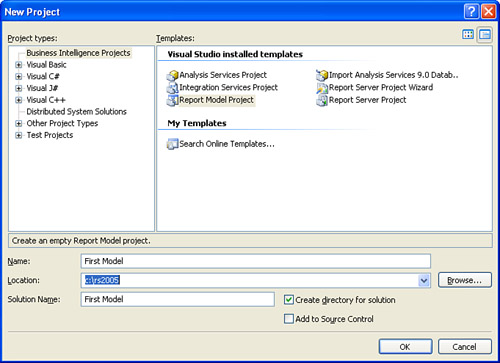
1. Create a new project. Open Visual Studio or Business Intelligence Development Studio. Click File and then New Project.
2. In the dialog box that opens, if not selected by default, select Business Intelligence Projects under Project Types.
3. Under Templates in the right pane in the active dialog box, select Report Model Project.
4. Call the project “First Model” and change the location to C: s2005. Make sure Create Directory for Solution is checked. See Figure 16.1.
Figure 16.1. Creating new business intelligence projects.
Creating a Data Source
Now that you have an empty project, the next thing to do is connect it to a data source. Remember the data source has to be SQL Server (or abstracted through linked servers or UDM).
Unlike Report Designer, no other data sources are accepted directly:
1. Open Solution Explorer and right-click on the Data Sources folder. Click Add New Data Source. This launches the New Data Source Wizard.
2. Skip the welcome page by clicking Next.
3. On the next page, select Create a Data Source Based on an Existing or New Connection, and then click New.
4. Enter “localhost” as the name of the server to connect to.
5. Select Windows Authentication.
6. In the Select or Enter a Database Name list, select “Adventure Works.”
7. Click Test Connection; if you get an OK dialog box, click OK. If not, try to resolve the error using the debug information given, and then try again.
8. Click OK. At this point, you should have a screen that looks similar to Figure 16.2.
Figure 16.2. Defining the connection.

9. Click Next.
10. At this point, you could change the name of the data source. If it is not already, call the new data source Adventure Works.
11. Click Finish.
A new data source called Adventure Works should appear in the Data Sources folder in Solution Explorer.
Creating a Data Source View
The next step in the creation of a model is the creation of the Data Source view. Recall, from earlier, that the Data Source view contains information about the physical layout of the database. To create a Data Source view, complete the following steps:
1. Open Solution Explorer and right-click on the Data Source Views folder. Click Add New Data Source View. This launches the New Data Source View Wizard.
2. Select the Adventure Works data source and click Next.
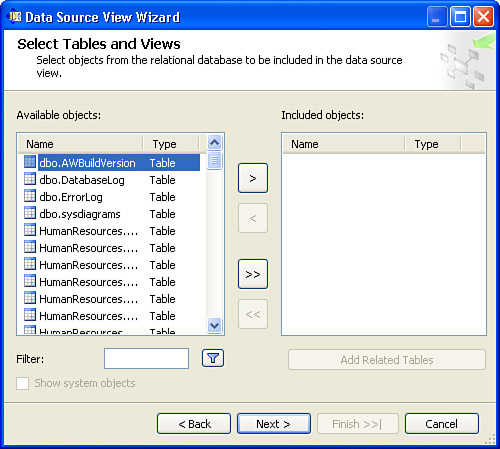
3. The next screen asks you to select the tables and views that are going to be included in the semantic model. Click the >> button to move all the objects from the Available Objects list box to the Included Objects list box. See Figure 16.3.
Figure 16.3. Selecting the tables and views.
4. Click Next.
5. Name the Data Source view “Adventure Works DSV.”
6. Click Finish.
A new Data Source view called “Adventure Works DSV” should appear in the Data Source Views folder in Solution Explorer.
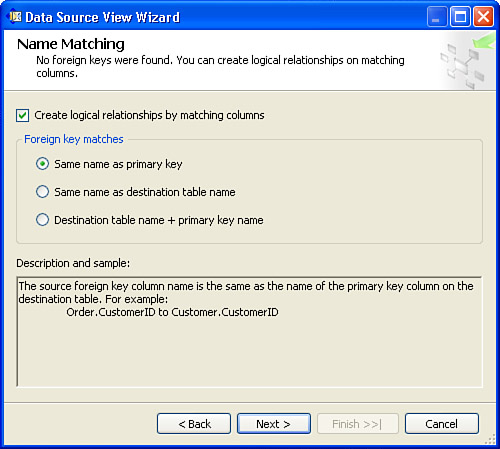
The wizard is smart enough to detect if the underlying data source has no foreign key constraints. In this case, the wizard gives you an extra screen before selecting which tables to include in the Data Source view. The screen gives you three types of matching logic so it can infer relationships in the data store. If your DBMS does not follow any of these conventions, you will have to add the data source relationships yourself. Figure 16.4 shows you a copy of the screen.
Figure 16.4. Name Matching screen of the Data Source View Wizard.
After the wizard is complete, double-click on the Adventure Works DSV file in Solution Explorer. This opens a document showing you the relationships that the wizard has just inferred. See Figure 16.5.
Figure 16.5. Data Source view.
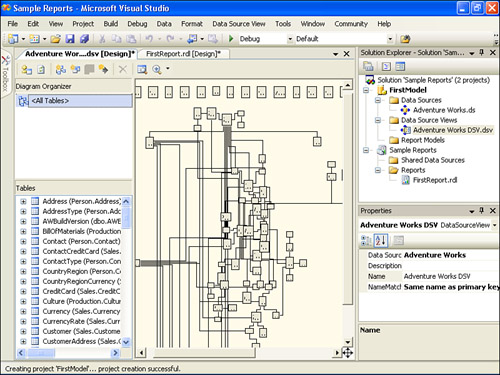
To get the document to fit on one page, you might have to click the View menu, point to Zoom, and then click To Fit.
Creating a Report Model
Finally, you can create the actual model. To create the model, complete the following steps:
1. Open Solution Explorer and right-click on the Report Models folder. Click Add New Report Model. This launches the New Report Model Wizard.
2. Click Next on the welcome screen.
3. The next screen is the screen to select Data Source views. At this point, only the “Adventure Works DSV” should show up. Select this and then select Next.
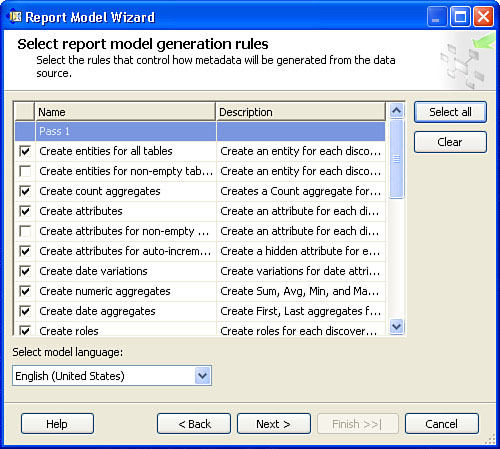
4. The next screen is the Model Generation Rules screen, which is shown in Figure 16.6. This allows you to select from a predefined set of rules to ease the model generation process. For our purposes, the defaults are fine. Click Next.
Figure 16.6. Selecting report model generation rules.
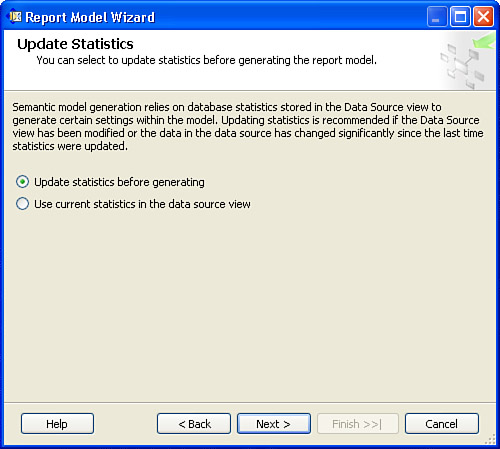
5. The next screen asks you to create statistics. Because Report Builder uses database statistics to aid it in the model generation process, it is important to make sure your statistics are up to date. Otherwise, it might miscalculate some factors, such as drill down and aggregates. It is recommended to update statistics whenever the data source or Data Source views have changed. Click Update Statistics Before Generating, if necessary.
Click Next. See Figure 16.7.
Figure 16.7. Update Statistics screen of the Report Model Wizard.
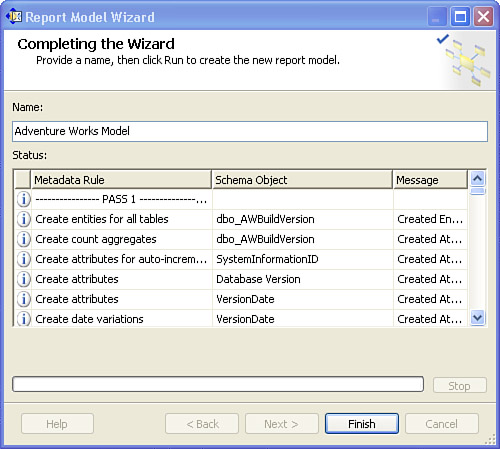
6. Name the model “Adventure Works model,” and then click Run. Figure 16.8 shows the resulting screen.
Figure 16.8. Completing the Wizard screen of the Report Model Wizard.
7. Click Finish. Figure 16.9 shows the completed model.
Figure 16.9. Completed database model.

Modifying Items in the Model
The way entities show up in the Model Designer reflects how they will show up in Report Builder. To make things more meaningful for the end user, many of the properties or entities can be customized. Working with the model involves some of the same basic concepts as working with Report Designer. The properties of any object can be modified from the properties window.
Some of the things you can customize include sorting, instance selection, and inheritance. What this means is that attributes can be set to come from other entities or that users can see a filtered list of instances of an entity. Entities can also predefine formatting of their attributes. For example, attributes that reflect currency can be formatted as currency depending on the user’s localized settings. The order in which things appear in the entity browser can also be customized. By default, entities appear sorted in alphabetical order, but you can move certain entities to the top if users are going to report off them frequently.
To modify items in the model, it is simply a matter of right-clicking in the treeview or listview. The Report Model menu in the Model Designer also gives the same menu options. To delete any item, simply navigate to the item, right-click it, and choose Delete from the shortcut menu.
To add an entity, folder, or perspective, do the following:
1. Navigate to the top of the treeview.
2. From the Report Model menu, select New Entity, New Perspective, or New Folder.
From this point, each of these items has their own caveats.
If you choose to add a new entity, the name given to the entity is simply NewEntity. You must navigate to NewEntity, right-click it, select Rename from the shortcut menu, and rename it to what you want. To be effective, the binding information has to be set as well. When adding folders, a similar process has to be followed. You must navigate to the entity or to the top entity in the tree, right-click it, and select New Folder. A new folder called New Folder is created. The location of the new folder is dependent on where you were when you right-clicked to add the new folder. You must right-click on it, and select Rename from the shortcut menu to rename it.
To add a new role, attribute, or source field, click on any detail item, and then select the option you need from the Report Model menu. When you add a new role, a pop-up appears with a list of entities. Select an entity, and then assign the bindings in the properties window. Role bindings are nothing more than a list of relations defined in the Data Source view. When adding or modifying an expression, the Expression Editor is shown. From here, you can design the expression and name it. When adding a source field, select New Source Field from the Report Model menu. After adding the source field, you must rename it and set the bindings from the properties window. Source field bindings refer to a list of columns from the Data Source view.
When adding or modifying perspectives, a specialized dialog box opens that allows you to add/remove items from the perspective.
When adding and removing perspectives, you might notice that adding one object seems to add others, and removing it removes other objects as well. This is because of the hierarchical nature of the items. When a parent item, such as a folder or attribute, with variations get added or removed, all of its children get added and removed as well. The same thing applies for roles and identifying attributes. When a role is selected, the corresponding role is selected along with the entity it leads to. The reverse is also true. When an identifying attribute is deselected, any other entities that use that identifying attribute get deselected as well. To reselect those entities, the identifying attribute must get reselected.
Publishing the Model
When you are done creating or updating the model, you can publish the model just as you would a report. In a published model, the data source and the SMDL file (semantic model file) are placed in the Report Server. Because the information in the Data Source view is incorporated into the semantic model, the Data Source view does not get published. If the information in the Data Source view, or for that matter, anything in the semantic model, needs to be updated, simply publish an updated model.
After the model is published, it can be secured using Reporting Services’ role-based security. To use the model in Report Builder, a user must have access to it.
After you are ready to deploy the semantic model, the deployment steps closely resemble the deployment steps in Report Designer.
1. Right-click on the project file in Solution Explorer, and select Properties.
2. Review the target folder’s properties. There is one target folder for the data sources, and there is another target folder for the semantic models.
3. Verify the Overwrite Data Sources option is on the intended setting. This option is similar in name and function to the one in Report Designer.
4. Click OK.
To deploy the model and data source, right-click on the project file in Solution Explorer, and select Deploy from the shortcut menu. To deploy just the model file, right-click on the semantic model and click Deploy.
Creating Models from Report Designer
A second way to create a model is from Report Manager. Report Manager has the ability to take any SQL Server or Analysis Services data source and generate a model from it. You can complete the following steps to generate a model from Report Manager:
1. Go to the Report Manager web page. By default, it is located at http://localhost/Reports.
2. Click the New Data Source button.
3. Enter a name for this data source. Call this “AdventureWorks DS”. You can also enter a brief description.
4. Enter a connection type of “Microsoft SQL Server”.
5. Make sure that the Enable This Data Source check box is checked.
6. Enter “Data Source=localhost;Initial Catalog=AdventureWorks” in the Connection string text box.
7. Select Windows Integrated Security.
8. Click OK. You should return to the Folder view screen. Click on the data source you just created (“AdventureWorks DS”).
9. Click the Generate Model button.
10. Enter a name for this model. Call it “Adventure Works DS Model.” If you want to, you can change where the model is located and give it a description. For now, just leave these fields blank.
11. Click OK.
Features of Report Builder
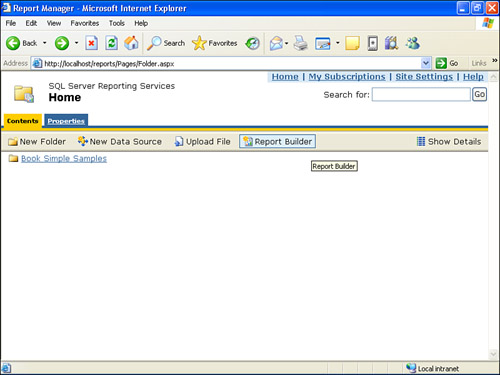
Report Builder is the second part of the two-part solution for end-user reporting. As previously mentioned, Report Builder is a click-once, client-side .NET application that can be launched from the Report Manager website. Report Builder uses Microsoft Office paradigms, so it should be easy for end users who use Microsoft Office to start using it, yet it still creates reports using standard RDL. Figure 16.10 shows how to access Report Builder.
Figure 16.10. Starting Report Builder from the Report Manager web interface.
Report Builder uses the models stored on the Report Server. Report Builder calls these models data sources, not to be confused with the data source that is part of the model. Through Report Builder, the end user knows nothing of the actual data source used by the model. End users will most likely be referring to the model as the data source, as shown in Figure 16.11. Keep in mind that because the models are secured by the Report Server, users will not be able to access models to use as data sources for their report if the appropriate permissions have not been set.
Figure 16.11. Selecting a model to use with Report Builder.

Report Builder has predefined templates available for matrix, table, and chart report layouts. Note that lists and rectangles are not supported. To use a template, the user simply has to click on a template in the left pane. The Report Builder interface is presented in Figure 16.12.
Figure 16.12. Report Builder after the model selection.
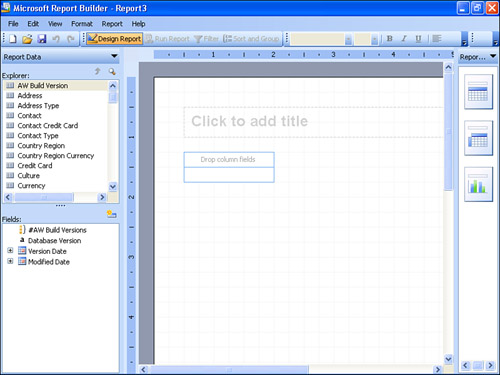
After selecting a template, the end user simply has to drag and drop fields from the Report Data Explorer onto the data region provided. Report Data Explorer is nothing more than the entity explorer. Attributes and expressions make up the fields that are usable from within the entity explorer.
Some basic features are also available through Report Builder. Formatting can be done to any text box on the report layout. Data can be filtered, sorted, and grouped. A full range of export formats, such as PDF, TIFF, Excel, HTML, XML, CSV, and TIFF are also available to end users.
Report Builder saves reports to the Report Server. After being published, the reports can be managed like any other reports.
Building Reports with Report Builder
Building reports with Report Builder is fairly simplistic compared to Report Designer. The complexities of connecting to the data source and SQL Server are taken care of by the model. All that needs to be selected are attributes and expressions from the entity explorer.
First, launch Report Builder. After launching Report Builder, a list of models appears that are available for you to use as your data source. Refer to Figures 16.11 and 16.1216.12 for reference. After selecting the data source, Report Builder opens up to the report layout section. Figure 16.12 shows what the screen should look like in the default table view.
On the left side is the entity explorer. Below the entity explorer is the list of attributes and fields. On the right side is the list of style templates—Table, Matrix, or Chart. By clicking on one of these templates, you can create a new report with that layout.
Now, let’s try to build a simple report with Report Builder.
The requirements for this sample report are as follows: The marketing department wants to see the breakdown of subtotals for sales orders by quarter and by year. They are not sure what mechanism would be best to display the data, so they request it in tabular format and in a pivot table.
Tabular Report
Complete the following steps to produce the report:
1. Select Table Report from the Report Layout menu on the right side.
2. Select Sales Territory from the entity explorer.
3. Under the Explorer pane, though still on the left side, is the list of fields and attributes. Select a name and drag it over to the layout view where it says “Drag and drop column fields.”
4. After dragging the name over to the layout view, the entity explorer should have switched to entities that have a role relating to sales territory. From this list, select Sales Order Headers.
5. From the Attribute Fields menu, drag Order Year, which is located under Order Date, over next to the Sales Territory name. The mouse pointer should turn blue to signify that the table is ready to add a column.
Note
The Model Builder automatically creates expressions based on dates. These expressions are usually date parts.
Certain entities and attributes also might have a ’#of <Entity>’ expression. The rules chosen during the wizard are the driving factor behind these. The Model Builder also chose whether to include a distinct count of values based on database statistics.
6. Drag Order Quarter (also located under Order Date) over next to Order Year.
7. Drag Total Sub Total over next to Order Quarter. After doing this, notice three total lines that appeared. One of the nice features of Report Builder is that it automatically groups and sums data for you.
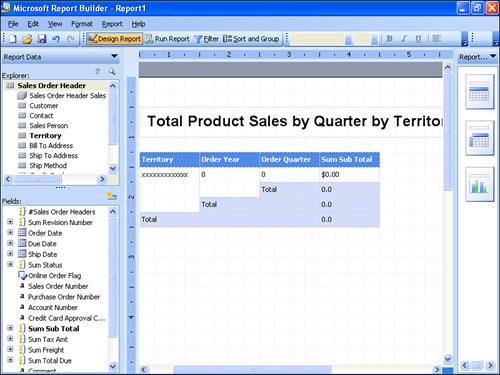
8. Enter Total Product Sales by Quarter by Territory in the text box above the table where it says “Click to add Title.”
Figure 16.13 should show you what your report should like.
Figure 16.13. View of a report in Report Builder.
The report can be previewed by clicking on the Run Report button from the toolbar.
Click-Through Reports
When the report is in Preview mode, the end user can hover over the Sum of Sales Totals number and notice that it is actually a link to another report. This type of report is called a click-through report and is automatically generated by Report Builder.
Click-through reports are based on roles. After a user has selected to display a certain type of aggregate attribute, if the attribute has roles linking over to another entity, Report Builder automatically generates a report listing the contents of that aggregate. You could potentially drill down to the lowest level, and at each stage Report Builder would generate a report based on that entity. This feature is called infinite drilldown. It is one of the benefits of putting work into generating models that contain information about all the relationships in the DBMS.
Saving/Publishing Reports
Now that you have completed this basic report, let’s try to save it. Unlike in Visual Studio, the RDL file that has been generated by Report Builder cannot be saved on the user’s hard drive. To save client-side reports, users must have access to publish reports in at least one folder on the Report Server. An easy way to enable this access is to enable the My Reports option on the Report Server.
This gives users permissions to their own My Report folder.
After enabling My Reports, saving a report is a simple matter. The menu options inside Report Builder are similar to the same commands in Microsoft Office. The only difference is that you are saving to the Report Server and not a file server. To save the existing report to the Report Server and call it “Sales by Territory—Table,” follow these steps:
1. Click the File menu, and then click Save As.
2. In the root folder of the Report Server, enter the filename “Sales by Territory—Table,” and click OK.
Matrix/Pivot Table Report
Now, let’s continue on to make the same report using a pivot table or matrix. The concepts are the same; just the data region is different.
1. If you have already closed Report Builder, reopen it.
2. Select the Matrix Report style from the Report Layout section on the right pane.
3. From the entity explorer, select Sales Territory, and drag the name attribute over to the matrix where it says “Drag and drop row groups.”
4. From the entity explorer, select Sales Order Headers, and drag the Order Year under Order Date to the matrix layout where it says “Drag and drop column groups.”
5. Similarly, select Order Quarter and drag it over to the matrix columns groups. Place it under Order Year. The mouse pointer should turn blue when it is ready to add a column group.
6. Select Sum Sub Total and drag it to the detail section of the matrix where it says “Drag and drop totals.”
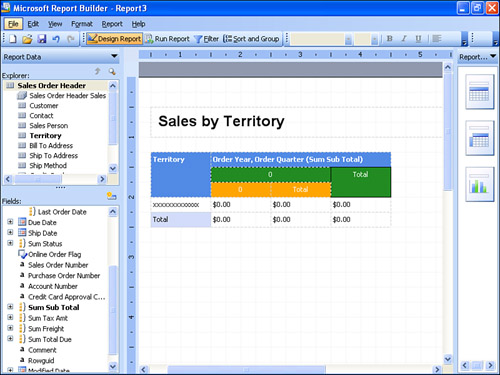
7. Add a title to the report; call it Sales by Territory.
8. To make things easier to see, let’s use some basic formatting to separate the quarters from the years. Right-click the inner 0, and select Format from the shortcut menu.
9. Go to the Fill tab and select Gold as the color. Then go to the Alignment tab and choose Center for the horizontal alignment. Do the same for the Adjoining Total text box. This should make all quarters-related information headers gold.
10. Do the same thing to the upper 0 and the adjoining total, except select Green as the color. Select Center for the horizontal alignment. On the Border tab, click the Outline button to put an outline border around the year.
11. Right -click the Sum Sub Total text box, select Format from the shortcut menu, go to the Number tab, and select the currency format.
When everything is complete, your report design should look similar to Figure 16.14.
Figure 16.14. Finalized report design.
When the report is previewed, it looks similar to Figure 16.15.
Figure 16.15. Preview of the report in Report Designer.
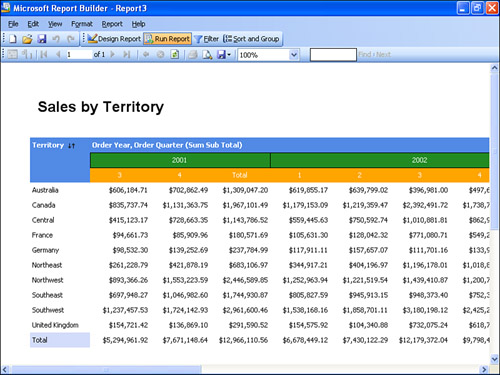
Save this report on the Report Server as “Sales by Territory—Matrix.”
Summary
End-user reporting provides some fairly significant challenges. SQL Report Services answers this challenge with a combination of tools: the Model Designer and Report Builder.
The Model Designer is used by someone familiar with the data source to create a model that represents the database objects in terms of business objects.
The idea is to present the end user with collections of objects that they would recognize.
Report Builder is a Windows forms-based application that can be launched from the Report Manager website. It uses the report models as a data source, and, in combination with user input, it generates standard RDL documents as reports. Report Builder uses Microsoft Office paradigms so end users who use Microsoft Office should take to the product easily. The reports can then be saved onto the Report Server for later use.