
Chapter 20. Report Execution and Processing
In This Chapter
• Managing Schedules
• Report Execution and Processing
• Report Execution History
In this chapter, you explore some of the information that can be captured at runtime, and learn how to set up shared schedules that can be used to coordinate actions within the Report Server.
Managing Schedules
Schedules are used within SSRS to trigger executions of subscriptions and snapshots, generally classified as events. Schedules can trigger a one-time event, or cause events to run continuously at specified intervals—monthly, daily, or hourly.
Schedules create events on the Report Server. Actions within the Report Server, such as expiring a snapshot or processing a subscription, are triggered by the event. What SSRS actually does is create a scheduled job on the database server that hosts the SSRS database. The SQL Agent then runs the jobs, which usually contain nothing more than the command to execute a stored procedure to trigger an event. The other half of the Scheduling and Delivery Processor within SSRS is the Report Server Windows service referred to as SQL Server Reporting Services under services in Control Panel.
This service is responsible for querying the database server for events and running the processes that those events trigger. Both sides of the Scheduling and Delivery Processor must be enabled for it to work. If the SQL Agent on the database server is turned off, the jobs do not run, hence the events do not fire and the corresponding actions are not taken. If the Report Server service is down, the jobs show that they ran successfully, but no processing actually occurs.
Types of Schedules
There are two types of schedules used in SSRS: a shared schedule and a report-specific schedule. The relationship is analogous to the relationship between a shared data source and a custom data source. The shared schedule can be used to trigger a number of events throughout the Report Server. A report-specific schedule is used for one and only one specific event. A second event might occur at exactly the same time, but as far as SSRS is concerned, it is a different schedule. Because they are so similar the question often brought up is, “When should you use a report-specific schedule over a shared schedule?” In general, create a report-specific schedule if a shared schedule does not provide the frequency or recurrence pattern that you need.
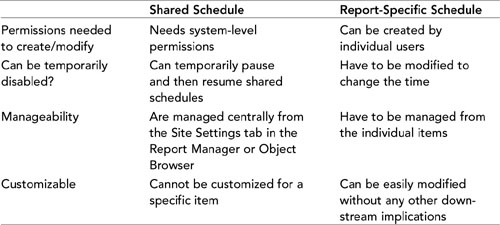
Table 20.1 details the difference between shared schedules and report-specific schedules.
Table 20.1. Shared Versus Report-Specific Schedules
Creating/Modifying Schedules
The process for creating or modifying schedules is generally the same whether it is a shared or report-specific schedule. The only difference is the scope. For the shared schedule, it is created once and can be referenced in a subscription or property page when you need to specify schedule information.
From Report Manager or Object Explorer, administrators can specify which items use the shared schedule. Report-specific schedules are created and referenced by only that one report, subscription, or report execution operation to determine cache expiration or snapshot updates.
To create a shared schedule using SQL Server Management Studio, follow these steps:
1. From Object Explorer, navigate to the Shared Schedules folder, right-click on Shared Schedules, and select New Schedule.
2. Enter a name for the schedule.
3. 3. Select how often you want the schedule to recur or select Once for a one-time event.
4. Click OK.
Alternatively, you can create a shared schedule from Report Manager by completing the following steps (see Figure 20.1):
1. Navigate to Site Settings.
2. Click Manage Shared Schedules under the Other section toward the bottom of the screen.
3. Click New Schedule.
4. Enter a name and how often the schedule should recur, and then click OK.
Figure 20.1. Creating a new shared schedule in SSRS.

After being created, a schedule can be modified at any time. Modifying the schedule of a running process (subscription, snapshot, and so on) does not cause that process to stop. If the process that a schedule triggered is already running, modifying the schedule serves only to start the process again at the new time.
Deleting a schedule does not guarantee that the events that it triggers will stop firing. Deleting a shared schedule only serves to create report-specific schedules for any items that reference it. A better way to stop a schedule is to expire it, by putting an end date on it. Expired schedules are indicated as such by the status field. Schedules that have been expired can be restarted by extending the end date.
Another alternative is to pause a shared schedule. A paused schedule can be resumed at a later date and time. Report-specific schedules cannot be paused. Pausing a schedule is similar to modifying it. Pausing the schedule of a process that is already running or of one that is in queue only stops the subsequent runs. It has no effect on the currently executing process.
Note
Administrators can pause schedules from Report Manager.
To pause a shared schedule, select it from the list of the Report Manager schedules, and click the Pause button. The same process is used to delete a shared schedule.
Report Execution and Processing
SSRS's Report Processor generally executes reports in a three-stage process:
• Data gathering—Involves the process used to get the report definition from the Report Server database, initializes parameters and variables that are in expressions, and performs other preliminary processing that prepares the report for data. The data-processing extension then connects to the data source and retrieves the data.
• Layout processing—Combines the report data with the report layout from the report definition. Data is processed by row for each section. Sections include the report header and footer, group headers and footers, and detail. Aggregate functions and expressions are also processed at this time.
• Rendering—Takes the intermediate format and the rendering extension paginates the report and processes expressions that cannot be processed during the execution stage. The report is then rendered in the appropriate device-specific format (MHTML, Excel, PDF, and so on).
Depending on the method of access, the server determines if it needs to execute all three processes or if it can skip one or two. The trick is in the report history. If the administrator specifies that the report should be rendered from a snapshot or cache, the report is rendered from the intermediate format stored in the database. Otherwise, the Report Server starts its processing from the data gathering stage. Report processing for drill-through reports is similar, except that reports can be auto generated from models rather than report definitions. Data processing is initiated through the model to retrieve data of interest.
Report Execution Timeouts
The time it takes to process a report can vary tremendously. While reports process, they take up time on the Report Server and possibly the report data source. As a matter of practice, most long-running reports take a long time to process due to a long-running query.
SSRS uses timeouts to set an upper limit on how much time individual reports can take to process. Two kinds of timeouts are used by SSRS. The first kind is the query timeout. The second kind is the report execution timeout.
Query timeouts specify how long an individual query can take to come back from the data source. This value is specified inside the reports, by specifying the timeout property while creating a data set. Query timeouts can also apply to data-driven subscriptions.
The report execution timeout is the amount of time a report can take to process. This value is specified at a system level, and can be overridden for individual reports. To set this setting, click the Site Settings tab and modify the Report Execution Timeout property. The default value is 1800 seconds.
SSRS evaluates the execution timeout for running jobs every 60 seconds. What this means is that every minute, SSRS enumerates through every running job and compares how long it has been running against how long it is supposed to run. The downside of this is that reports actually have a bit more time than the specified timeout value in which to run. If the timeout for a report is set to 30 seconds, SSRS does not check to see if it exceeded the timeout until 60 seconds, so the report actually gets an additional 30 seconds of runtime.
Running Processes
A process in the Report Server is also called a job. The two kinds of jobs are user jobs and system jobs. User jobs are those jobs that are started by individual users or by a user’s subscription.
Some examples of user jobs include the following:
• Running an on-demand report
• Rendering a report from a snapshot
• Generating a new snapshot
• Processing a subscription
System jobs are those jobs that are started by the Report Server, including the following:
• Processing a data-driven subscription
• Scheduling a generation of a snapshot
• Scheduling report execution
As mentioned in the previous section, SSRS comes by every 60 seconds and checks on the status of any in-progress jobs. These jobs could be querying their data source, rendering into intermediate format, or rendering into final format. It drops the status of these jobs into the Report Server database. This generally means that a job has to be running for at least 60 seconds for it to be canceled or viewed. To cancel or view running jobs, click the Manage Jobs link under Site Settings. From here, administrators can view user and system jobs and cancel any running job.
Note
Canceling a running job does not guarantee that a query has stopped processing on the remote data server. To avoid long-running queries, specify a timeout for the query during the report development phase.
Large Reports
Most of the reports shown so far in the samples are fairly small and easy to run. However, in the real world, you might run into a report that, when rendered, equals hundreds of pages. For these reports, you need to take into account some special considerations.
First, the amount of time a report takes to process is almost directly proportional to the amount of rows returned from the database query, and how long it takes to get those rows back. It is a good idea to check with the DBA before running long-running queries against a database. Also, check the execution plan of the query before running it. Perhaps further indexing can be done. Lastly, don't bring back any more rows than needed. Modern RDBMs are very good at sorting and grouping data. Let the RDBMS group and sort the data where it can; this saves CPU cycles on the Report Server as well as the network traffic.
Second, take into account the rendering format. You should note that different rendering extensions have different effects on the Report Server. The fastest extensions and those that use the least amount of RAM are those whose output is essentially text—MHTML, CSV, and XML. Excel and PDF are very resource intensive, whereas TIFF and JPEG fall in between the two extremes.
Third, take into account the delivery method of the report. If a report uses pagination, it can be rendered like any other report. The default rendering format is HTML, which includes a soft page break. The page break is included intentionally and, in effect, produces a sort of poor man's paging. If a report is extremely large, this helps to deliver it via browser. If the report is delivered via subscriptions, it makes sense to deploy it to a file share and let the user's desktop be responsible for opening it. This takes the load off the Report Server and is the recommended course of action if using PDF or Excel.
The following list includes some general tips to help handle large reports:
• Make sure the report supports pagination.
• Run the report as a scheduled snapshot, and do not let it be run on demand.
• Set the report to use a shared data source. Shared data sources can be disabled, ensuring the report cannot be run on demand.
• Limit access to the report to ensure that only those who need to run it can run it.
Report Execution History
In these days of endless audits, SOX (Sarbanes-Oxley), and now PCI (Payment Card Industry), it is becoming essential to know when someone within an organization accesses data. It is also helpful to know this information from an organizational and planning perspective. As more and more reports get published, how often reports get looked at and by whom could be essential information.
What Is the Execution Log?
To address these issues, SSRS keeps an execution log of reports that it has run. Because the database is what stores the data, the log is still good, even in a scale-out environment. The log has a myriad of useful information, such as what reports are run, who has run them, and how long they took to process. Some of the other information it has includes the following:
• Name of the physical machine that ran the report (Report Server—not database server)
• Unique ID of the report
• Unique ID of the user running the report
• Whether the request came from a user or system process
• What rendering format was used
• Values of the report parameters
• When the report process started and when it finished
• Amount of time the server took to process the report in milliseconds
• Type of data used for execution (live, cached, snapshot, history)
• Final status code of the report processing (success or first error code)
• Final size of the rendered report in bytes
• Number of rows returned in the data sets of the rendered reports
How to Report Off the Execution Log
The downside of the execution log is that it is not in a human-readable format. To remedy this, Microsoft has distributed a SQL Server Integration Services Package that can be used to port the data from the Report Server's internal execution log table to another database to be used for querying and reporting against the log. There are even some sample reports against the resulting execution log table. If you are still using SQL Server 2000, an equivalent DTS package does the same thing.
Three files are central to the extraction and reporting of the execution log. All three files should be located in the <Program FilesMicrosoft Sql Server90SamplesReporting ServicesReport SamplesServer Management Sample ReportsExecution Log Sample Reports> directory. The first file is Createtables.sql, which is the script used to create the tables for the RSExecutionLog database. The second two files, RSExecutionLog_Update.dtsConfig and RSExecutionLog_Update.dtsx, form the integration package that pushes the data from the Report Server catalog into the RSExecutionLog database.
Creating the RSExecutionLog Database
You can create the RSExecutionLog database by completing the following steps (see Figure 20.2):
1. Open SQL Server Management Studio, connect to the database engine, and select Master as the default database.
2. Run the following query:
create database RSExecutionLog
go
use RSExecutionLog
go
3. Open the createtable.sql file and execute it in the RSExecutionLog database. The results of the script should be as follows:
Dropping tables...
Creating ReportTypes...
Creating Reports...
Creating Users...
Creating Machines...
Creating RequestTypes...
Creating SourceTypes...
Creating FormatTypes...
Creating StatusCodes...
Creating ExecutionLogs...
Creating ExecutionParameters...
Creating RunLogs...
Script completed.
4. Double-click on the dtsx file and click Execute to execute the package.
Figure 20.2. RSExecutionLog SSIS package.
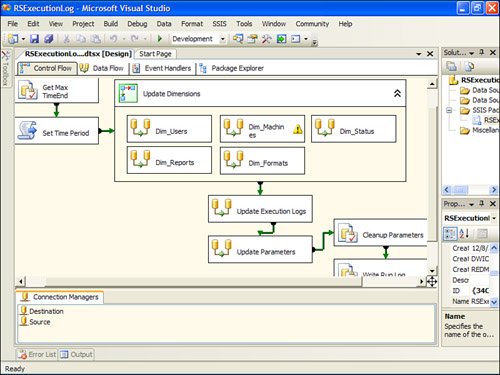
To keep data in the RSExecutionLog database current, periodically run the integration package. The package is designed to import new data, without overwriting or removing existing data. To remove old data in the RSExecutionLog database, run the Cleanup.sql script.
Overview of the Sample Reports
Three reports come included with the sample reports packages.
The first report (Execution Status Codes.rdl) includes a summary of reports run by the status they received. This shows the failure rate of reports on the server as well as why the processes failed.
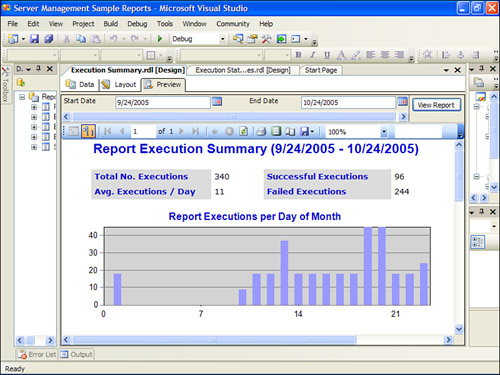
The second report (Execution Summary.rdl) gives an overview of report executions. It includes some key metrics, such as the number of report processed per day, the top ten most requested reports, and the longest-running reports. This report is shown in Figure 20.3.
Figure 20.3. Report Execution Summary report.
The last report (Report Summary.rdl) is similar to the execution summary, but gives the execution overview of a specific report.
The sample reports can actually be published to the Report Server and accessed like any other report (they get logged like any other report as well). The only caveat with these reports is having to set the end date to one day ahead of the current date to include the current day's execution. The reason for this is that the date parameters have no way to accept time, and, hence, time default to 12:00 a.m. (start of the day). This might come up as an issue when you develop your own reports as well.
Summary
Report schedules allow the coordination of activities within the Report Server. There are two types of schedules—report-specific schedules and shared schedules. The relationship between the two is analogous to the relationship between a custom-defined data source and a shared data source.
A job is any process running on the Report Server. SSRS comes by every 60 seconds to poll what processes are running on the Report Server. Report execution history gives the end users the ability to retrieve from SSRS who accessed what report, when, and using what parameters. Using a SQL Server Integration Services package, you can collect this information into a database for auditing purposes. SSRS comes with three sample reports to query this information from the catalog.